


The Polar Regions and Global Climate
Introduction
The polar renions play a crucial role in global climate change. They are sensitive indicators of change, and their snow and ice features are good integrators of change. They store long-term climatic records in their ice sheets, such as the Antarctic and Greenland ice sheets. They also affect the global climate directly through interactions between their atmospheres, ice cover and oceans, and through feedback processes. Practically all climate models predict an amplification of the global greenhouse effect at high latitudes, but models as well as observations have produced results that tire not easily interpreted. The reports from the Intergovernmental Panel on Climate Change (IPCC; Houghton and others. 1990; Reference Watson, Zinyowera, Moss and DokkenWatson and others, 1996; Everett and of hers, in press summarize the stale of our know ledge.
Polar-global interactions
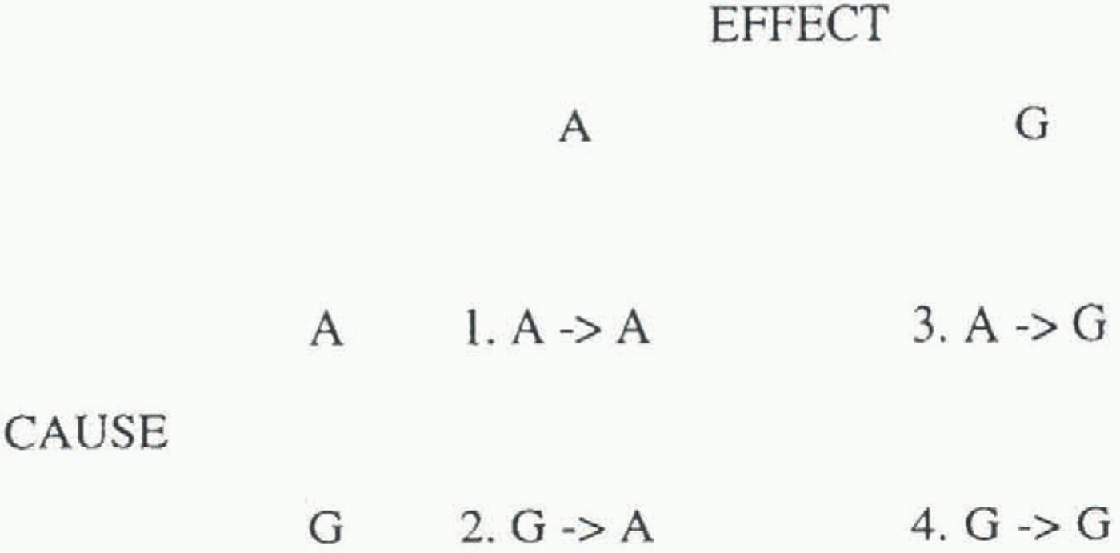
The role of the Arctic and Antarctic in global climate change can be illustrated by a simple matrix. This cause effect matrix has four elements, as show n in Figure I.
The second element shows a global cause with a polar effect, e.g. global greenhouse warming aflècting the Arctic and Antarctic environment and producing such results its melting ice and thawing permafrost. The third element illustrates Arctic and Antarctic causes with global effects, such as (Hilar feedback processes on the global climate. The first and fourth elements which address non-global and non-polar connections, respectively, are relevant in the context of  and
 interactions and feedbacks.
Among the Arctic/Antarctic causes with global effects are a number of important feedback processes that amplify climate change in the high latitudes and globally, rite albedo snow-cover temperature feedback (Reference Kellogg, Weller and BowlingKellogg, 1975) is one of The main causes of The amplification of The greenhouse effect in the polar regions. Permafost trace-gas
Cause effect matrix for polar and global interactions. A, Arctic/Antarctic; G,global.
Projected northward movement of the permafrost boundary and the tree line after a doubling of atmospheric CO2 (from Environment Canada. 1989, extrapolated into Alaska).

temperature feedbacks could also be important in the Arctic. If more CO2 and CH4 is released When permafrost thaws, this will increase the atmospheric temperature and will result in more permafrost thawing. Melting oi glaciers and ice sheets, including the large Antarctic and Greenland ice sheets, raises the global sea level, and the collapse of large ice sheets has been postulated as a possible trigger of the major, rapid climate changes during the last ice age. as seen in the Greenland ice-core results Reference AlleyAlley and others. 1993).
Global effects on the Arctic and Antarctic are reflected in regional climate changes and their consequences. Practically all the snow and ice features of the polar regions will be affected in one way or another. While there is still uncertainty about the mass balance of Antarctica and Grreenland, the extent and thickness of the seasonal snow cover, sea ice, permafrost, glaciers and river and lake ice are all expected to decrease as the climate warms. These changes, in turn, will affect the polar ecosystems, with their distinct fauna and flora. Socio-economic consequences for populations, industry and lifestyles will be inevitable. Not all of these latter changes are necessarily negative; for example, less sea ice may allow the opening of trans-Arctic shipping routes and easier offshore petroleum exploration (Weller, 1992).
All example of the consequences of climate change for the polar environment is shown in figure 2. It shows dramatic changes of the permafrost extent on the North American continent after a doubling of atmospheric CO2 (from Environment Canada. 1989. extrapolated into Alaska). Most of the patchy and discontinuous permafrost in Canada and Alaska will thaw, according 10 this prediction, pushing the permafrost boundary up to 1000 km north. Reference OsterkampOsterkamp'S (1994) observations confirm that permafrost is presently thawing in Alaska as well as in Siberia, file tree line is also projected to make major advances northward, as shown in Figure 2.
Predicting Climate Change
Modeling results
In order to predict the possible impacts of climate change, scenarios of future climates must be constructed. This is a difficult undertaking since the climate of any region and of Earth as a Whole is being influenced by many different driving forces, some of which are cyclic or quasi-cyclic (e.g. sunsports, El Niño Southern Oscillation (ENSO) events) and some of which are not. Reference Proshutinsky and JohnsonProshutinsky and Johnson (1997), for example, have shown the atmospheric circulation over the Arctic Ocean to alternate between “typical” anticyclonicv and cyclonic circulation regimes approximately every 10-15 years. Superimposed on this, however, there appears to be a longer-term warming trend that may well be associated with the greenhouse effect which is the main topic of cortr Cera in this paper.
Numerous global climate models (GCMs) have been used to attempt to simulate the global climate under enhanced greenhouse conditions. All these models show a temperature amplification in the annual mean in the Arctic, largely due to snow/ice feedbacks; this amplification is most pronounced in winter and spring. These results are the basis of the World Meteorological Organization/United Nations
Comparison of the outputs of 19 GCMs of seasonal mean surface air temperatures over the Arctic Ocean with observations. Except in spring, the models generally show a cold bias (from Reference Tao, Walsh and ChapmanTao and others, 1996).

Environment Program IPCC (Houghton and others, 1990; Watson and others, 1996) predictions that the Arctic will warm more than the global mean, particularly in winter. On the other hand, the IPCC report predicts Arctic land masses to warm more rapidly than the ocean, while some models show the greater temperature increases over the Arctic Ocean.
A recent comparison (To and others. 1996) of GCM performances in the Arctic shows the wide divergence of results (Fig. 3). The temperature simulations for the seasonal mean surface ail temperatures in the Arctic Ocean of 19 GCMs were compared with observations. The majority of the models produced temperatures thai were too cold, except in spring. One possible reason for the cold bias is that
Illustration of the difference in resolution between typical GCMs and regional, mesoscale models.

Observed trends of Arctic annual mean temperatures, 1966-95. Considerable warming has taken place over the land masses. Data from Climate Research Unit of the University of East Anglia, originally analyzed by Chapman and Walsh (1993) for 1961-90 and updated for 1966-95.

leads in the iee and their associated heat flux into the atmosphere were not used in these models. Simulated temperature differences between the models were as high as 10° C.
Simulation of other climates parameters also showed great differences. Sea-level pressure was well simulated by several models, particularly the ones with higher resolution; Precipitation was too huge, in some eases by more than it factor of two. There were wide variations in cloud cover, but some models showed qualitatively correct seasonal cycles. For some variables (temperature, precipitation), biases and model-to-model differences are comparable to observational uncertainties (Tao and others, 1996).
Another problem of the GCMs is their coarse spatial resolution. To overcome this, regional climate models for the Arctic have been developed (e.g. Reference Lynch, Chapman, Walsh and G.Lynch and others, 1995). Their much higher resolution reproduces a much belter physical resemblance, in topography, surface characteristics, including vegetation and hydrology, and boundary-layer characteristics and processes, to the natural environment of the region than do GCMs. Figure 4 illustrates the difference in resolution between typical GCMs and regional, mesoscale models.
Because of these difficulties in projections of future polar climates, the reliability of the simulated climate-change scenarios is not high. However, most of the GCM models show the following features: greater warming over land than Over sea; reduced warming, or even cooling, in the high-latitude Southern Ocean and part of the northern North Atlantic Ocean; maximum warming in high northern latitudes in winter, and little warming over the Arctic in summer; increased precipitation and soil moisture in high latitudes in winter; a reduction in the strength of the North Atlantic currents; and a widespread reduction in diurnal range of temperature (Everett and others, in press, section 3.2). While most of these results follow presently observed trends, some (e.g. Southern Ocean temperatures) tire contradicted by observations.
IPCC assessment
The latest update of the IPCC report (Watson and others, 1996) includes a chapter (chapter 7 of Working Group II on the cryosphere) on climate change and its impacts on the polar regions. Changes in the climates of the polar regions will be indicated not only by atmospheric temperature changes but also by other parameters, including the snow and ice features of the cryosphere:
Many components of the cryosphere are sensitive to changes in atmospheric temperature because of their thermal proximity to melting. The extent of glaciers has often been used as an indicator of past global temperatures (High Confidence).
Projected warming of the climate will reduce the area and volume of the cryosphere. This reduction will have significant impacts on related ecosystems, associated people and their livelihoods (High Confidence).
There will be Striking changes in the landscapes of many high mountain ranges and of lands at northern high latitudes (High Confidence. These changes may be exacer-baled where they are accompanied by growing numbers of people and increased economic activities (Medium Confidence.
Observed trends of Antarctic annual mean temperatures, 1966-95. Data from Climate Research Unit of the University of Eust Anglia, analyzed by W.L. Chapman and J. E. Walsh (unpublished information).

Evidence of Climate Change
Polar trends
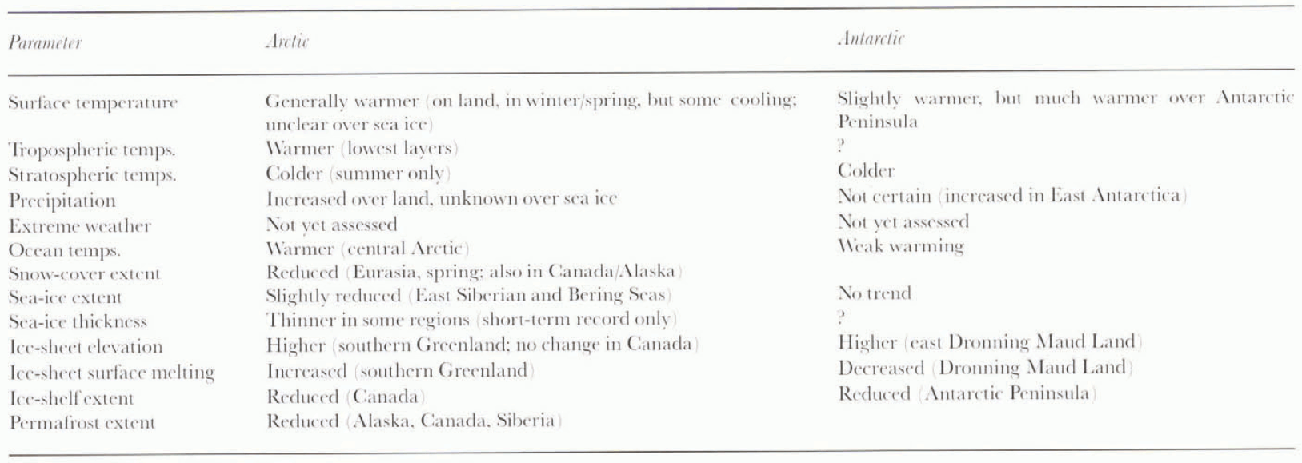
Discussion of the detection of the greenhouse signal in polar legions usually revokes around two questions; (1) Are we now seeing the greenhouse signal in polar regions? (2) If, not flow and when will the signal manifest itself?. At a conference on global change and the polar climate at Tsukuba, Japan, in November 1995 (Walsh and others, 1996), the discussions led to the table below (Table I). summarizing the observational evidence from the past few decades.
A view that emerged on several occasions was thai the “traditional” emphasis on sea-ice extent and Arctic Ocean air temperatures as early indicators may yield to a broader fingerprint involving information from ice cores, sea-ice concentration and thickness, subpolar sea-surface temperatures, subsurface polar ocean temperatures, and high-latitude precipitation. The set of variables in Table 1 shows some evidence of recent changes that are consistent with those anticipated from anthropogenic influences. However, the only long records are for surface temperatures, and even these are not long enough to distinguish unambiguously the natural and anthropogenic influences (Walsh and others. 1996).
Summary of changes observed in the high latitudes over the last few decades of the 20th Century (from Walsh and others, 1996)
The Arctic
Chapman and Walsh (1993) examined the climate trends in the Arctic for the period 1961-90, using the climate dataset of the Climate Research Unit of the University of East Anglia (Reference Jones, Riper, Bradley, Diaz, Kelly and WigleyJones and others. 1986). Their analysis, as well as their updated results for 1966-95 (Fig. 5), indicates considerable warming over the hind masses of Eurasia and North America, particularly in winter and spring. Over the last three decades, trends of up to 1.5°C per decade have been towards higher temperatures. On the other hand, there are also smaller areas of cooling of similar magnitude with in the Arctic legions, particularly in the southern Greenland and Davis Strait area. Chapman and Walsh considered the data coverage in the Arctic Ocean to be insufficient to draw any clear conclusions.
Apparently contradictory results about climatic trends in the Arctic are given by Reference Kahl, Charlevoix, Zaitseva, schnell and SerrezeKahl and others (1993), who found “no significant Arctic temperature increase during the past several decades”, and Chapman and Walsh (1993) who found “distinct warming over the northern land areas during winter and spring” during the past several decades. The problem may lie in the definition of the Arctic. A widely accepted definition is that the Arctic regions are those that have a seasonal or perennial sea-ice cover over the ocean, and discontinuous or continuous permafrost underlying the land. This is a more meaningful, climate-related definition than geographical boundaries like the Arctic Circle. While Chapman and Walsh's results refer to the broader area defined above. Kahl and others' results apply to the Arctic Ocean only.
In many different parts of the world, pronounced reductions in seasonal snow, glaciers, permafrost and sea ice have also been observed. in the Arctic, the following observations have been made.
Sea-ice extent in the Bering Sea has been reduced by about 5% over the last 40 years, the steepest decrease occurring in the late 1970s (BESIS. 1997). Sea-ice extent has also decreased in the East Siberian Sea.
Sea-ice thickness, a sensitive indicator of climate change, seems to have decreased between 1970 and 1987. based on limited submarine records Reference WadhamsWadhams, 1990).
Glaciers have generally receded, with typical ice-thickness decreases of 10 m over the last 10 years, but some glaciers have thickened in their upper regions (BESIS, 1997). A warming of 1°C if sustained, appears to reduce glacier lengths by about 15%.
Borehole measurements in continuous permafrost have shown warming of up to 2-4°C (Lachenhruch and Marshall, 1986).
Discontinuous permafrost throughout Alaska has wanned, and some of it is currently thawing from the top and bottom (Osterkamp, 1994).
Cyclone and anticyclone frequency has increased over the Arctic between 1952 and 1989 (Everett and others, in press, section 3.2).
Annual snowfall has increased during the same period by about 20% over northern Canada north of 55°N and by about 11% over Alaska (Everett and others, in press, section 3.2).
The available data also point to a more vigorous atmospheric circulation associated with a deepening of both the Icelandic and Aleutian Lows (Reference Maxwell and W. C.Maxwell, 1995). The primaiy reason for a warmer climate in the western Arctic, for example, is that more southerly flow occurs in winter coupled with less northerly flow of cold air from Siberia. Similarly, the cooler climate in southern Greenland is most likely related to a shift in the circumpolar Wave pattern with increased northerly flow in that region. Whether this is triggered by the greenhouse effect is not clear at present.
The Antarctic
Analyses of temperature trends in Antarctica from 1996 to 1995 (Fig. 6) have been carried out by W. L. Chapman and J. E. Walsh (unpublished information), similar to the Arctic analyses discussed earlier. Strong wanning in winter and spring (Upto 0.75°C per decade) occurred over the Antarctic
Winter (June-August), summer (December-February) and annual temperatures in Antarctica (65-90°S). The data come from the land-based compilation of Jones (1994) and are expressed as anomalies from 1961 to 1990. Station data for annual temperatures for the South Orkneys, Faraday and McMurdo also include expedition records from the late 1890s and the 1940s. The smoothed lines are based on 10 year Gaussion filters.

Peninsula and over much of the interior of the continent during this period. in summer and fall, however, cooling of up to 0.75°C per decade took place over the entire continent. Trends analyzed by Jones (1995) show warming at the South Orkneys since 1900; al Faraday (Antarctic Peninsula) since the 1940s when records started there; and for the entire continent in winter hut not summer, since the International Geophysical Year, 1957-58 (Fig. 7). While the Antarctic has not experienced major changes in the mass balance of its large ice sheet or its sea-ice extent and thickness, it has lost large ice masses from its ice shelves in recent decades (e.g. Reference Rott, Skvarca and NaglerRott and Others, 1996). Other observed changes (Everett and others, in press) are as follows:
Significant increases in precipitation by (5-10%) over the same time period.
Break-up of the Larsen and Wordie lce Shelves in the Antarctic Peninsula area, and discharge of enormous Icebergs from the Filehner and Ross lce Shelves.
Large increases (480 mma−1) in the water level of lakes in the McMurdo Dry Valleys.
A reduction in the ice cover of the lakes in the Dry Valleys (Lake Hoare by 20 cm a−1 since 19771).
These changes may be due to mans different factors, however, and future impacts must be analyzed through proper impact assessments of climate change, as described in the next section.
Impacts of Climate Change
Impact assessment
Regional assessments of impacts due to global climate change have become a high priority on the international agenda of the International Geosphere Biosphere Program (ICBP), the World Cliamte Research Program and the Human Dimensions Program of global change. Impact assessments provide an excellent means of interdisciplinary analysis and synthesis; this is one of the reasons why both the U.S. and Canadian global-change research programs now put ureal emphasis on them. in the end it is the importance of addressing the regional impacts of climatic change on society thai underlies our fundamental concern about global change. The IGBP (1991) provides a good rationale for this regional emphasis: “First, the, research needed to develop a global perspective demands that regional differences in characteristics such as biogeography and climate be taken into consideration. Second, the goal of a practical predictive capability for global environmental change makes it necessary that ibis capacity be developed for distinct subcontinental regions. Global change predictions will be of greatest value to decision makers on a regional basis, and if scientists from throughout the region are involved from the start in the processes through which change is generated."
No comprehensive Arctic regional impact assessments have been attempted to date, with the possible exception of the Canadian Mackenzie Basin Impact Study (Reference CohenCohen. 1997). However, synthesis efforts to assess regional impacts in the Arctic (Barents Sea and Bering Sea) have begun under the auspices of the International Arctic Science Committee (BESIS, 1997). Criteria for the selection of these two regions included their importance as economic zones and weather generators, and sensitivity to climate, as well as the presence of local native populations, regional scientific expertise, research gaps to be addressed and the availability of potential funding to address these issues. No comprehensive Antarctic climate impact assessments have been carried out to the author's knowledge.
Interdisciplinary impact assessments are a difficult undertaking, and questions that have arisen concerning the nature of the impact assessments include:
-
1. What are the time-scales for which the impact assessments should occur?
-
2. What are The space-scales?
-
3. Who are the potential users/stakeholders who would benefit from impact assessinenis.?
-
4. What are the problems and issues facing the siake-holders?
Time-scales
Different time-scales have been considered to be important for the impact assessments (e.g. ARCUS, 1996);
-
1. Seasonal to interannual (1-5 years). This covers the ENSO time-frame Where some forecasting ability exists.
-
2. Decadal (20 years). This is the time-scale of immediate practical concern to stakeholders for whom longer time-scales are of little practical value. Predictions over this time-scale are considerably more difficult than over the 1-5 year time-scale.
-
3. Century (100years). This is the greenhouse-effect time-scale of interest to scientists and climate modelers, and the time-scale for significant human impacts of such processes as sea-level change and soil-fertility change.
-
4. Longer-term. Some effects of global change (e.g. bio-accumulation of contaminants) will be felt over these time-scales and must be considered in impact assessments.
Space-scales
The scope of impact assessinenis ideally should be pan-Arctic or Antarctic, bin because this is a complex undertaking there should be, initially at least, a focus on smaller regions of particular interest. Such regions can be identified on the basis of climatic anomalies, for example, among other parameters. While most of the Arctic land masses have experienced considerable warming over the last few decades, the exstern part of Canada and southern Greenland have cooled. The circumpolar vortex and planetary wave pattern not only influence these climatic anomalies but also affect pollutant transport in the atmosphere and should be considered in choosing appropriate areas for impact assessments. Within a particular region, however, orographic and coastal influences result in significant variations over scales of 100 m or less.
Users/stakeholders
The Users and stakeholders with interest in the impact assessments have sometimes been identified as follows (e.g. ARCUS, 1997):
-
1. Residents. This category is mostly relevant to the Arctic and includes indigenous and other people, both rural and urban. Indigenous people face threats of changes to their traditional hunting/fishing/subsistence lifestyles when snow, sea-ice and permafrost conditions change, Changes in other living conditions (e.g. housing, trans-portation, health, sanitation) will affect all Arctic resi-dents.
-
2. Users of polar resources. These include local as well as distant consumers, and industry utilizing the resources, both renewable and non-renewable. The Arctic is an important global source of petroleum and fish, and the Antarctic for fish and krill. Oil and gas reservoirs exist in Russia. Canada and Alaska, and the Bering Sea remains one of the world's most important fisheries. Changes in these regions will affect production, trans-portation, availability and cost of these resources to the local and global community.
-
3. Ecosystems and wildlife. These are stakeholders, too, since change will affect them A change in climate will entail changes in the supply of nutrients and energy. There may be further human encroachments and disturbances of habitats and ecosystems, and increasing contamination may have greater effects.
-
4. Global community. Not only will access to polar resources and their cost affect the global community, but other changes in the polar regions will also have global consequences, This includes sea-level rise due to the melting of glaciers and ice sheets, and pillar feedback processes (albedo, clouds, trace gases, thermohaline cir-culation. etc.) on the global climate.
-
5. Enture people/generations. Many other stresses on the global Community will also affect future generations living in the Arctic. These stresses include rising population pressure, depletion of resources such as water and soil, increased pollution and contamination, and reduced biodiversity and cultural diversity.
Polar-regions impacts
Based on the IPCC assessment (Watson and others. 1996, chapter 7 of Working Group II) for a 2 X CO2 scenario, the following changes and Lissociaied impacts on the polar regions are likely, listing the degree of confidence in these predictions.
Pronounced reductions in seasonal snow, permafrost, glacier and periglacial features with a corresponding shift in landscape processes (High Confidence).
Increases in the thickness of The active layer of permafrost and the disappearance of most of the ice-rich discontinuous permafrost over a century-long time-span (High Confidence).
Disappearance of up to a quarter of the presently existing mountain glacier mass (Medium Confidence).
Lcss ice on rivers and lakes. Freeze-up dates will be delayed, and break-up will begin earlier, file liver-ice season could be shortened by up to a month (Medium Confidence).
A large change in the extent and thickness of sea ice. not only from warming but also from changes in circulation patterns of both atmosphere and oceans. There is likely to be substantially less sea ice in the polar oceans (Medium Confidence).
As a result of these changes in the cryosphere, the following impacts on other systems are expected:
Widespread loss of discontinuous permafrost will trigger erosion or subsidence of ice-rich landscapes, change hydrologic processes, and release carbon dioxide (CO2) and methane (CH4) to the atmosphere High Confidence).
Cryospheric change will reduce slope slabilily and increase the incidence of natural hazards for people, structures and communication links. Buildings, other structures, pipelines and communication links will be threatened High Confidence.
Engineering and agricultural practices will need to adjust to changes in snow, ice and permafrost distributions High Confidence.
Thawing of permafrost could lead to disruption of petroleum production and distribution systems in the tundra, unless mitigation techniques tire adopied. Reduced sea ice may aid new exploration and production of oil in the Arctic basin (High Confidence).
Improved opportunities for water transport, tourism and trade are expected from a reduction in sea, river and lake ice. These Will have important implications for the people and economics of the Arctic (Medium Confidence).
Problems associated with permafrost thawing could be particularly severe, and deserve special attention in the Arc-
Temperature profiles measured at Healy, Alaska, in discontinuous permafrost frost terrain. Since much of the discontinuous permafrost Zone is close to melting point, even a slight warming will eventually thaw all of it. (illustration provided by T. Osterkamp.)

Projected impacts due to a 3 °C warming of permafrost
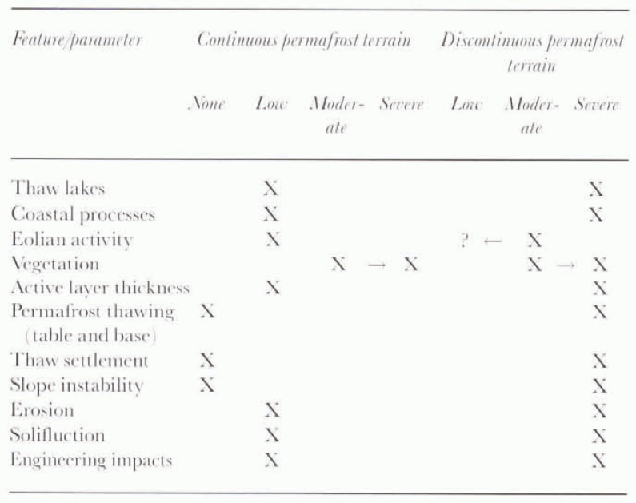
tic. The temperature profile at Healy, Alaska, near Denali Park (Fig. 8), is typical of much of Alaska, and illustrates the warming of the permafrost. The mean surface temperature is Warmer then -1°C, and thermokarst is developing in many areas. The Arctic and sub-Arctic landscape could undergo substantial large-scale changes in the discontinuous permafrost. zone that underlies much of Alaska. Canada and Siberia. Permafrost melting in the Mackenzie River catchment area, for example, has already led to widespread river-bluff landslides and erosion (Cohen, 1997). Table 2 shows the severity of likely impacts.
Socio-economic impacts
Socio-economic impacts caused by climate change could include those listed in Table 3 (BESIS, 1997), Most of them apply to the Arctic only.
Antarctic impacts
The Antarctic is less vulnerable than the Arctic, because of the greater sensitivity and more fragile ecosystems of the latter, and because there are impacts on traditional lifestyles of indigenous peuples in the Arctic. Climate changes are also expected to be smaller in the Antarctic. While little change is expected on the Antarctic continent over the next 50years, climatic change in the Southern Ocean could result in major impacts, for example:
Changes in the extent and duration of sea ice will affect the entire Antarctic marine ecosystem, including the distribution, mass and harvestability of krill.
Changes in wind strength, the effects on the Antarctic Convergence, and the current system of the .Southern Ocean may affect the productivity of the ice-edge zone.
Permafrost and glaciers tire present in Antarctica on some sub-Antarctic islands and their thawing or melting, respectively, may afiect soil and vegetation.
While it is expected that the sea-ice edge will retreal southward Jacka and Budd, 1901. feedback mechanisms, including upper ocean structure and pycnocline depth, will likely adjust the impacts of changes.
No comprehensive regional impact studies have been performed in Antarctica, but it lias been suggested that a good candidate region would be the Antarctic Peninsula Weddell Sea area. Climate warming and ice-shelf disintegration have been observed there. The Weddell Sea system, i.e. the region bound by 65° wand 0° longitude and 60° S and 83° S latitude, has a special place within Antarctica. It contains one of the largest ice shelves in Antarctica, which is known to interact in particular ways with the underlying ocean through the formation of marine ice on its lower boundary. The Weddell Sea is the region containing perennial sea ice of the largest extent in Antarctica. The Weddell Gyre, a cyclonic current system, regulates water and sea-ice transport in The Weddell Sea. Marine life is very active in the Weddell Sea. containing enormous stocks of phyto- and Zooplankton, fish, benthos, penguins, seals and birds, which all depend on the oceanic and sea-ice conditions in the Weddell Sea. Katabatic winds off the ice shelves create coastal polynyas and enhance sea-ice growth in front of the ice shelves. This in turn leads to the chain of processes which result in the formation of marine ice underneath the Rlchner-Ronne lee Shelf (Reference Lange and MacAyealLange and MacAveal, 1986).
Conclusion
Regional assessments of impacts due to global climate change are receiving increasing attention in the international global-change agenda. in the end, it is the importance of addressing the impacts on society of regional climatic change that underlies our fundamental concern about global change. Despite many uncertainties, impact assessments provide an excellent means of interdisciplinary analysis and synthesis of change; this is the underlying philosophy of all ongoing studies of this kind.
Socio-economic impacts due to climate change in various sectors
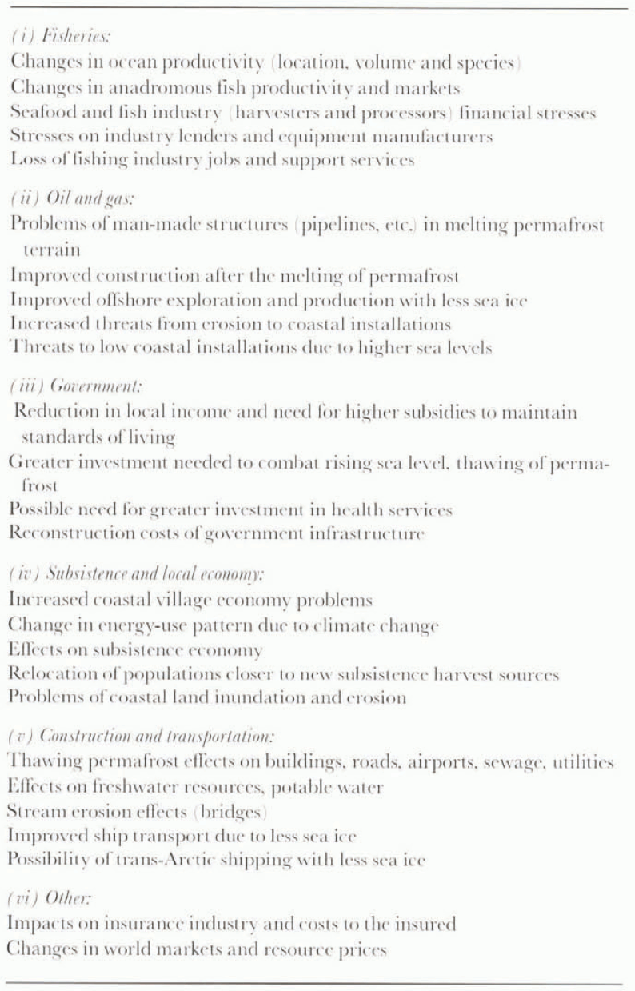
While some data are available on the physical and biological consequences of climate change, few reliable data exist to assess the impacts of climate change on economic activities. Future projections aredifficult due to the many additional complex factors that also affect regional economic performance. It is clear, however, that not all impacts of climate change tire adverse. in many instances, climate change may lead to initial problems, as in the case of man-made structures on thawing permafrost, but once permafrost has disappeared, which may take considerable time, construction on former permafrost terrain will be greatly simplified. Successful future adaptation to change depends on technological advances, institutional arrangements, availability of financing and information exchange.
Many other problems remain in adequately assessing climate impacts in the polar regions. Dala sources are Sparse, particularly in the ocean, and analysis and synthesis efforts must bring the diverse data and information sels together. Additional fieldwork is needed in some areas, though there tire many existing and planned research projects. Future workshops must lead to iterative improvements of the entire impact-assessment process. While some impact assessinenis have begun in the Arctic, there are not yet any such Studies in Antarctica.



