


%20--%3e%3c!DOCTYPE%20svg%20PUBLIC%20'-//W3C//DTD%20SVG%201.0//EN'%20'http://www.w3.org/TR/2001/REC-SVG-20010904/DTD/svg10.dtd'%3e%3csvg%20version='1.0'%20id='Layer_1'%20xmlns='http://www.w3.org/2000/svg'%20xmlns:xlink='http://www.w3.org/1999/xlink'%20x='0px'%20y='0px'%20width='64px'%20height='64px'%20viewBox='5.5%20-3.5%2064%2064'%20enable-background='new%205.5%20-3.5%2064%2064'%20xml:space='preserve'%3e%3cg%3e%3ccircle%20fill='%23FFFFFF'%20fill-opacity='0'%20cx='37.785'%20cy='28.501'%20r='28.836'/%3e%3cpath%20fill='%23595959'%20d='M37.441-3.5c8.951,0,16.572,3.125,22.857,9.372c3.008,3.009,5.295,6.448,6.857,10.314%20c1.561,3.867,2.344,7.971,2.344,12.314c0,4.381-0.773,8.486-2.314,12.313c-1.543,3.828-3.82,7.21-6.828,10.143%20c-3.123,3.085-6.666,5.448-10.629,7.086c-3.961,1.638-8.057,2.457-12.285,2.457s-8.276-0.808-12.143-2.429%20c-3.866-1.618-7.333-3.961-10.4-7.027c-3.067-3.066-5.4-6.524-7-10.372S5.5,32.767,5.5,28.5c0-4.229,0.809-8.295,2.428-12.2%20c1.619-3.905,3.972-7.4,7.057-10.486C21.08-0.394,28.565-3.5,37.441-3.5z%20M37.557,2.272c-7.314,0-13.467,2.553-18.458,7.657%20c-2.515,2.553-4.448,5.419-5.8,8.6c-1.354,3.181-2.029,6.505-2.029,9.972c0,3.429,0.675,6.734,2.029,9.913%20c1.353,3.183,3.285,6.021,5.8,8.516c2.514,2.496,5.351,4.399,8.515,5.715c3.161,1.314,6.476,1.971,9.943,1.971%20c3.428,0,6.75-0.665,9.973-1.999c3.219-1.335,6.121-3.257,8.713-5.771c4.99-4.876,7.484-10.99,7.484-18.344%20c0-3.543-0.648-6.895-1.943-10.057c-1.293-3.162-3.18-5.98-5.654-8.458C50.984,4.844,44.795,2.272,37.557,2.272z%20M37.156,23.187%20l-4.287,2.229c-0.458-0.951-1.019-1.619-1.685-2c-0.667-0.38-1.286-0.571-1.858-0.571c-2.856,0-4.286,1.885-4.286,5.657%20c0,1.714,0.362,3.084,1.085,4.113c0.724,1.029,1.791,1.544,3.201,1.544c1.867,0,3.181-0.915,3.944-2.743l3.942,2%20c-0.838,1.563-2,2.791-3.486,3.686c-1.484,0.896-3.123,1.343-4.914,1.343c-2.857,0-5.163-0.875-6.915-2.629%20c-1.752-1.752-2.628-4.19-2.628-7.313c0-3.048,0.886-5.466,2.657-7.257c1.771-1.79,4.009-2.686,6.715-2.686%20C32.604,18.558,35.441,20.101,37.156,23.187z%20M55.613,23.187l-4.229,2.229c-0.457-0.951-1.02-1.619-1.686-2%20c-0.668-0.38-1.307-0.571-1.914-0.571c-2.857,0-4.287,1.885-4.287,5.657c0,1.714,0.363,3.084,1.086,4.113%20c0.723,1.029,1.789,1.544,3.201,1.544c1.865,0,3.18-0.915,3.941-2.743l4,2c-0.875,1.563-2.057,2.791-3.541,3.686%20c-1.486,0.896-3.105,1.343-4.857,1.343c-2.896,0-5.209-0.875-6.941-2.629c-1.736-1.752-2.602-4.19-2.602-7.313%20c0-3.048,0.885-5.466,2.658-7.257c1.77-1.79,4.008-2.686,6.713-2.686C51.117,18.558,53.938,20.101,55.613,23.187z'/%3e%3c/g%3e%3c/svg%3e)
%20--%3e%3c!DOCTYPE%20svg%20PUBLIC%20'-//W3C//DTD%20SVG%201.0//EN'%20'http://www.w3.org/TR/2001/REC-SVG-20010904/DTD/svg10.dtd'%3e%3csvg%20version='1.0'%20id='Layer_1'%20xmlns='http://www.w3.org/2000/svg'%20xmlns:xlink='http://www.w3.org/1999/xlink'%20x='0px'%20y='0px'%20width='64px'%20height='64px'%20viewBox='5.5%20-3.5%2064%2064'%20enable-background='new%205.5%20-3.5%2064%2064'%20xml:space='preserve'%3e%3cg%3e%3ccircle%20fill='%23FFFFFF'%20fill-opacity='0'%20cx='37.637'%20cy='28.806'%20r='28.276'/%3e%3cg%3e%3cpath%20fill='%23595959'%20d='M37.443-3.5c8.988,0,16.57,3.085,22.742,9.257C66.393,11.967,69.5,19.548,69.5,28.5c0,8.991-3.049,16.476-9.145,22.456%20C53.879,57.319,46.242,60.5,37.443,60.5c-8.649,0-16.153-3.144-22.514-9.43C8.644,44.784,5.5,37.262,5.5,28.5%20c0-8.761,3.144-16.342,9.429-22.742C21.101-0.415,28.604-3.5,37.443-3.5z%20M37.557,2.272c-7.276,0-13.428,2.553-18.457,7.657%20c-5.22,5.334-7.829,11.525-7.829,18.572c0,7.086,2.59,13.22,7.77,18.398c5.181,5.182,11.352,7.771,18.514,7.771%20c7.123,0,13.334-2.607,18.629-7.828c5.029-4.838,7.543-10.952,7.543-18.343c0-7.276-2.553-13.465-7.656-18.571%20C50.967,4.824,44.795,2.272,37.557,2.272z%20M46.129,20.557v13.085h-3.656v15.542h-9.944V33.643h-3.656V20.557%20c0-0.572,0.2-1.057,0.599-1.457c0.401-0.399,0.887-0.6,1.457-0.6h13.144c0.533,0,1.01,0.2,1.428,0.6%20C45.918,19.5,46.129,19.986,46.129,20.557z%20M33.042,12.329c0-3.008,1.485-4.514,4.458-4.514s4.457,1.504,4.457,4.514%20c0,2.971-1.486,4.457-4.457,4.457S33.042,15.3,33.042,12.329z'/%3e%3c/g%3e%3c/g%3e%3c/svg%3e)
How did genomic epidemiology become what it is?
Genomic epidemiology stems from molecular epidemiology, which uses evidence ranging from gel electrophoresis to multilocus sequence typing to study the origins and spread of pathogenic microorganisms. Janies et al Reference Janies1 reviewed the history of molecular epidemiology and compared it with syndromic epidemiology. Here, we focus on recent advances toward genomic epidemiology (Fig. 1), which includes genomic sequencing combined with rapid data sharing as enabled by the Internet. In 2002–2003, the severe acute respiratory syndrome coronavirus (SARS-CoV) was the first infectious disease for which scientists shared software and pathogen genetic data over the Internet to rapidly respond to the disease. Thereafter, genomic epidemiology was solidified by responses to H5N1, H1N1-2009, and other strains of influenza such as H7N9Reference Janies, Pomeroy and Aaronson 2 and expanded to respond to foodborne and sexually transmitted diseases. Reference Hoffmann, Luo and Monday3–Reference Allard, Strain and Melka5
Timeline of major events in sequencing technology (green) and genomic epidemiology (purple) alongside the first recorded occurrence of SARS-CoV, H1N1-2009, MERS-CoV, and SARS-CoV-2 in humans. Associated references can be found in Supplementary Table 1.
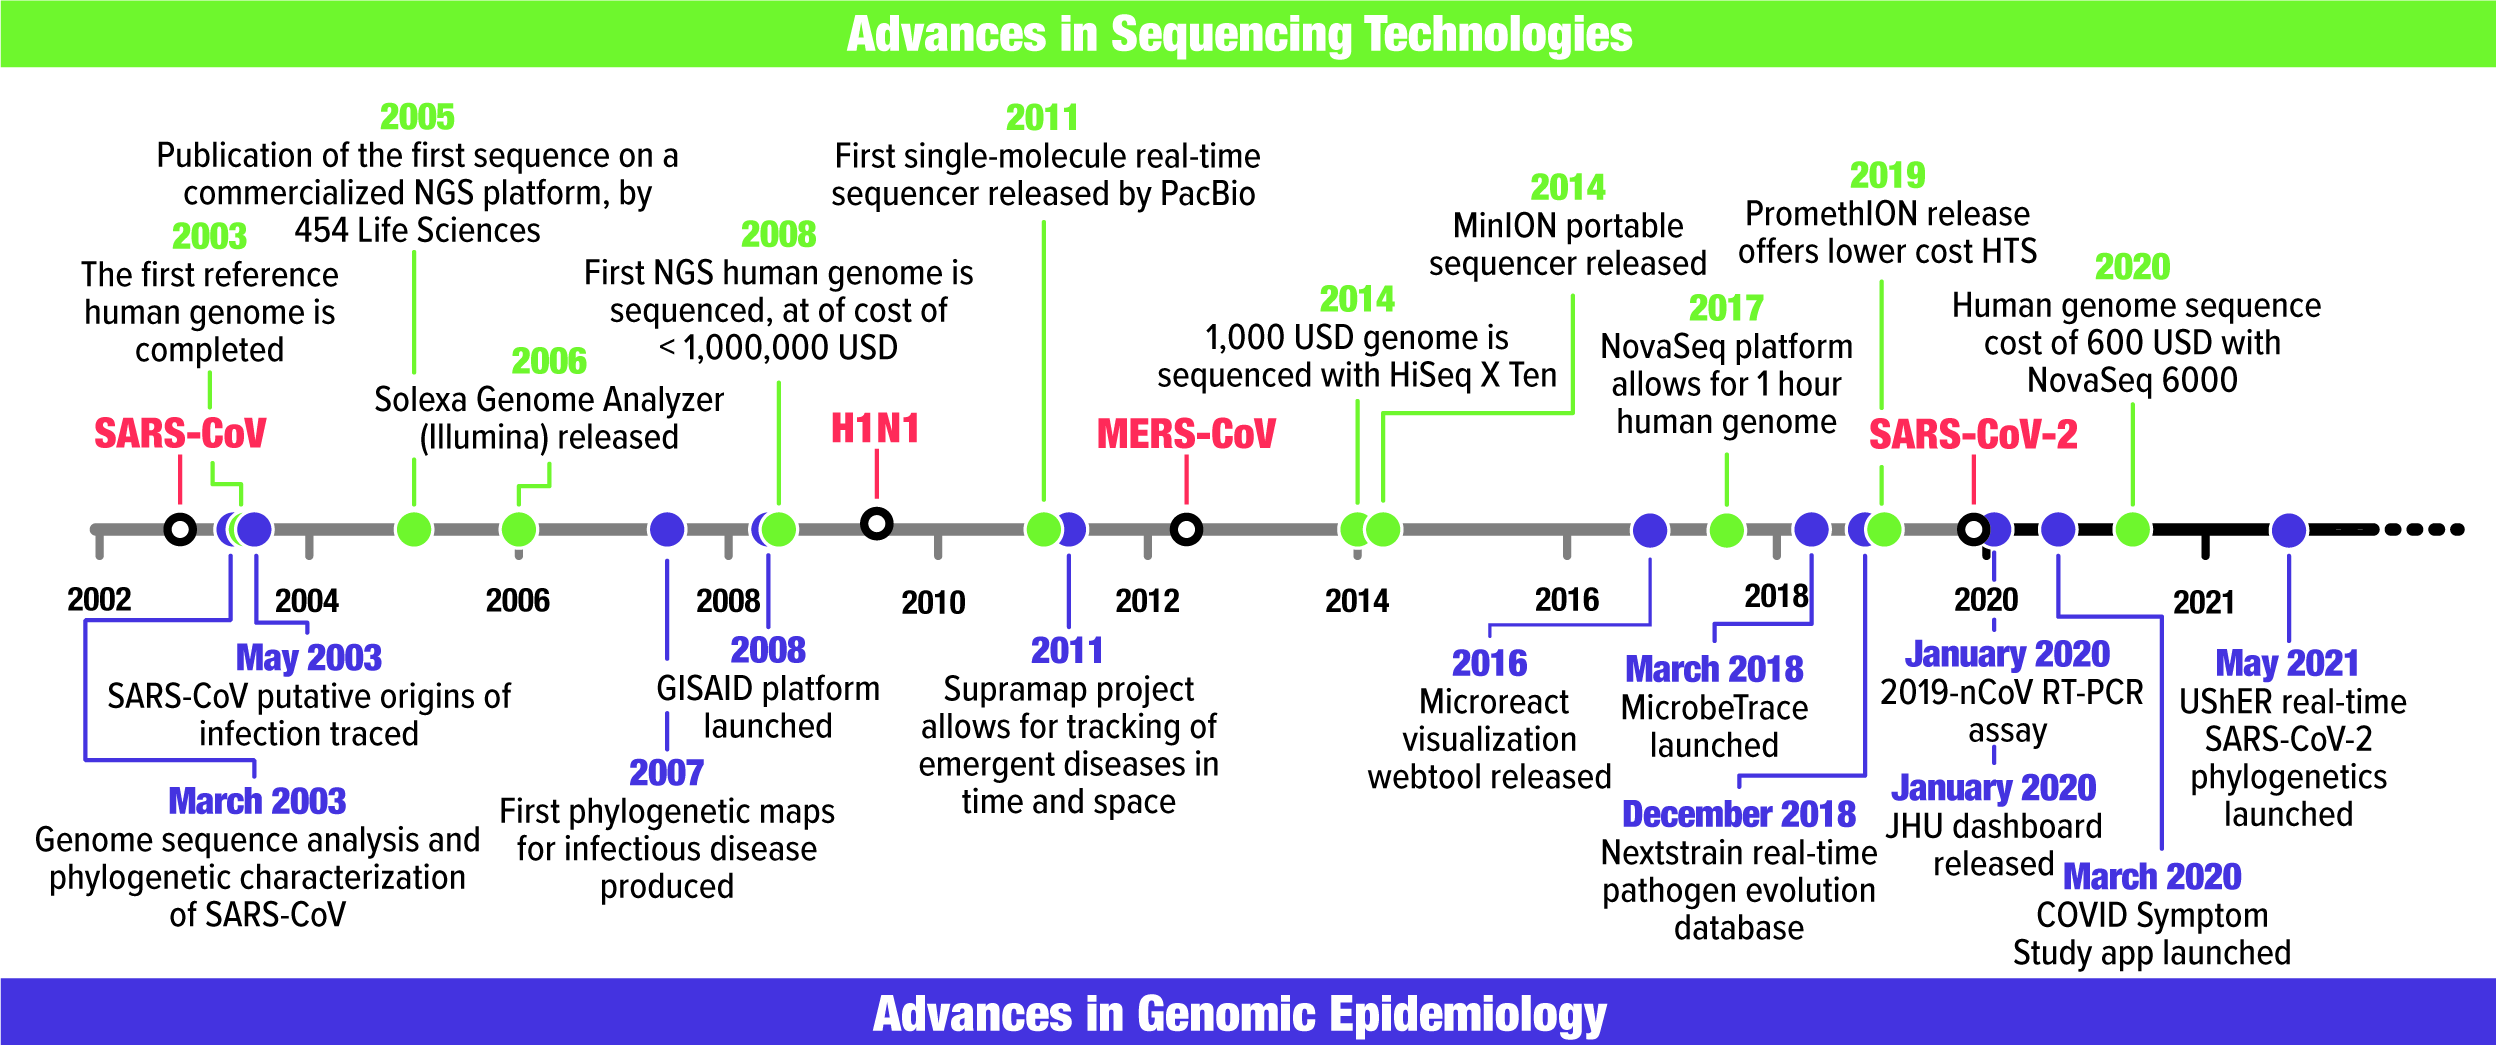
The first SARS-CoV genome was shared after publication Reference Marra, Jones and Astell6,Reference Rota, Oberste and Monroe7 on National Center for Biotechnology Information’s (NCBI) GenBank website, which was customary. Meanwhile, dashboards, graphs, and maps emerged to track cases over time and space. Reference Boulos8 Janies et al Reference Janies, Habib, Alexandrov, Hill and Pol9,Reference Janies, Hill, Guralnick, Habib, Waltari and Wheeler10 combined genomic and geographic data for SARS-CoV and H5N1 influenza, respectively, being the first to project phylogenies onto a virtual globe. Janies et al Reference Janies, Treseder and Alexandrov11 used Keyhole Markup Language (KML) to develop Supramap, which facilitates geographic mapping of phylogenies. Supramap allowed hypothesis testing ranging from the host and geographic origins of pathogens Reference Studer and Janies12 to tracing mutations that conferred drug resistance or host switching. Reference Janies, Voronkin and Studer13,Reference Hill, Guralnick, Wilson, Habib and Janies14 Limitations of computing large data sets, coupled with a preference for sharing data after publication, resulted in a greater turnaround between data acquisition and results than occurs today. However, these conditions did not impede a hypothesis-driven field with value to decision makers, as demonstrated in a 2007 congressional hearing. 15
In the 2000s, some genomes were sequenced for respiratory pathogens such as H1N1-2009. However, even SARS-CoV genomes were not always sequenced completely, and sequences were released gradually. Reference Janies, Habib, Alexandrov, Hill and Pol9 This changed due to factors such as new DNA sequencing technologies.
How did advances in sequencing technology reshape genomic epidemiology?
Current genomic epidemiology of infectious diseases originated in response to the SARS-CoV epidemic. Reference Janies, Voronkin, Das, Hardman, Treseder and Studer16 Sequencing the SARS-CoV genome was instrumental in recognizing it as a novel coronavirus associated with HCoV-OC43 and HCoV-229E. Reference Marra, Jones and Astell6,Reference Rota, Oberste and Monroe7 Researchers combined genomic and epidemiological data to trace the genotypic variation of the viral transmission paths between 2002 and 2003. Reference Ruan, Wei and Ee17,Reference Zhao18 However, today’s genomic surveillance evolved with the advance of high-throughput sequencing (HTS) (Fig. 1).
Reuter et al Reference Reuter, Spacek and Snyder19 summarized HTS history until 2015 and Pérez-Losada Reference Pérez-Losada, Arenas and Galán20 reviewed recent HTS advances. We focus on the sequence cost variation per raw megabase between 2001 and 2020 21 (Fig. 2a) to illustrate the increasing feasibility of sequencing coronavirus genomes (Fig. 2b). Considering raw nucleotide sequencing cost, US$100 was not sufficient to sequence one coronavirus genome in 2020, but $100 it would cover >400,000 genomes in 2020.
The increasing feasibility of sequencing complete coronavirus genomes. (a) Sequencing cost per raw megabase of DNA sequence from September 2001 until August 2020 (data source: genome.gov/sequencingcosts, access date: September 2021). (b) Number of complete coronavirus genomes that can be sequenced with USD 100, assuming a genome size of 32 Kbp. These cost estimates do not consider sampling, storage, consumables, equipment, and staff costs. These plots use a logarithmic scale.

What are coronaviruses?
Coronaviruses correspond to the four genera of the subfamily Orthocoronavirinae. Gammacoronavirus (GammaCoVs) and Deltacoronavirus (DeltaCoVs) mainly infect birds and rarely infect mammals. Reference Woo, Lau and Lam22,Reference Durães-Carvalho, Caserta and Barnabé23 Alphacoronavirus (AlphaCoVs) and Betacoronavirus (BetaCoVs) originated from Chiroptera (bats) and are often found in other mammals, including humans. Reference Woo, Lau and Lam24
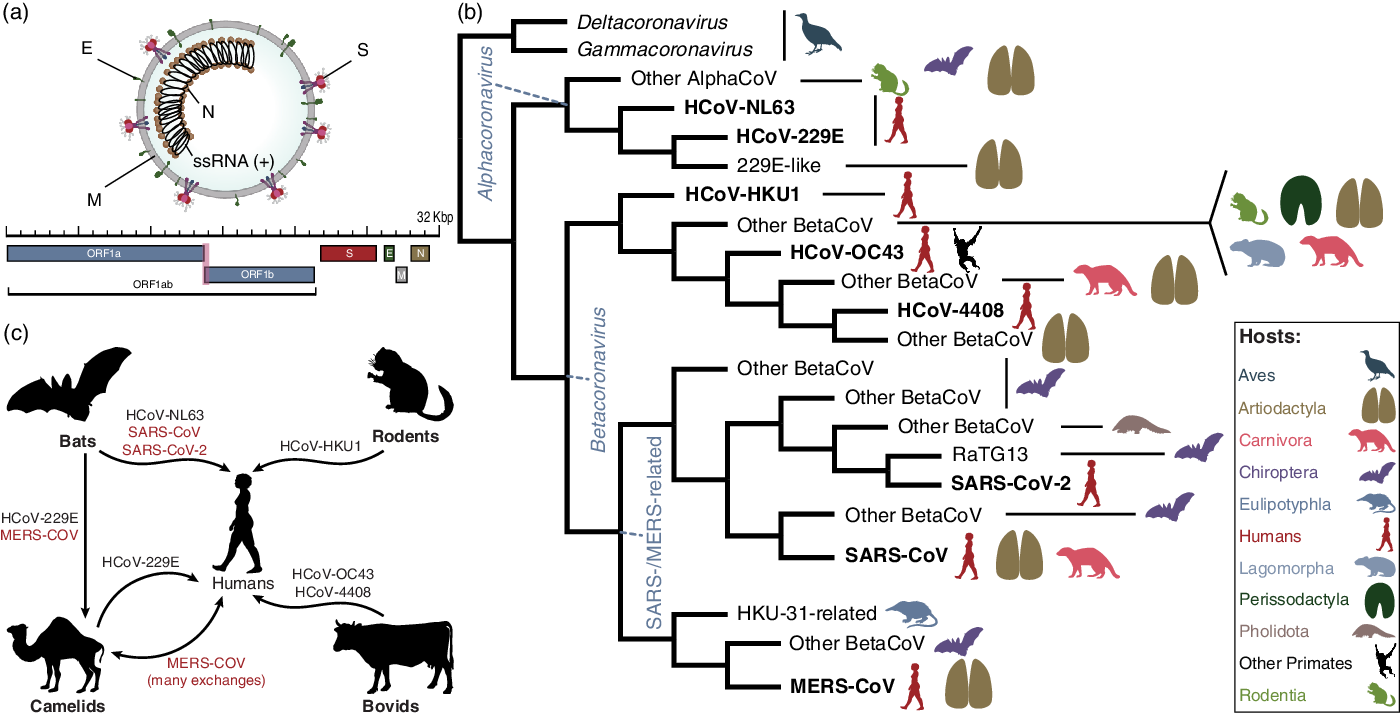
The coronavirus virion encapsulates one of the longest RNA virus genomes (27–32 kb), Reference Woo, Huang, Lau and Yuen25 which has complex gene expression Reference Irigoyen, Firth, Jones, Chung, Siddell and Brierley26 and variable gene content among genera (Fig. 3a). 27
Fundamental evolution of coronaviruses based on Machado et al.Reference Machado, Scott, Guirales and Janies 49 (a) Virion and genome structure. The genomic regions indicated in the figure do not represent all the genes in the coronavirus genome, but the genes that are shared among the different genera of Orthocoronavirinae and that were analyzed by Machado et al.Reference Machado, Scott, Guirales and Janies 49 Note. E, envelope small membrane protein; M, membrane protein; N, nucleoprotein; S, spike glycoprotein. (b) Summarized cladogram from Machado et al.Reference Machado, Scott, Guirales and Janies 49 The original cladogram contained 2,006 terminals corresponding to unique coronavirus genomes. Terminals indicating the eight species of human coronaviruses (HCoVs) are in bold. (c) Hosts involved in the emergence of all human coronaviruses, including SARS-CoV-2. The HCoVs of special concern to human health (SARS-CoV, MERS-CoV, and SARS-CoV-2) are shown in red. The flow chart indicates that HCoV-NL63, SARS-CoV, and SARS-CoV-2 originated from bat-hosted coronaviruses. Bats were also key to the emergence of MERS-CoV in camels and humans. HCoV-229E, HCoV-HKU1, and HCoV-OC43 originated from viruses hosted in artiodactyls, rodents, and bovids, respectively. All silhouettes were downloaded from PhyloPic (http://phylopic.org). The coronavirus vision structure was modified from https://commons.wikimedia.org/wiki/File:Coronavirus_virion_structure.svg. See Supplementary File 1 for detailed copyright and license information.
Coronavirus infections in domestic animals are economically significant. Reference Li, Ge and Li28–Reference Mandelik, Sarvas, Jackova, Salamunova, Novotny and Vilcek30 However, the episodic emergence of human coronaviruses (HCoVs) is a pressing concern because they cause infections in all age groups, often leading to respiratory or enteric diseases. Reference Su, Wong, Shi, Liu, Lai and Zhou31 Neurological illness or hepatitis is less frequent. Reference Lai and Cavanagh32 The US Centers for Disease Control (CDC) website 33 lists 7 HCoVs: 2 AlphaCoVs (HCoV-229E and HCoV-NL63) and 5 BetaCoVs (HCoV-OC43, HCoV-HKU1, SARS-CoV, MERS-CoV, and SARS-CoV-2). We added the human enteric coronavirus 4408 (HECV-4408) to the list because it was isolated from a child with acute gastroenteritis. Reference Zhang, Herbst, Kousoulas and Storz34
How did SARS-CoV-2 accelerate the growth of genomic epidemiology?
Coronaviruses were not deemed highly pathogenic to humans until the 2002 SARS-CoV outbreak. Reference Zhong, Zheng and Li35,Reference Ksiazek, Erdman and Goldsmith36 The dangers of HCoVs were made more evident by the 2012 outbreak of Middle East respiratory syndrome (MERS) coronavirus (MERS-CoV). Reference Zumla, Hui and Perlman37 Nevertheless, coronaviruses did not receive the current level of attention until the pandemic coronavirus disease 2019 (COVID-19), caused by SARS-CoV-2, was first reported in humans in Wuhan, China, in December 2019. 38 However, Pekar et al Reference Pekar, Worobey, Moshiri, Scheffler and Wertheim39 inferred that the virus was present in Hubei approximately a month before. On March 11, 2020, the World Health Organization (WHO) declared a pandemic due to the spread of SARS-CoV-2. 38 By October 14, 2021, COVID-19 had caused 4,863,818 deaths worldwide. 40
Understanding the emergence and evolution of SARS-CoV-2 is vital to preventing future pandemics. Reference Yuen, Ye, Fung, Chan and Jin41 The question can be divided into 3 components. First, was the virus purposefully manipulated? Several peer-reviewed publications have concluded that SARS-CoV-2 emerged naturally via zoonosis (see eg, Anderson et al, Reference Andersen, Rambaut, Lipkin, Holmes and Garry42 Liu et al Reference Liu, Saif, Weiss and Su43 , and Holmes et al Reference Holmes, Goldstein and Rasmussen44 ). Moreover, previous serology data indicate natural human infections by bat-hosted, SARS-like viruses. Reference Wang, Li and Yang45
Second, was SARS-CoV-2 an accidental release? If a naturally occurring virus was transported to a laboratory and humans were infected shortly thereafter, the virus may not have accumulated sufficient mutations to record its passage through controlled environments. Reference Zhang, Hasoksuz and Spiro46 However, no evidence indicates that SARS-CoV-2 was known to scientists before December 2019. Reference Rasmussen47,Reference Shi48
Third, what is the natural source of SARS-CoV-2? The most comprehensive phylogenomic analysis of coronavirus Reference Machado, Scott, Guirales and Janies49 (Fig. 3b) addressed the fundamental evolution of HCoVs (Fig. 3c) and showed that SARS-CoV-2 results from bat-hosted viruses infecting humans. Reference Zhao, Zhuang and Cao50 SARS-CoV-2 finds its closest related bat-hosted coronaviruses in the subgenus Sabercovirus, a subgroup of SARS-related coronaviruses (SARSr-CoV) first identified in horseshoe bats (Rhinophulus spp). Reference Li, Shi and Yu51 Bat-hosted viruses similar to SARS-CoV-2 were collected in the Yunnan province, >1,500 km away from Wuhan, but the hosts have a wide geographic range. Reference Wang, Li and Yang45,Reference Lytras, Hughes and Martin52,Reference Lytras, Xia, Hughes, Jiang and Robertson53
Despite a confusing array of reports confirming Reference Lam, Jia and Zhang54–Reference Zhang, Wu and Zhang56 and denying Reference Liu, Jiang and Wan57 the origin of SARS-CoV-2 from pangolin (Manis javanica) hosts, pangolins are not involved in the lineage of SARS-CoV-2 that infected humans. Reference Machado, Scott, Guirales and Janies49 This finding is similar to the emergence of SARS-CoV, Reference Janies, Habib, Alexandrov, Hill and Pol9 which also infected humans from bat-hosted viruses without any need for intermediate hosts, including Himalayan palm civets (Parguma larvata) and raccoon dogs (Nyctereutes procyonoides).
Are we sequencing SARS-CoV-2 genomes fast enough?
SARS-CoV-2 was identified on January 7, 2020. Three days later, its genome and metadata were shared via the Global Initiative on Sharing Avian Influenza Data (GISAID) 58 EpiCoV database, 59 before the first peer-reviewed article was published in February 2020. Reference Wu, Zhao and Yu60
To put the SARS-CoV-2 genome sequencing speed into context, consider that SARS-CoV was first reported in November 2002, but its genome was publicly released in April 2003. Reference Marra, Jones and Astell6 The speed at which such data are released was changed by several forces, illustrated by Janies et al. Reference Janies, Voronkin, Das, Hardman, Treseder and Studer16 In brief, the reasons include the increased feasibility of genome sequencing, the willingness to share data before publication, and the rise of the popular GISAID database, which credits submitting laboratories.
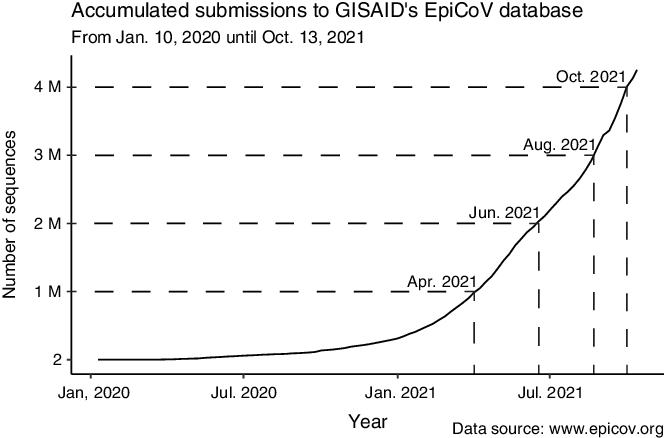
Figure 4 shows the accumulation of 4,224,785 complete SARS-CoV-2 genomes in EpiCoV between January 10, 2020, and October 13, 2021. The curve is far from reaching a plateau, indicating that we are not producing coronavirus genomes at total capacity. Efforts to sequence SARS-CoV-2 following international guidelines 61,62 are welcome because these data inform epidemiological forecasts (eg, increased transmission efficiency of SARS-CoV-2 variants has led to projections of the rise of higher numbers of cases Reference Truelove, Smith and Qin63 ).
Progressive accumulation of 4,224,785 complete SARS-COV-2 genome sequences (>26 Kbp) submitted to the GISAID EpiCoV database (https://www.epicov.org/) between January 10, 2020, and October 13, 2021. These cost estimates do not consider sampling, storage, consumables, equipment, and staff costs (see eg, Schwarze et alReference Schwarze, Buchanan and Fermont 168 ). Nevertheless, the price of raw nucleotide sequencing is a significant component of the cost of genome projects.
Genomic sequencing generates a snapshot of a viral lineage in a place and time. When sequences are collected longitudinally, applications in genomic epidemiology and pandemic responses emerge, which we illustrate with 4 examples. First, profiling mutation fingerprints from the viral pangenome to individual infection quasi-species enables molecular contact tracing. Reference Lau, Pavlichin and Hooker64 Second, genomic sequencing informs the peptide mass fingerprinting (PMF) used to predict novel structures and find inhibitors for viral peptides, Reference Hamza, Ali and Khan65 although results must be tested in randomized controlled trials Reference Hariton and Locascio66 to identify effective antivirals. Reference Boulware, Pullen and Bangdiwala67,Reference Siemieniuk, Bartoszko and Ge68 Third, the data are used to model epidemic or pandemic size and severity. Reference Truelove, Smith and Qin63 Fourth, viral sequences are fundamental for developing mRNA vaccines. 69 For a review on current pitfalls and opportunities in applying HTS to SARS-CoV-2 genomes, see Chiara et al. Reference Chiara, D’Erchia and Gissi70
As SARS-CoV-2 becomes endemic, Reference Shaman and Galanti71,Reference Nakanishi and Yoshio72 sequencing demand will remain high. SARS-CoV-2 infections are decreasing as more people develop immunity through natural infection or vaccination. Reference Phillips73 However, variants may evade infection and vaccine-induced antibodies, Reference Zhou, Dejnirattisai and Supasa74 especially with infections occurring months after vaccination (ie, breakthrough infections). Reference Kustin, Harel and Finkel75,Reference Farinholt, Doddapaneni and Qin76 Given breakthrough infections, increased transmission of some variants, and the lack of full vaccination among eligible people, we can predict that SARS-CoV-2 will continue to evolve. Whether SARS-CoV-2 is evolving toward more severe or more benign COVID-19 phenotypes is a pressing research question for genomic epidemiology.
Effective countermeasures depend on understanding SARS-CoV-2 lineages, such as sampling variants for which phenotype is not fully understood Reference Giovanetti, Benedetti and Campisi77 and addressing sampling bias. Reference To, Sridhar and Chiu78 For example, if we restrict sequencing viral isolates from hospitalized patients, the relationships between any variables associated with hospitalization will be distorted when compared to the general population. Thus, we would miss mutations associated with asymptomatic and symptomatic cases that did not require hospitalization, which could lead to inducing or misinterpreting the evidence for phenotype-genotype associations. Reference Munafò, Tilling, Taylor, Evans and Davey Smith79–Reference Tattan-Birch, Marsden, West and Gage81
Brito et al Reference Brito, Semenova and Dudas82 analyzed the spatiotemporal heterogeneity in each country’s SARS-CoV-2 genomic surveillance efforts based on metadata submitted to GISAID until May 30, 2021. These researchers estimated that when the prevalence of a rare lineage is 2%, 300 cases would need to be sequenced to detect at least 1 genome of that lineage with 95% probability. Therefore, sequencing capacity should be at least 0.5% of cases per week when incidence is >100 positive cases per 100,000 people.
Brito et al Reference Brito, Semenova and Dudas82 observed that countries like Denmark, which have a quick turnaround for sequencing, processing, and sharing SARS-CoV-2 genomic data (<18 days) and a high sequencing rate (>32%), observe greater lineage diversity. Many variants may be missed when sampling rates are low. However, disparities in wealth, investment in research and training, coordination, and supply chain logistics affect the ability of countries to perform genomic surveillance, especially LMICs. Therefore, efforts must be made to provide funds, training, and logistic support for researchers based in LMICs to improve their genomic surveillance capacity and public-health decision making.
How do we classify the variants of SARS-CoV-2?
Any genome sequence that is genetically distinct from the reference can be called a variant. In practice, the SARS-CoV-2 variants represent clades that share a set of key mutations while still permitting a small amount of other sequence variation. Reference Lauring and Hodcroft83,Reference Tegally, Wilkinson and Giovanetti84 Moreover, convergent evolution among geographically distant variants has been observed (Table 1). Reference Ford, Scott, Machado and Janies85 Although variants and strains are different, some researchers use these terms interchangeably (eg, Awadasseid et al, Reference Awadasseid, Wu, Tanaka and Zhang86 Hossein et al, Reference Hossain, Hassanzadeganroudsari and Apostolopoulos87 and Ul-Rahman et al Reference Ul-Rahman, Shabbir and Aziz88 ). The term “strain” is typically associated with lineages that became sufficiently divergent to exhibit a changed phenotype. Reference Kuhn, Bao and Bavari89
Notable Variants of SARS-CoV-2 and Their Main Attributes a
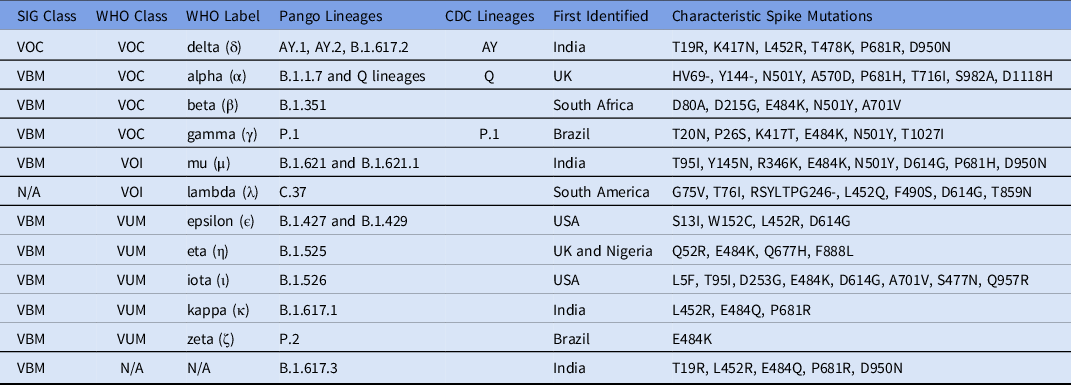
Note. SIG, US government SARS-CoV-2 Interagency Group; VBM, variant being monitored; VOC, variant of concern; VOI, variant of interest; VUM, variants under monitoring; EUA, emergency use authorization.
a This table was modified and updated from the WHO website, 93 the CDC website, 94 Rambaut et al,Reference Rambaut, Holmes and O’Toole 97 and Soh et al. Reference Soh, Kim, Kim, Jang and Lee167 SIG and WHO classifications are detailed in Table 2.
In late 2020 and throughout 2021, as vaccine availability increased, information on variants began to dominate the COVID-19 response. Reference Parums90–Reference Janik, Niemcewicz, Podogrocki, Majsterek and Bijak92 The emergence of variants that might pose an increased risk to global public health prompted the WHO to characterize specific variants of interest (VOIs) and variants of concern (VOCs) to prioritize global monitoring and research. 93 The US government SARS-CoV-2 interagency group (SIG) developed a separate variant classification scheme, 94 which we compare to the WHO system in Table 2.
Comparing the Different Categories in the WHO Variant Classification System 93 With the System Used by the US government SARS-CoV-2 Interagency Group (SIG) 94 , a

Note. VBM, variant being monitored; VOC, variant of concern; VOI, variant of interest; VUM, variants under monitoring; VOHC, variant of high consequence; EUA, emergency use authorization.
a Currently, no variants are being classified as VOI or VOHC by the CDC and SIG.
In March 2021, the WHO assigned letters of the Greek alphabet to categorize VOIs and VOCs, 93 for simplicity and to avoid association with particular localities. These labels do not replace existing classifications by GISAID (https://gisaid.org/), Reference Shu and McCauley95 Nextstrain (https://nexstrain.org/), Reference Hadfield, Megill and Bell96 and Pango lineages (https://cov-lineages.org/). Reference Rambaut, Holmes and O’Toole97 SARS-CoV-2 variants were reviewed by Harvey et al. Reference Harvey, Carabelli and Jackson98
Why are vaccines still not enough against COVID-19?
The speed of development and testing of COVID-19 vaccines development is one of history’s most outstanding public health achievements. Vast vaccination of eligible individuals is the best and safest way to control the pandemic. Reference Flanagan, MacIntyre, McIntyre and Nelson99 Although some SARS-CoV-2 variants show a degree of escape from protective antibodies induced by natural infection (and, to a lesser degree, after immunization), T-cell responses are retained. Reference Cevik, Grubaugh, Iwasaki and Openshaw100 Furthermore, first-generation SARS-CoV-2 mRNA-based vaccines induce public antibodies (ie, antibodies with similar genetic elements and modes of recognition against a different antigen observed in multiple individuals) with robust neutralizing and potentially durable protective activity against variants such as alpha (α), beta (β), and gamma (γ). Reference Schmitz, Turner and Liu101
SARS-CoV-2 variants will continue to emerge, Reference Boehm, Kronig and Neher102 requiring close international monitoring to determine the need for vaccination boosters and or redesign. Reference Boehm, Kronig and Neher102 As variants emerge in areas of low vaccination, a global COVID-19 vaccination rollout is imperative. Since the vaccine rollout, new questions have arisen regarding vaccine efficacy against the transmission of different variants, Reference Cevik, Grubaugh, Iwasaki and Openshaw100 the duration of protection, Reference Farooqi, Malik and Mulla103 and the efficacy of prime-boost schedules. Reference Flanagan, MacIntyre, McIntyre and Nelson99,Reference Krause and Gruber104–Reference Chen, Zhu and Huang106 A demand has also arisen for studies to determine the immunological correlates of protection against COVID-19 as cases decline and prevention of severe disease gains more importance in vaccine efficacy. Reference Hodgson, Mansatta, Mallett, Harris, Emary and Pollard107 Meanwhile, nonpharmaceutical interventions to reduce the spread of SARS-CoV-2 and other pathogens are still warranted. Reference Boehm, Kronig and Neher102,Reference Zhao, Hu, Ayaz Ahmed, Cheng, Chen and Sun108,Reference Lanzavecchia, Beyer and Evina Bolo109
How can we bridge the knowledge gap between disease origin and transmission?
Genomic epidemiology can be a tool to study emerging infectious diseases (EIDs) in humans, but its effectiveness is maximized when it accounts for animal and environmental components. In the case of zoonosis, there is a knowledge gap between the animal and human components of EID research, and One Health can bridge this gap.
Although most human health researchers have only started focusing on coronaviruses since the emergence of SARS-CoV-2, veterinarians, virologists, and zoologists have been researching animal coronaviruses long before the COVID-19 epidemic. Reference Poudel, Subedi, Pantha and Dhakal110 One Health proposes placing these realms of research (on humans and animals) in the same environmental context. The next steps in pandemic prevention science are to understand factors that create opportunities for zoonosis, Reference Semenza and Menne111,Reference Bartlow, Manore and Xu112 such as entering infectious habitats such as bat caves and the use of wildlife as food and medicine. Reference Mersha and One Health113–Reference Kelly, Karesh and Johnson117
Deep sequencing the microbiomes and viromes of taxonomically, geographically, and temporally deep biorepository archives of putative host animals will serve as the basis of new approaches to zoonosis, risk assessment, and threat mitigation. Reference Colella, Stephens, Campbell, Kohli, Parsons and Mclean118–Reference Thompson, Phelps and Allard120 Therefore, another step toward furthering the One Health approach is leveraging biorepositories in biomedical research. Although the Global Museum initiative already offers a route of international integration among museum biorepositories in a decentralized and geographically dispersed network, Reference Bakker, Antonelli and Clarke121 the link to EID research is still not fully realized.
The recent creation of the Museums and Emerging Pathogens in the Americas network (MEPA) is vital for linking biorepositories and EID research. Reference Colella, Bates and Burneo122 The overarching goal of the MEPA is to leverage museum biorepositories in a global, decentralized pathogen surveillance system by expanding biodiversity infrastructure and opening communication channels that foster collaboration among biorepositories and biomedical communities.
The need for this host-based approach to genomic epidemiology is made evident by the transmissible nature of SARS-CoV-2, Reference Conceicao, Thakur and Human123 which has the potential to infect a range of hosts, including tigers, Reference Wang, Mitchell and Calle124–Reference Bartlett, Diel and Wang126 minks, Reference Oreshkova, Molenaar and Vreman127,Reference Hammer, Quaade and Rasmussen128 domestic cats, Reference Halfmann, Hatta and Chiba129–Reference Braun, Moreno and Halfmann131 ferrets, Reference Liu, Yeh and Phan132–Reference Kim, Kim and Kim134 raccoon dogs, Reference Freuling, Breithaupt and Müller135 cynomolgus and rhesus macaques, Reference Freuling, Breithaupt and Müller135–Reference Rockx, Kuiken and Herfst137 rabbits, Reference Mykytyn, Lamers and Okba138 Egyptian fruit bats, Reference Mykytyn, Lamers and Okba138,Reference Schlottau, Rissmann and Graaf139 Syrian hamsters, Reference Imai, Iwatsuki-Horimoto and Hatta140 and white-tailed deer. Reference Palmer, Martins and Falkenberg141–Reference Gryseels, De Bruyn, Gyselings, Calvignac-Spencer, Leendertz and Leirs143
How can we track SARS-CoV-2 variants faster?
Vaccines are still effective in preventing severe outcomes against all SARS-CoV-2 variants, Reference Cevik, Grubaugh, Iwasaki and Openshaw100 which are ravaging unvaccinated people. Reference Griffin, Haddix and Danza144,Reference Del Rio, Malani and Omer145 However, the likelihood of new mutations increases as cases rise, possibly leading to enhanced transmission, immune escape, or increased pathogenicity. This process has resulted in more transmissible variants. Reference Lazarevic, Pravica, Miljanovic and Cupic146,Reference Kemp, Collier and Datir147
Researchers face 2 main challenges in keeping pace with SARS-CoV-2 variants: using resources at optimal capacity and lowering barriers to technology and training in genomic epidemiology across the world. On the one hand, countries with a high positivity rate, like India, are not sequencing isolates at full capacity. Reference Srivastava, Banu, Singh, Sowpati and Mishra148 The United States is an even more extreme example because it has ranked low in SARS-CoV-2 sequencing despite its capacity and expertise. Reference Furuse149,Reference Crawford and Williams150 On the other hand, countries like South Africa have sequencing laboratories struggling with reagent shortages and the scarcity of trained scientists. Reference Adepoju151
Global efforts to strengthen pathogen sequencing capacity are still required to respond to technical, logistical, and financial challenges in resource-limited settings despite increased sequencing feasibility. Moreover, good SARS-CoV-2 sequencing performance for some LMICs (eg, Democratic Republic of the Congo, Brazil, Senegal, and Thailand) further encourages international and domestic collaboration among public health authorities, healthcare facilities, academia, and industries. Reference Furuse149
Additional challenges include consistent handling of isolates as well as metadata and sequence data curation and deposition in a way that facilitates combining data sets from different laboratories. These challenges require coordinated efforts Reference Blomberg and Lauer152 and data standards Reference Conesa and Beck153 to guarantee rapid access to large volumes of raw and processed molecular data at unprecedented scales. Reference Chiara, D’Erchia and Gissi70
We also need to address bioinformatics bottlenecks to respond faster to the threat of emergent diseases and to manage the fast-paced production of genomic information. Most tools are co-opted from evolutionary biology’s arsenal to study the lineages of higher taxa with exemplar approaches. Reference Hodcroft, De Maio and Lanfear154 Although these tools were not designed to manage big data from rapidly evolving pathogens, Reference Hodcroft, De Maio and Lanfear154 some have already started to respond to these demands. For example, the ultrafast sample placement on existing trees (UShER) enables the rapid placement of novel genomes into a reference tree using the parsimony optimality criterion. Reference Turakhia, Thornlow and Hinrichs155 Thus, as phylogenetic principles underpin how we view genetic changes over time, One Health will also include the exchange of knowledge among evolutionary biologists and epidemiologists.
Phylogenetic trees are hard to compute and interpret. The need to consult professional phylogeneticists is made plain by the number of prominent papers that did not adhere to the standards of phylogenetics and failed to identify the fundamental hosts of coronaviruses. Reference Wenzel156 Moreover, a good phylogenetic analysis requires many elements: careful choice of the collected taxa, sequence, and or phenotypic data; method and quality control of sequence data and alignment; evaluation of substitution and indel models; treatment of partitions; tree-search protocol; measures of fit or confidence; and strategies for character coding and optimization. Reference Machado, Scott, Guirales and Janies49,Reference Wenzel156,Reference Machado, Schneider, Guirales and Janies157 Moreover, results may vary with parameterization. Reference Wheeler158 These are only a few of the difficult decisions that go way beyond the level of sophistication of any software manuals and automated systems. Reference Wenzel156,Reference Grant159
Are trees mapped to globes always needed?
In many cases, such as the initial spread of H5N1 influenza, trees and Supramaps were very useful to understand the geographic spread of the pathogen, its multiple geographically and mutationally distinct patterns of zoonosis, Reference Janies, Hill, Guralnick, Habib, Waltari and Wheeler10 and drug resistance. Reference Hill, Guralnick, Wilson, Habib and Janies14 However, due to occlusion, Supramaps were not suitable for the visualization of cosmopolitan diseases, such as strains of Salmonella (eg, Hoffman et al Reference Hoffmann, Luo and Monday3 ), seasonal influenza (eg, H3N2), pandemic influenza (H1N1-2009), Reference Janies, Voronkin, Das, Hardman, Treseder and Studer16 and SARS-CoV-2. In response, researchers have worked on alternative visualization tools, including pointmaps and route maps Reference Janies, Voronkin and Studer13,Reference Hovmöller, Alexandrov, Hardman and Janies160 and eventually moved beyond the need for mapping trees to globes with Strainhub. Reference de Bernardi Schneider and Ford161
Unlike Supramap, Strainhub is less computationally demanding. It can be executed from a web browser; it does not depend on closed source software (Google Earth), and geographical data are optional (Fig. 5). Moreover, Strainhub can be used to test hypotheses on the relative importance of hosts or places in disease spread. Future efforts for Strainhub will focus on usability, interoperability, visual clarity, and quantification of the relative importance of hosts or places in the spread of disease to better understand zoonosis.
Comparison between Supramap and Strainhub visualizations. (a) Supramap phylogenetic visualization of bat-hosted and pangolin-hosted coronaviruses that share recent ancestry (2005–2019) with human-hosted SARS-CoV-2. The underlying data are genomic sequences, temporal and geographic metadata. (b) Strainhub visualization of the same data plus host metadata in a network using arbitrary space. Arrow colors correspond to different types of transmission (red = bat to human, green = bat to bat, yellow = bat to pangolin). The size of the circle represents the source hub ratio (SHR). SHR is the number of transitions originating from a node as a fraction of the total number of transitions related to that node. A node scoring SHR close to 1 indicates a source (eg, Hubei, Yunnan, and Zhejiang), SHR close to 0.5 a hub and SHR close to 0 a sink for the pathogen. The thickness of the line represents a higher frequency of viral transmission (eg, Hubei to Zhejiang).

How do we prepare for the next pandemic?
The COVID-19 pandemic has illustrated how unprepared our interconnected global society is for zoonotic disease. For the next pandemic, 2 frontiers of investigation are interesting for genomic epidemiology as a tool to survey microbes of pandemic potential to predict, prevent, or respond faster to the emergence of new disease.
First, we must survey the natural diversity of coronaviruses and other microbes of pandemic potential present within animals. Reference Thompson, Phelps and Allard120 Second, we must develop the science of pandemic prevention by moving from tracking pandemics that are occurring to predicting outbreaks. For example, combining artificial intelligence with genomic epidemiology can lead constructing a “viral forecast“ to inform decisions about viruses with pandemic potential. Reference Syrowatka, Kuznetsova and Alsubai162 Moreover, we have proposed a novel mathematical modeling framework based on agent-based modeling to predict pathogen patch dynamics underlying zoonosis. Reference Chen, Owolabi and Li163
Final remarks
The COVID-19 pandemic, while ongoing, has caused 4,863,818 deaths worldwide as of October 14, 2021, 164 and it has surpassed the US death toll from the 1918–1919 H1N1 pandemic, which was ∼675,000. As SARS-CoV-2 becomes endemic, we must remember that it is not as lethal as other pathogens such as H5N1 influenza or Nipah virus. In its last 100 years of existence, smallpox killed 300 million people, and Variola major (the major variant of smallpox) killed 30% of these patients. Reference Henderson165
A novel pathogen at 30% mortality infecting 50% of the US population (166.7 million) would have resulted in 50 million deaths. MERS-CoV, henipaviruses, and hantavirus all have high mortality (>30%) and virulence with no approved vaccines or antivirals available. The 2018 Nipah outbreak had a 91% case-fatality rate, claiming 21 lives. Reference Arunkumar, Chandni and Mourya166 We must heed the warning that pathogens with more severe disease phenotypes than SARS-CoV-2 could resultin a far more devastating pandemic.
Supplementary material
To view supplementary material for this article, please visit https://doi.org/10.1017/ash.2021.222
Acknowledgments
We acknowledge the support of the following units of the University of North Carolina at Charlotte: the College of Computing and Informatics, the Bioinformatics Research Center, the Ribarsky Center for Visual Analytics, the Department of Bioinformatics and Genomics, Research and Economic Development, Academic Affairs, and University Research Computing. We further acknowledge the support of the North Carolina Research Campus and of the Belk Family. R.A. White III is supported by a UNC Charlotte start-up package. D.J.M. thanks Thiago José Jacob Carnevalli for his example and inspiration.
Financial support
No financial support was provided relevant to this article.
Conflict of interest
All authors report no conflicts of interest relevant to this article.


 Open access


