


Introduction
Top predators are key regulators of the food web, since their dynamics produce cascading influences that affect herbivores directly and plants indirectly and that propagate to other species such as mesocarnivores through intraguild competition (Terborgh et al. Reference Terborgh, Holt and Estes2010; Ripple et al. Reference Ripple, Estes, Beschta, Wilmers, Ritchie, Hebblewhite, Berger, Elmhagen, Letnic, Nelson, Schmitz, Smith, Wallach and Wirsing2014). In certain ecosystems, carnivorans, particularly large carnivorans, may even enhance carbon storage by limiting the number of herbivore prey and thereby allowing more plants to thrive (Ripple et al. Reference Ripple, Estes, Beschta, Wilmers, Ritchie, Hebblewhite, Berger, Elmhagen, Letnic, Nelson, Schmitz, Smith, Wallach and Wirsing2014). As fundamental ecological processes, these interactions and their effects also pertain to ancient ecosystems; extinct carnivores must have played a crucial role in shaping past ecosystems. Nevertheless, our knowledge about the ecology of extinct carnivorans and past trophic interactions is limited, mainly as a consequence of the rarity of carnivore remains in the fossil record.
Fossil sites dominated by carnivoran remains are rare because mammalian fossil assemblages typically reflect the herbivore:carnivore proportion of extant communities, usually greater than 50:1 (Farlow Reference Farlow1993). Fossil sites rich in carnivoran remains form under exceptional taphonomic circumstances (Spencer et al. Reference Spencer, Van Valkenburgh and Harris2003; Domingo et al. Reference Domingo, Alberdi, Azanza, Silva and Morales2013a) and represent unique opportunities to study ecological aspects of past carnivoran guilds, from taxonomic diversity to ecomorphological traits to trophic interactions.
Stable isotope analysis of dental enamel is a robust method to infer the diet and resource use of extinct mammals, as well as the habitat(s) where they lived. This method requires sampling of tooth enamel, so the technique is not always permitted when fossil remains are rare or delicate. In fossil sites too old for preservation of collagen or apatite biosignal in bone, we are limited to working with the apatite biosignal of dental enamel. An added challenge comes from the thin enamel of most predators’ teeth and the small amount of sample that can be recovered from them. Fortunately, advances in mass spectrometry have led to a substantial decrease in the amount of sample required for analysis, so the damage caused to teeth during sampling is now much reduced. Consequently, the number of studies of the feeding behavior of extinct predators through stable isotope analyses of fossil enamel is increasing, although most are restricted to Quaternary sites (e.g., Feranec Reference Feranec2004; Kohn et al. Reference Kohn, McKay and Knight2005; Lee-Thorp et al. Reference Lee-Thorp, Sponheimer and Luyt2007; Clementz et al. Reference Clementz, Fox-Dobbs, Wheatley, Koch and Doak2009; García García et al. Reference García García, Feranec, Arsuaga, Bermúdez de Castro and Carbonell2009; Feranec et al. Reference Feranec, García, Díez and Arsuaga2010; Kohn and McKay Reference Kohn and McKay2012; Domingo et al. Reference Domingo, Domingo, Badgley, Sanisidro and Morales2013b; Feranec and DeSantis Reference Feranec and DeSantis2014).
The Cerro de los Batallones fossil complex (Madrid Basin, central Spain; Fig. 1) is known for abundant, well-preserved remains of diverse vertebrates, mainly mammals, of Vallesian age (late Miocene, MN10, ca. 10–9 Ma; Domingo et al. Reference Domingo, Alberdi and Azanza2007; Gómez Cano et al. Reference Gómez Cano, Hernández Fernández and Álvarez-Sierra2011; Fig. 2). Cerro de los Batallones stands out for two of its sites (Batallones-1 and Batallones-3), in which the number of carnivoran remains greatly exceeds the number of herbivore remains. In these sites, more than 97% of the large-mammal remains belong to carnivoran species (Table 1), resulting in an inverted herbivore:carnivore ratio compared with those of living populations and most continental fossil assemblages. This abundance of carnivore specimens is the result of the taphonomic history of the sites: late Miocene pseudokarstic cavities present in this area acted as natural traps (Pozo et al. Reference Pozo, Calvo, Silva, Morales, Peláez-Campomanes and Nieto2004; Morales et al. Reference Morales, Pozo, Silva, Domingo, López-Antoñanzas, Sierra, Antón, Escorza, Quiralte, Salesa, Sánchez, Azanza, Calvo, Carrasco, García-Paredes, Knoll, Fernández, Ostende, Merino, van der Meulen, Montoya, Peigné, Peláez-Campomanes, Sánchez-Marco, Turner, Abella, Alcalde, Andrés, DeMiguel, Cantalapiedra, Fraile, Yelo, Cano, Guerrero, Pérez and Siliceo2008; Calvo et al. Reference Calvo, Pozo, Silva and Morales2013). Carnivoran individuals actively entered these cavities in their search for prey and water but were unable to leave (Domingo et al. Reference Domingo, Alberdi, Azanza, Silva and Morales2013a).
Location of Cerro de los Batallones fossil sites. A, Geological map of the Madrid Basin with Cerro de los Batallones (modified from Calvo et al. Reference Calvo, Alonso Zarza and García del Cura1989). The location of the Madrid Basin in Spain is indicated in the upper left inset. B, Map of Cerro de los Batallones showing the location of the fossil sites (modified from Pozo et al. Reference Pozo, Calvo, Silva, Morales, Peláez-Campomanes and Nieto2004). BAT-1, Batallones-1; BAT-2, Batallones-2; BAT-3, Batallones-3; and so on.

Carnivoran fossil specimens from Batallones-3. A, Right hemimandible BAT-3'13 1596 of Promegantereon ogygia. The p4 was sampled in this study. B, Machairodus aphanistus skull BAT-3'12 2448. Maximum length of the skull is 33 cm. C, Left hemimandible BAT-3'10 666 of Indarctos arctoides. The m1 was sampled in this study. D, Partial skeleton of Eomellivora piveteaui. Skull and mandible BAT-3'09 1000 are to the left. Scale, 5 cm. The P4 and p4 were sampled in this study.

Abundances and proportions of large mammals from Batallones-1 and Batallones-3. In this table, we do not account for undetermined remains. Taxa analyzed in this study are marked with an asterisk. NISP, number of identified specimens.

1 It refers to BAT-1 lower-level assemblage, which is the carnivoran-dominated assemblage (see Domingo et al. Reference Domingo, Alberdi, Azanza, Silva and Morales2013a for further information)
2 In BAT-1, Amphicyonidae is exclusively represented by Magericyon anceps. In BAT-3, Amphicyonidae is represented by Magericyon anceps and Thaumastocyon sp.
3 Several species are included within Felinae and Mustelidae/Mephitidae, but except for the feline Styriofelis vallesiensis (which is present both in BAT-1 and BAT-3; Salesa et al. Reference Salesa, Antón, Morales and Peigné2012), the rest of the species are under study.
4 Hipparionine horses from Cerro de los Batallones are under study but more than one species is included in Hipparion spp.
Both, Batallones-1 (BAT-1) and Batallones-3 (BAT-3) are Vallesian (ca. 10–9 Ma), but López-Antoñanzas et al. (Reference López-Antoñanzas, Peláez-Campomanes, Álvarez-Sierra and García-Paredes2010) suggested that BAT-3 is slightly younger than BAT-1, based on the more derived dental characters of the cricetid Hispanomys moralesi at BAT-3 compared with BAT-1. Based on the small-mammal association, López-Antoñanzas et al. (Reference López-Antoñanzas, Peláez-Campomanes, Álvarez-Sierra and García-Paredes2010) concluded that Cerro de los Batallones localities were probably correlated to local subzone J2 (dated at 9.71–9.48 Ma) or J3 (9.34–9.05 Ma) of the Teruel Basin (van Dam et al. Reference van Dam, Alcalá, Alonso Zarza, Calvo, Garcés and Krijgsman2001, Reference van Dam, Abdul Aziz, Álvarez Sierra, Hilgen, van den Hoek Ostende, Lourens, Mein, van der Meulen and Peláez-Campomanes2006). On this basis, we suggest an age difference among Cerro de los Batallones sites on the order of 0.30 Myr. The Cerro de los Batallones research team is currently refining the chronology of the fossil sites through new analyses on the small-mammal assemblages and magnetostratigraphic surveys. Differences in taxonomic composition and proportional abundance of carnivore remains between BAT-1 and BAT-3 (Table 1) have been attributed to this temporal difference, but an associated environmental difference remains unclear.
In a previous study, we reported on stable isotopes of carbon for three sympatric hypercarnivores from BAT-1: the sabertoothed cats Promegantereon ogygia and Machairodus aphanistus and the amphicyonid Magericyon anceps (Domingo et al. Reference Domingo, Domingo, Badgley, Sanisidro and Morales2013b). Here, we expand the isotopic sampling to BAT-3 carnivorans (including Promegantereon ogygia, Machairodus aphanistus, and Magericyon anceps, and the ursid Indarctos arctoides, the mustelid Eomellivora piveteaui, and the amphicyonid Thaumastocyon sp.) to assess the feeding ecology of BAT-1 and BAT-3 carnivore populations and the environmental (vegetation) context of these sites.
Background
The Fossil Localities
In 1991, BAT-1 was the first fossil site discovered in Cerro de los Batallones. It was found in the context of mining operations conducted in this area to extract sepiolite, a clay mineral. BAT-3 was discovered in 2000, when fossils became exposed on the surface as the result of slope erosion on the hillside of Cerro de los Batallones (Fig. 1B).
These two fossil sites have diverse carnivore assemblages, with BAT-1 recording a total of 10 species and BAT-3 recording a total of 13 species (Table 1). At BAT-1, 13,954 carnivore specimens have been recovered, representing 97.0% of the large-mammal assemblage. At BAT-3, 10,571 carnivore specimens have been unearthed, representing 99.5% of the large-mammal assemblage (Table 1). Although overall diversity of carnivores from BAT-1 and BAT-3 is comparable, there are notable differences in the composition and abundance of species. For example, the ailurid Simocyon batalleri is present in BAT-1, whereas no remains of this species have been found in BAT-3 (Table 1). In turn, the amphicyonid Thaumastocyon sp., the mustelid Eomellivora piveteaui, and the ursid Indarctos arctoides are present in BAT-3 but absent from BAT-1. The sabertoothed cats Promegantereon ogygia and Machairodus aphanistus, the feline Styriofelis vallesiensis, the amphicyonid Magericyon anceps, and the hyaenid Protictitherium crassum occur in both sites.
These species also differ in proportional abundance at the two sites. In terms of the number of identified specimens (NISP), in BAT-1, the most abundant species among all large mammals is the sabertoothed cat Promegantereon ogygia (49.5%), followed by Machairodus aphanistus (22.4%) (Table 1). The remaining BAT-1 carnivoran species are represented by less than 10% of the NISP for large mammals. In BAT-3, the two sabertoothed cats are also the most abundant species, but Machairodus aphanistus (36.4%) is more abundant than Promegantereon ogygia (29.3%). The ursid Indarctos arctoides is also represented by a high frequency of remains (18.7%). In Table 1, we reported NISP instead of MNI (minimum number of individuals), because this last index has not been yet estimated for the BAT-3 assemblage. This could be a concern in fossil sites where remains are very fragmented, because NISP can lead to a distorted estimation of the real abundance of individuals. Fragmentation of remains at BAT-1 and BAT-3 is very low and, specifically at BAT-1, NISP and MNI are strongly correlated (Pearson’s r=0.97; p<0.01; Domingo et al. Reference Domingo, Alberdi, Azanza, Silva and Morales2013a). Fossils from BAT-3 are well preserved and show little fragmentation, so we consider that, as in the case of BAT-1, NISP is also a good measure of the taxon abundance at this site.
Less can be said about the herbivore faunas due to the scarcity of their remains at BAT-1 and especially at BAT-3. Four hundred and thirty-one herbivore remains have been unearthed at BAT-1, representing 3% of the total large-mammal assemblage (Table 1). At BAT-3, herbivore representation is even lower, with only 52 herbivore specimens found, which comprises only 0.5% of the total large-mammal assemblage (Table 1). Although some of the herbivore taxa present at BAT-1 also occur at BAT-3 (e.g., Hipparion sp.), more material would be necessary to assess the degree of similarity of the herbivore faunas at these two sites.
Carnivoran Species
We briefly summarize below some aspects of the biology of the carnivores analyzed in this study, as well as their temporal range in relation to Cerro de los Batallones localities.
Promegantereon ogygia
This sabertoothed cat was the size of a leopard (Table 2, Fig. 2A). It was a hypercarnivore with a diet mainly consisting of meat (Morales et al. Reference Morales, Pozo, Silva, Domingo, López-Antoñanzas, Sierra, Antón, Escorza, Quiralte, Salesa, Sánchez, Azanza, Calvo, Carrasco, García-Paredes, Knoll, Fernández, Ostende, Merino, van der Meulen, Montoya, Peigné, Peláez-Campomanes, Sánchez-Marco, Turner, Abella, Alcalde, Andrés, DeMiguel, Cantalapiedra, Fraile, Yelo, Cano, Guerrero, Pérez and Siliceo2008). It is present both in BAT-1 and BAT-3. The first appearance of this species in Spain is at Cerro de los Batallones, specifically in Batallones-10 (BAT-10), a locality slightly older than BAT-1 and BAT-3 (Table 3).
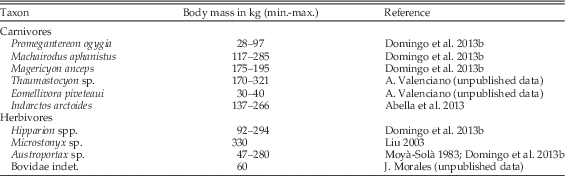
Body mass of the carnivores and herbivores included in the predator-diet analysis in this study. Body mass for Promegantereon ogygia, Machairodus aphanistus, and Magericyon anceps was obtained from BAT-1 specimens. Siliceo et al. (Reference Siliceo, Salesa, Antón, Monescillo and Morales2014) indicated that body mass for BAT-1 and BAT-3 Promegantereon ogygia was similar. Based on dental measurements, Monescillo et al. (Reference Monescillo, Salesa, Antón, Siliceo and Morales2014) indicated that Machairodus aphanistus from BAT-3 remained towards BAT-1 lower body mass values. Min., minimum body mass; max., maximum body mass. For Microstonyx sp. and Bovidae indet., only the median value is provided.
Temporal ranges of Cerro de los Batallones carnivoran species in Spain. 1, taxon is present; 0, taxon is absent. Of the nine Cerro de los Batallones localities, BAT-10, BAT-1 and BAT-3 have been included here because their temporal relationships are known: BAT-10 is older than BAT-1, and BAT-1 is older than BAT-3 (López-Antoñanzas et al. Reference López-Antoñanzas, Peláez-Campomanes, Álvarez-Sierra and García-Paredes2010). Estimated temporal difference among these three sites is not longer than 0.3 Myr (see text). Taxa analyzed in this study are marked with an asterisk. Note that the presence/absence data as well as the temporal duration reported here refers only to the fossil record of this taxa in Spain. Species only found at Cerro de los Batallones sites were given a duration of 0.3 Myr if they are present in more than one site (see text). Indarctos arctoides has been found at BAT-3 and BAT-5, and this is why we give a duration of 0.3 Myr to this taxon. Thaumastocyon sp. has only been found in one site, BAT-3, and, because the total time elapsed in the formation of the site is unknown, we just indicated that its temporal range in Spain coincides with the duration of formation of the site. Data were obtained from Domingo et al. (Reference Domingo, Badgley, Azanza, DeMiguel and Alberdi2014), references therein, and unpublished data.

Machairodus aphanistus
This sabertoothed cat was the size of a tiger (Table 2, Fig. 2B) and also was a hypercarnivore. It is present both in BAT-1 and BAT-3. This species occurs in Spanish fossil sites older and younger than those at Cerro de los Batallones (Table 3).
Magericyon anceps
This amphicyonid was the size of a tiger (Table 2). Its dentition exhibits hypercarnivorous traits that imply less scavenging and more active hunting than other members of this family (Peigné et al. Reference Peigné, Salesa, Antón and Morales2008). This amphicyonid is exclusively known from BAT-1 and BAT-3 (Table 3). Remains of this predator are rare in BAT-3, so we sampled only one tooth.
Thaumastocyon sp
This amphicyonid had body proportions similar to those of a brown bear and a diet that mainly consisted of meat. This species is only known from BAT-3 (Table 3).
Indarctos arctoides
This ailuropodine ursid (Abella Reference Abella2011; Abella et al. Reference Abella, Montoya and Morales2014) was the size of a European brown bear (Table 2, Fig. 2C). Based on its dental and skeletal traits, this animal was a hypocarnivore (diet >70% nonvertebrate foods; Van Valkenburgh Reference Van Valkenburgh2007); apart from meat, its diet included other elements such as plants (Abella Reference Abella2011; Abella et al. Reference Abella, Domingo, Valenciano, Montoya and Morales2011, Reference Abella, Pérez-Marcos, Valenciano, Alba, Ercoli, Hontecillas, Montoya and Morales2015). Soibelzon (Reference Soibelzon2012) recognized the difficulties of inferring the dietary preferences of bears, given the stability in the molar morphology of omnivorous carnivores. Following the approach described by Soibelzon et al. (Reference Soibelzon, Grinspan, Bocherens, Acosta, Jones, Blanco and Prevosti2014), we have used stable carbon isotope analyses in this study to test the dietary preferences of Indarctos arctoides from Cerro de los Batallones that, for the time being, are exclusively based on anatomical traits. This species is known only at Cerro de los Batallones sites, specifically BAT-3 and BAT-5 (Table 3).
Eomellivora piveteaui
This giant mustelid had a body mass comparable to that of a brown hyaena (Table 2, Fig. 2D). Its diet mainly consisted of meat but also incorporated some bone (Valenciano et al. Reference Valenciano, Abella, Sanisidro, Hartstone-Rose, Álvarez-Sierra and Morales2015). It is present at BAT-3 and BAT-10 but absent from BAT-1. This mustelid was present in Spanish fossil sites older than Cerro de los Batallones localities; its last appearance in the Spanish fossil record occurred at BAT-3 (Table 3).
Other carnivoran species also found at BAT-1 and BAT-3 include the ailurid Simocyon batalleri, the primitive hyaenid Protictitherium crassum, and the feline Styriofelis vallesiensis (Table 1). They were not included in this study due to rarity of their remains or the small size of their teeth. Their patterns of appearance and disappearance, along with the species described above, highlight the important role of the Cerro de los Batallones fossil complex in our current knowledge of late Miocene carnivores from Spain. Simocyon batalleri and Protictitherium crassum were present in fossil sites older than Cerro de los Batallones, but their last appearance in Spain is recorded in BAT-1 and BAT-3, respectively (Table 3). The feline Styriofelis vallesiensis is known in Spain only from the remains excavated at BAT-1 and BAT-3 (Table 3).
Previous Isotopic Analyses in Cerro de los Batallones
For mammals, the carbon stable isotope composition (δ13C) of tooth enamel tracks primarily the δ13C values of their diet (Koch Reference Koch2007; Clementz Reference Clementz2012, and references therein). The δ13C values of herbivorous mammals reflect the values of ingested plants, which vary depending on plant photosynthetic pathways (C3, C4, CAM) and ecological factors (e.g., aridity, canopy density) that affect fractionation during photosynthesis (Kohn and Cerling Reference Kohn and Cerling2002). The δ13C values of carnivorous mammals reflect the values of ingested prey (Koch Reference Koch2007). Multitaxic studies with species showing different resource and landscape use (e.g., more forested versus more open areas) constitute a reliable tool for reconstructing the type(s) of habitats where the animals lived.
In previous studies, we investigated the diet and resource partitioning of three apex predators from BAT-1 by comparing their carbon isotope values and those of potential prey (Domingo et al. Reference Domingo, Domingo, Badgley, Sanisidro and Morales2013b). To evaluate the relative contribution of different herbivore species to carnivore diets, we used the mixing model IsoSource (Phillips and Gregg Reference Phillips and Gregg2003). The two sabertoothed cats, Promegantereon ogygia and Machairodus aphanistus, displayed δ13C values that were statistically indistinguishable (Tukey post hoc test, p=0.845). This result suggested that they were feeding on prey from a similar habitat (not necessarily on the same species, given the different body sizes of these two predators). IsoSource failed to resolve the diet of some sabertoothed cat individuals because their δ13C values lay off the mixing line formed by the δ13C values of the prey species evaluated. Specifically, their δ13C values were lower than the lowest herbivore δ13C value. We concluded that these unresolved individuals may have included in their diets one or more prey sources that were not measured in the analysis and that occupied a dense woodland, thus producing lower δ13C values (Domingo et al. Reference Domingo, Domingo, Badgley, Sanisidro and Morales2013b). The δ13C values of the amphicyonid Magericyon anceps were significantly higher than those of the sabertoothed cats (Tukey post hoc tests, Promegantereon–Magericyon: p=0.004; Machairodus–Magericyon: p=0.01), implying resource partitioning with the use of prey from more open woodland (Domingo et al. Reference Domingo, Domingo, Badgley, Sanisidro and Morales2013b). The δ13C values of both carnivores and herbivores indicated that a C3 woodland with patches of C3 wooded grassland prevailed when BAT-1 formed 9 Ma (Domingo et al. Reference Domingo, Domingo, Badgley, Sanisidro and Morales2013b).
Research Questions
Based on the carbon stable isotope biogeochemistry of fossil tooth enamel of taxa from Cerro de los Batallones, we evaluate three questions about the habitat present in this area 9 million years ago and the ecology of carnivorans from BAT-1 and BAT-3.
Question 1: Is the Difference in Carnivoran Composition and Abundance Observed in BAT-1 and BAT-3 the Consequence of an Environmental Difference Between the Two Sites?
The presence of hypocarnivore individuals of large size, such as the ursid Indarctos arctoides, at BAT-3 and their absence from BAT-1, led some authors to suggest that a more forested habitat may have occurred at BAT-3 than at BAT-1 (Abella et al. Reference Abella, Domingo, Valenciano, Montoya and Morales2011; Monescillo et al. Reference Monescillo, Salesa, Antón, Siliceo and Morales2014). Prediction: if the vegetation changed between the time of BAT-1 and BAT-3, for example, more open area versus more forested area, then the δ13C values of mammal teeth should reflect this change and therefore differ. If the δ13C values of mammal teeth remain similar, then there is no basis for inferring a change in vegetation cover from the viewpoint of carbon stable isotopes.
Vegetation structure is most usually assessed from δ13C values of herbivores because herbivore dental enamel directly reflects the type vegetation on which they are feeding. Nevertheless, authors such as Bump et al. (Reference Bump, Fox-Dobbs, Bada, Koch, Peterson and Vucetich2007) have turned our attention to the importance of the isotopic values of predators as proxies to detect environmental change. These authors consider that environmental patterns are better represented when increasing the trophic level up to the predator level, as predators act as ecological integrators. Therefore, we consider that δ13C values of carnivores can provide clues about vegetation landscape, since they are indicative of the habitat those carnivores preferentially exploited. δ13C values of carnivores are a good complement to further corroborate environmental shifts obtained from the δ13C values of herbivores in terms of habitat present at a given area; this is especially true if the same predator species are present in the time periods environmentally compared. This is the case in our study, because Promegantereon ogygia, Machairodus aphanistus, and Magericyon anceps are present at BAT-1 and BAT-3.
Question 2: Are There Differences in the δ13C Values of Promegantereon ogygia from BAT-1 and BAT-3 That Imply That the BAT-3 Population Used a More Open Habitat than the BAT-1 Population?
In a comparison of BAT-1 and BAT-3 populations of the sabertoothed cat Promegantereon ogygia, Siliceo et al. (Reference Siliceo, Salesa, Antón, Monescillo and Morales2014) considered them a “chronopopulation,” with BAT-3 individuals showing more derived dental and postcranial traits than BAT-1 individuals. Based on differences in the postcranial skeleton related to a reduction of the hind limb weight in BAT-3, these authors suggested that Promegantereon from BAT-3 could have increased its cursorial abilities compared with the BAT-1 population (Siliceo et al. Reference Siliceo, Salesa, Antón, Monescillo and Morales2014). Prediction: increased cursorial abilities should be linked to use of a more open habitat, implying higher δ13C values for BAT-3 Promegantereon ogygia specimens compared with those from BAT-1.
Question 3: Do the δ13C Values of Predators at BAT-3 Signify High Levels of Interspecific Competition?
In a comparison of BAT-1 and BAT-3 populations of the sabertoothed cat Machairodus aphanistus, Monescillo et al. (Reference Monescillo, Salesa, Antón, Siliceo and Morales2014) indicated that the population from BAT-3 displays more derived dental traits than the BAT-1 population. The derived dental traits were interpreted as improved efficiency in feeding. Monescillo et al. (Reference Monescillo, Salesa, Antón, Siliceo and Morales2014) indicated that, for example, the buccolingually narrower p4 and m1 of BAT-3 individuals, compared with BAT-1 individuals, imply a more efficient carnassial blade and, therefore, faster meat consumption. The derived dental characters in BAT-3 Machairodus individuals would have constituted an advantage that might reflect a higher degree of interspecific competition among BAT-3 carnivorans (Monescillo et al. Reference Monescillo, Salesa, Antón, Siliceo and Morales2014). High levels of competition at BAT-3 are supported by the presence of several large predators: while at BAT-1 only two predators larger than 100 kg have been recovered (Machairodus aphanistus and Magericyon anceps), at BAT-3 there are four carnivorans with an estimated adult body size of more than 100 kg (Machairodus aphanistus, Magericyon anceps, Thaumastocyon sp., and Indarctos arctoides) (Table 2). These carnivores would potentially compete for similar prey. Prediction: an overlap of predators’ δ13C values would be consistent with high levels of interference competition, as they would be potentially feeding from same prey within the same habitat.
Materials and Methods
Fossil Teeth
We sampled the enamel of 63 carnivoran teeth (Supplementary Table 1). Twenty-seven teeth belong to BAT-1 carnivores and were published by Domingo et al. (Reference Domingo, Domingo, Badgley, Sanisidro and Morales2013b). The remaining 36 teeth belong to BAT-3 carnivorans and are published here for the first time.
The exceptional proportion of carnivoran fossils found in BAT-1 and BAT-3 assemblages is not without its drawbacks: herbivore remains are very rare at both sites (Table 1). Therefore, for the predator-diet analysis, we included herbivore tooth samples not only from these two localities but also from the nearby herbivore-rich site of BAT-10. These fossil sites differ slightly in age (by 0.30 Myr at most), and herbivore species present at the three sites, the hipparionine horses, do not differ significantly in their δ13C values (F=0.7, p=0.51). We acknowledge that it is ideal to draw trophic inferences from contemporaneous predator and prey remains; nevertheless, we consider that the small age difference between the sites makes it feasible to perform a valid predator-diet analysis. BAT-1 has now been exhaustively excavated, but continued excavation at BAT-3 and BAT-10 may provide additional herbivore samples.
The 32 herbivore teeth analyzed for this study are from hipparionine horses (Family Equidae, Hipparion spp.), a pig (Family Suidae, Microstonyx sp.), an antelope (Family Bovidae, Austroportax sp.), another bovid (Bovidae indet.) that is under study (but it is not Austroportax sp.), and two rhinoceroses (Family Rhinocerotidae, Rhinocerotinae indet. and Aceratherium incisivum) (Supplementary Table 1). Megaherbivores were not used in the analyses of predator diets (see “Results” section), but we included the teeth from two rhinoceros species recovered at BAT-1 (Supplementary Table 1) for a more complete assessment of the vegetation present at this site. The teeth sampled were all from adult individuals and are archived in the vertebrate paleontology collection of the Museo Nacional de Ciencias Naturales–CSIC (Madrid, Spain).
It was not possible to sample the same tooth position for all the taxa analyzed. Mann-Whitney (U) and Kruskal-Wallis (H) tests showed that there were not significant differences in tooth position for taxa with large enough sample sizes for comparison: BAT-1 Promegantereon (H=1.78, p=0.41), BAT-1 Machairodus (H=1.81, p=0.40), BAT-3 Promegantereon (U=1, p=0.11), BAT-3 Machairodus (H=1.49, p=0.47), and BAT-3 Indarctos (U=8, p=0.90). In the case of Hipparion sp. from BAT-1 and Rhinocerotinae indet. from BAT-1, there were too few teeth for comparison by tooth position, but we were able to compare preweaning teeth (first and second molars) versus postweaning teeth (second, third, and fourth premolars and third molar) (Higgins and MacFadden Reference Higgins and MacFadden2004). No significant differences were found for BAT-1 Hipparion sp. (U=2, p=0.49) or BAT-1 Rhinocerotinae indet. (U=0, p=0.24).
Isotopic Methods
Generally, 4 to 5 mg of dental enamel powder was sampled from each tooth. Carnivoran tooth enamel is very thin compared with that of most herbivores, and the teeth are delicate; in some instances, we could sample only 2–3 mg. Fortunately, in recent years, mass spectrometers have provided good results for apatite amounts as low as ~0.5 mg after chemical treatment.
We sampled each tooth from the occlusal surface to the cervix, so the samples represent the time span of tooth formation. Sampling was performed using a dental rotary drill with a diamond-tipped burr. We followed the protocol of Koch et al. (Reference Koch, Tuross and Fogel1997) for enamel pretreatment. The enamel powder was first treated with 2% NaOCl for 24 hours to remove organic matter. After the samples were rinsed five times with ultrapure water, enamel powder was soaked in a 1 M acetic acid-1 M calcium acetate buffer solution for 24 hours to eliminate diagenetic carbonates. After the supernatant was removed, the samples were again rinsed five times with ultrapure water and were freeze-dried overnight.
After the samples were treated, isotopic analyses were performed on Thermo MAT253 dual-inlet isotope-ratio mass spectrometers coupled to a Kiel IV carbonate device at the Stable Isotope Laboratory of the Department of Earth and Environmental Sciences of the University of Michigan and at the Stable Isotope Laboratory of the University of California–Santa Cruz. Duplicate analyses were carried out for ~90% of the samples.
Carbon stable isotope results are reported in δ-notation, δHX sample=[(R sample − R standard)/ R standard]×1000, where X is the element; H is the mass of the rarer, heavy isotope; and R=13C/12C. The isotopic reference standard for carbon is Vienna Pee Dee Belemnite (VPDB). The standards used were Carrara marble (CM; δ13C=2.05‰), NBS-18 (δ13C=−5.03‰), and NBS-19 (δ13C=1.95‰). The standard deviations for repeated measurements of CM (n=15), NBS-18 (n=10), and NBS-19 (n=8) were 0.09‰, 0.04‰, and 0.08‰, respectively.
To compare the Miocene δ13C values to those documented for modern vegetation, it was necessary to adjust for changes in the δ13C of the atmosphere (δ13CatmCO2) due to both geohistorical changes in δ13C of CO2 since the late Miocene and the increase in light carbon released by the burning of fossil fuels in the last 200 years (Friedli et al. Reference Friedli, Lotscher, Oeschger, Siegenthaler and Stauver1986; Marino and McElroy Reference Marino and McElroy1991). For the late Miocene age of the Cerro de los Batallones fossil sites, based on the work of Tipple et al. (Reference Tipple, Meyers and Pagani2010), the δ13CatmCO2 value was ~−6‰, a difference of ~2‰ relative to modern δ13CatmCO2 (~−8‰). Taking this adjustment into account, the ranges of δ13C used to infer different kinds of vegetation and canopy cover from fossil teeth from Cerro de los Batallones are similar to those proposed by Domingo et al. (Reference Domingo, Koch, Grimes, Morales and López-Martínez2012, Reference Domingo, Koch, Hernández Fernández, Fox, Domingo and Alberdi2013): (1) closed-canopy forest, δ13C values less than −14.2‰, (2) woodland–mesic C3 grassland, values from −14.2‰ to −9.2‰, (3) wooded grassland–xeric C3 grassland, from −9.2‰ to −6.2‰, (4) mixed C3–C4 grassland, from −6.2‰ to −1.2‰, and (5) pure C4 grassland, greater than −1.2‰. No data are available for the δ13C values of modern vegetation from the Iberian Peninsula for directly extracting the δ13C threshold values between these types of vegetation. Cutoff values given here for closed-canopy forest and woodland–mesic C3 grassland, wooded grassland–xeric C3 grassland and mixed C3–C4 grassland, and mixed C3–C4 grassland and pure C4 grassland were obtained from widely accepted values in the literature, for example, MacFadden and Cerling (Reference MacFadden and Cerling1996), Feranec (Reference Feranec2003), Kohn et al. (Reference Kohn, McKay and Knight2005), and Tütken et al. (Reference Tütken, Kaiser, Venneman and Merceron2013). The cutoff δ13C value between woodland–mesic C3 grassland and wooded grassland–xeric C3 grassland is more difficult to determine, but our selected value is in agreement with previous work. For example, Kohn et al. (Reference Kohn, McKay and Knight2005) suggested a threshold value of −9‰ between woodland and more open conditions when investigating a North American Pleistocene fossil site. Matson et al. (Reference Matson, Rook, Oms and Fox2012) compiled plant δ13C values from different types of modern ecosystems, and our cutoff δ13C values for wooded grassland–xeric C3 grassland correspond well with δ13C values for C3 trees, shrubs, and grasses found mainly in Mediterranean forest, woodland, and scrub; tropical and subtropical dry broadleaf forest; and desert and xeric shrubland.
According to the UNESCO classification of African vegetation (White Reference White1983), (1) closed forest is a continuous stand of trees at least 10 m tall with interlocking crowns, (2) woodland has trees with canopy heights of 8–20 m, with their crowns covering at least 40% of the land surface but not overlapping extensively, (3) wooded grassland has a cover of grasses and other herbs, with woody plants covering between 10% to 40% of the ground, and (4) grassland is covered with grasses and other herbs, with woody cover less than 10%. Habitat inferences are based on the δ13C values of herbivores, since they feed directly from the surrounding vegetation. Based on their dental adaptations, the herbivores in our study cover a dietary spectrum from browsers (rhinoceroses, Bovidae indet.) to mixed feeders (Hipparion spp.) to mixed feeder–grazers (Austroportax sp.). The multitaxic approach used here guarantees that habitat inference is supported by several taxa of different dietary habits. To infer dietary preferences from the δ13C values of carnivorans and further delineate the habitat present in the study area, it is necessary to account for the trophic discrimination between predator and prey, usually herbivores. This δ13C offset results in slightly lower δ13C values in carnivoran enamel bioapatite compared with those of the herbivores (Fox-Dobbs et al. Reference Fox-Dobbs, Wheatley and Koch2006; Clementz et al. Reference Clementz, Fox-Dobbs, Wheatley, Koch and Doak2009). To account for this trophic discrimination, we adjusted carnivoran δ13C values by +1.3‰, following Fox-Dobbs et al. (Reference Fox-Dobbs, Wheatley and Koch2006) and Clementz et al. (Reference Clementz, Fox-Dobbs, Wheatley, Koch and Doak2009).
As previously indicated, we have also used carbon stable isotope analyses in this study to provide further information about the diet of the bear Indarctos arctoides from BAT-3. Different approaches for studying the diet of these omnivorous carnivores, such as dental microwear texture analysis, dental paleopathology analysis, biomechanical and anatomical analyses, or stable isotope analyses, are reported in the literature (e.g., Donohue et al. Reference Donohue, DeSantis, Schubert and Ungar2013; Soibelzon et al. Reference Soibelzon, Grinspan, Bocherens, Acosta, Jones, Blanco and Prevosti2014, and references therein). Here, we use the approach described by Soibelzon et al. (Reference Soibelzon, Grinspan, Bocherens, Acosta, Jones, Blanco and Prevosti2014) to shed light on the diet of this ursid, specifically on its degree of carnivory. The Soibelzon et al. (Reference Soibelzon, Grinspan, Bocherens, Acosta, Jones, Blanco and Prevosti2014) approach is based on quantifying the difference in the δ13C values of the ursid of interest and coeval herbivores (Δδ13C bear-herb). If the value is close to the previously mentioned δ13C offset between carnivores (other than bears) and herbivores, then a significant contribution of meat to the diet of the ursid can be accepted, that is, the ursid would be a carnivorous omnivore. If Δδ13Cbear-herb is far from the δ13C difference between carnivores and herbivores, then meat is not considered an important dietary source for the ursid, that is, the ursid would be a herbivorous omnivore.
Statistical Analysis and Diet Characterization
We used Shapiro-Wilk tests to check for normality in all of the data sets used in this study. Because we found that all data sets are normally distributed, we contrasted δ13C values of BAT-1 and BAT-3 using Student’s t-tests, ANOVA, and post hoc Tukey tests. Nonparametric tests (i.e., Mann-Whitney test, Kruskal-Wallis test) are also reported when any of the data sets had a small sample size (n ≤ 3). The significance level used was p=0.05.
We used MixSIAR (Stock and Semmens Reference Stock and Semmens2013), a Bayesian mixing model, to estimate the proportion of prey contributions to the diet of each predator. In contrast to other mixing models, Bayesian mixing models are able to incorporate variability in isotopic values of both source (prey) and consumer (predator) and in the trophic enrichment factor, analyze multiple sources, and incorporate prior information. MixSIAR resulted from a collaboration between the developers of SIAR (Stable Isotope Analysis in R; Parnell et al. Reference Parnell, Inger, Bearhop and Jackson2010) and MixSIR (SIR=sampling-importance-resampling; Moore and Semmens Reference Moore and Semmens2008) and is written in open-source code in R and JAGS (Plummer Reference Plummer2003; R Development Core Team 2015).
Prey species included in the mixing model were selected on the basis of their body size. We selected herbivores with a medium body size for ungulates (i.e., hipparionine horses, suids, and bovids; Table 2) as the most probable prey for the predators considered here. In the analysis of the dietary preferences of the predators, we did not include megaherbivore species present in Cerro de los Batallones sites (rhinoceroses, giraffids, and proboscideans), as we consider that the carnivorans would have consumed these species only under exceptional circumstances (i.e., young, diseased, or old megaherbivore individuals or as carrion) and not on a regular basis (see Domingo et al. Reference Domingo, Domingo, Badgley, Sanisidro and Morales2013b).
The combination of some sources to reduce their total number in the Bayesian analysis is recommended to achieve a more constrained solution (Phillips et al. Reference Phillips, Newsome and Gregg2005, Reference Phillips, Inger, Bearhop, Jackson, Moore, Parnell, Semmens and Ward2014). Combining sources must have a logical basis, for example, combination within the same higher taxon or combination of taxa from well-differentiated habitats such as marine versus terrestrial. Following this recommendation and their statistically non-different δ13C values (see above), we grouped together the hipparionine horses from BAT-1, BAT-3, and BAT-10.
The more food sources vary from each other in terms of their isotopic composition, the more constrained is the result obtained from the mixing model, that is, the estimates indicative of the contribution of each source to the diet of the consumer (Phillips et al. Reference Phillips, Newsome and Gregg2005, Reference Phillips, Inger, Bearhop, Jackson, Moore, Parnell, Semmens and Ward2014). For Cerro de los Batallones, δ13C values of the herbivore prey species show considerable overlap (Fig. 3, Supplementary Table 2), so we anticipate that the mixing model will provide less source discrimination than in a scenario with highly distinctive sources. Still, MixSIAR can provide useful information for characterizing trophic relationships in this ancient food web.
Stable carbon isotope values (mean ± 1 SD) for BAT-1 and BAT-3 carnivore and herbivore species. Carnivore values were adjusted by +1.3‰ to account for trophic discrimination (Fox-Dobbs et al. Reference Fox-Dobbs, Wheatley and Koch2006; Clementz et al. Reference Clementz, Fox-Dobbs, Wheatley, Koch and Doak2009). Indarctos arctoides δ13C values are shown with adjustment and without adjustment given the omnivorous nature of this taxon. The dashed horizontal line marks the carbon isotopic threshold between woodland and wooded grassland. Profiles of the animals are not to scale.

MixSIAR results (posterior probabilities of dietary proportions) are reported as the median and 95% Bayesian credible intervals of the likely contribution of each prey taxon to the tissue composition of the predators. MixSIAR uses a Markov chain Monte Carlo (MCMC) model-fitting algorithm. We considered model results as satisfactory when they converged in probability space, as indicated by trace plots and Gelman-Rubin and Geweke tests provided in MixSIAR (Stock and Semmens Reference Stock and Semmens2013).
Results
The δ13C values of BAT-3 herbivore and carnivore teeth (after adjustment for trophic discrimination) imply the prevalence of a C3 woodland habitat in the Cerro de los Batallones area (Table 4, Fig. 3). This result agrees with habitat inferences established for BAT-1 (Domingo et al. Reference Domingo, Domingo, Badgley, Sanisidro and Morales2013b).
Mean and 1 standard deviation (SD) δ13C values for the taxa analyzed in this study. Carnivore δ13C values are adjusted by +1.3‰ to account for trophic discrimination (Fox-Dobbs et al. Reference Fox-Dobbs, Wheatley and Koch2006; Clementz et al. Reference Clementz, Fox-Dobbs, Wheatley, Koch and Doak2009). Hipparionine horses from Cerro de los Batallones are under study, so note that Hipparion spp. from BAT-1, BAT-3, and BAT-10 might be different species. In the case of Indarctos arctoides, we provide raw and adjusted data. The last column represents the difference between the δ13C mean value of Indarctos arctoides (raw value) and the the δ13C mean value of herbivores that could be potential prey. n, number of teeth sampled.

Among herbivores, no significant differences were detected when the δ13C values of BAT-3 Hipparion sp. were compared with the δ13C values of BAT-1 Hipparion sp. (Student’s t-test: t=1.35, p=0.21; Mann-Whitney tests: U=4, p=0.17). The same was true for comparison of variances (F=2.66, p=0.14). The δ13C values for BAT-1 herbivores range from −11.78‰ to −8.31‰ whereas the δ13C values for BAT-3 herbivores extend from −12.44‰ to −10.67‰ (Supplementary Table 1). There was no significant difference when means of all herbivores from BAT-1 and all herbivores from BAT-3 were compared (t=1.99, p=0.06) or when the variances of these two groups were compared (F=1.52, p=0.81).
We also compared δ13C values of carnivoran species present at both sites. BAT-1 and BAT-3 Promegantereon ogygia samples did not differ significantly in their δ13C values (t=−0.84, p=0.41). Likewise, the variance in δ13C values of BAT-1 and BAT-3 Promegantereon samples (F=1.07, p=0.93) did not differ significantly. No significant differences in the δ13C means were observed for the other sabertoothed cat, Machairodus aphanistus (t=−1.48, p=0.16), and similarly, no significant differences were detected in their variances (F=1.57, p=0.49). For Magericyon anceps, we could not perform statistical comparison between the two sites, since we sampled only one tooth from BAT-3 (Table 4).
We compared δ13C values among five carnivores from BAT-3 and did not find significant differences among them (ANOVA F-test) or between any pair of species (Tukey post hoc test) (Table 5). Again, Magericyon anceps was not included in the analysis because it is represented by only one sample from BAT-3. Levene’s test revealed equal variances in all comparisons (Table 5). The same results were obtained for the Kruskal-Wallis test (Supplementary Table 3).
Results of the ANOVA and Tukey post hoc tests for δ13C values of BAT-3 carnivores. p > 0.05, no significant difference; p<0.05, significant difference. F=0.094, p=0.984. Levene’s test=0.376, p=0.824.

To assess the degree of carnivory of Indarctos arctoides from BAT-3, we determined the difference between the δ13C values of the ursid of interest and potential herbivore prey (Δδ13Cbear-herb; Table 4). The Δδ13Cbear-herb is −1.42‰, very close to the trophic discrimination between predator and prey (Fox-Dobbs et al. Reference Fox-Dobbs, Wheatley and Koch2006; Clementz et al. Reference Clementz, Fox-Dobbs, Wheatley, Koch and Doak2009). From the viewpoint of carbon stable isotope analyses, Indarctos arctoides would be considered an ursid with a omnivorous diet that incorporated a large proportion of meat. Therefore, this ursid is analyzed in this paper as a potential competitor for the rest of the predators. To maintain the comparability with the rest of the predators, we used the 1.3‰ adjustment for Indarctos arctoides (Table 4, Fig. 3).
As expected, the contributions of different prey species to predator diets had median values that generally were close to one another (Table 6). MixSIAR median results indicated that the four prey taxa analyzed could have contributed quite similarly to most of the predator diets. Taking this into account, it is possible to extract further inferences. At BAT-1, the undetermined bovid (Bovidae indet.) seemed to be the most feasible prey for the two sabertoothed cats, while the antelope Austroportax sp. had the lowest contribution to their diets. We observe the opposite pattern in the diet of BAT-1 Magericyon anceps: Austroportax sp. constituted the most important diet source for this amphicyonid, whereas the median contribution of the undetermined bovid was quite low. The undetermined bovid is represented by only one tooth, so results concerning this taxon must be considered with caution. Future analyses will allow us to confirm or discard dietary inferences of Cerro de los Batallones predators relative to this herbivore. In any event, the extreme negative δ13C value of this bovid can act as a good representative of taxa from closer environments at Cerro de los Batallones and for analysis of the relations of predators with dwellers from a closer habitat. At BAT-3, the prey contributing most importantly to the diet of all the predators were the hipparionine horses, and less feasible prey species varied among the carnivorans (Table 6).
Predicted diet proportions of predators from BAT-1 and BAT-3 derived from MixSIAR mixing model. Median estimates and 95% posterior intervals (CI) are provided. Largest prey contributions to predators’ diets are marked in bold.

Discussion
Exceptional taphonomic histories resulted in the predominance of carnivoran remains in the Miocene fossil assemblages of BAT-1 and BAT-3 (Domingo et al. Reference Domingo, Alberdi, Azanza, Silva and Morales2013a). The discovery of these sites was significant for Neogene vertebrate paleontology of the Iberian Peninsula, since the faunal remains significantly increased the carnivoran diversity known for the late Vallesian period. Almost 30% of the carnivoran species known for the MN10 (Mammalian Neogene) biochronological unit in Spain occur exclusively at Cerro de los Batallones sites.
The δ13C values of herbivorous and carnivorous mammals from BAT-3 suggest that C3 plants dominated the vegetation surrounding Cerro de los Batallones 9 to 10 Ma. The δ13C ranges of mammals from BAT-3 fall within the values assigned to woodland–mesic C3 grassland (Table 4, Fig. 3). These inferences largely agree with the carbon isotope analyses performed on fossils from BAT-1 (Domingo et al. Reference Domingo, Domingo, Badgley, Sanisidro and Morales2013b). Statistical analyses of the δ13C values of carnivorans and herbivores together with the mixing model dietary inferences allow us to address the research questions posed earlier.
(1) Does the Difference in Carnivoran Composition and Abundance Observed in BAT-1 and BAT-3 Result from an Environmental Difference between the Two Sites?
The δ13C values of carnivorous and herbivorous taxa present at both sites, Promegantereon, Machairodus, and Hipparion spp., did not differ significantly. Although the δ13C range for herbivores from BAT-1 was greater than the range obtained at BAT-3, the means and the variances of the two data sets showed no statistical differences. A greater δ13C range for herbivores at BAT-1 probably reflects the fact that more herbivorous species and teeth have been sampled at this fossil site (15 teeth sampled) compared with BAT-3 (4 teeth sampled). The δ13C values of predators from BAT-1 and BAT-3 indicated that they were hunting and feeding on herbivores within a woodland–mesic C3 grassland habitat. Thus, changes observed in carnivoran composition and proportional abundance cannot be attributed to a significant shift in the environmental conditions between the times of formation of BAT-1 and BAT-3. The δ13C values do not support the view that the Cerro de los Batallones area was more forested during the lifetimes of the mammals preserved at BAT-3 compared with those preserved at BAT-1. The absence of Eomellivora piveteaui, Thaumastocyon sp., and Indarctos arctoides at BAT-1 and their presence at BAT-3 was, therefore, not likely the consequence of a major habitat change in the area. Rather, their absence could indicate that these taxa were absent from the area at the time when BAT-1 was working as a trap, and they later entered the region during the time when BAT-3 was active as a trap. The disappearance of Simocyon batalleri (present in BAT-1 but absent in BAT-3) could have been the consequence of its competitive displacement by the new arrivals at BAT-3. BAT-3 still lacks a comprehensive taphonomic study, but if we assume a taphonomic history similar to the one inferred for BAT-1, based on the predominance of carnivores and similar geological context, then the differences in the abundance of carnivoran species could reflect different original population densities in the area through the time period represented between BAT-1 and BAT-3. Alternatively, we cannot discard the possibility that the absence of some of the carnivorans in these localities might be a matter of chance, that is, taxa were present in the area but did not become trapped in the cavities. Nevertheless, we consider that differences in the taxonomic composition of BAT-1 and BAT-3 are very pronounced (e.g., complete absence in one site of taxa that are abundant in the other site, such as Indarctos arctoides) as to consider them caused by pure chance.
If the observed pattern of presence and absence in Cerro de los Batallones is real and not the consequence of chance, then our results suggest that a rapid change occurred in the carnivoran guild of the Madrid Basin not associated with a shift in vegetation and emphasizes the potential role of interactions among the carnivorans in shaping guild composition.
(2) Did Promegantereon ogygia from BAT-3 Occupy a More Open Portion of the Habitat Than BAT-1 Individuals?
The BAT-3 Promegantereon sample showed δ13C values slightly higher than those at BAT-1 (the same is true for Machairodus and Magericyon; Table 4, Fig. 3), but the difference was small and not statistically significant. The two Promegantereon populations used a similar habitat. Still, the MixSIAR results show some differences in the contribution of prey species to the diet of the two Promegantereon populations (Table 6). Compared with Promegantereon from BAT-3, BAT-1 Promegantereon incorporated into its diet a higher proportion of Bovidae indet., a dweller of rather closed woodland habitat (Table 6). This bovid was found at BAT-3 and not at BAT-1; but notably, previous studies hypothesized that Promegantereon ogygia from BAT-1 was incorporating a prey source not represented among the BAT-1 fossil remains, with δ13C values indicative of a closed woodland (Domingo et al. Reference Domingo, Domingo, Badgley, Sanisidro and Morales2013b).
The lack of significant differences in the δ13C values does not point to an increase in the cursorial abilities (i.e., use of more open portion of the habitat) of the BAT-3 Promegantereon population compared with the BAT-1 population from the viewpoint of stable carbon isotopes.
(3) Is There Significant Overlap in the Predators’ δ13C Values That Could Be Indicative of High Levels of Competition among Them?
When BAT-1 and BAT-3 Machairodus aphanistus samples were compared, we obtained similar results to those for Promegantereon ogygia; that is, δ13C values did not differ significantly, but the BAT-3 sample displayed slightly higher values (Table 4, Fig. 3). The mixing model suggests that Bovidae indet. was the preferred prey species for BAT-1 Machairodus aphanistus and that, by the time when BAT-3 was forming, this sabertoothed cat had changed its preferred prey species to herbivores from slightly more open woodland, for example, Hipparion spp. (Table 6).
The δ13C values of the carnivorans from BAT-3 show considerable overlap (Fig. 3). The ANOVA and Kruskal-Wallis tests demonstrated no significant differences among the carbon isotope signatures of BAT-3 carnivores (Table 5, Supplementary Table 3), and the MixSIAR analysis revealed that all BAT-3 predators evaluated had a common preferred diet source: the hipparionine horses (Table 6). In any event, the predators could have also strongly competed for the rest of the prey in view of the very similar contribution values. These results are consistent with high levels of interspecific competition among BAT-3 predators, with similar-sized species competing for the same prey. Yet, further information on the partitioning of resources among these large predators can be added. First, at BAT-1, Magericyon anceps showed δ13C values that were significantly more positive than those of Promegantereon ogygia and Machairodus aphanistus (Domingo et al. Reference Domingo, Domingo, Badgley, Sanisidro and Morales2013b). Magericyon anceps was not included in the statistical analysis of BAT-3 predators because we could only sample one tooth from BAT-3 for this predator (Table 4). Results obtained by Domingo et al. (Reference Domingo, Domingo, Badgley, Sanisidro and Morales2013b) were similar to those from MixSIAR for Magericyon anceps: its preferred prey species was the antelope Austroportax sp., a dweller of the open part of the woodland–mesic C3 grassland habitat inferred for Cerro de los Batallones (Table 6). In BAT-3, as in BAT-1, the sampled tooth of Magericyon anceps had a higher δ13C value than those of the sabertoothed cats (and the rest of BAT-3 carnivores) and fell close to the threshold between woodland–mesic C3 grassland and wooded grassland–xeric C3 grassland (Table 4, Fig. 3). It is plausible, then, to infer resource use coincident with that inferred from BAT-1 specimens: the coexistence of Magericyon anceps with the other predators (especially those larger than 100 kg) was facilitated because this amphicyonid hunted prey from a more open portion of the habitat (Domingo et al. Reference Domingo, Domingo, Badgley, Sanisidro and Morales2013b).
Following the approach of Soibelzon et al. (Reference Soibelzon, Grinspan, Bocherens, Acosta, Jones, Blanco and Prevosti2014), we find that the δ13C values of the ursid Indarctos arctoides are consistent with the consumption of meat by this taxon (Table 4). Accordingly, this ursid could have been a potential competitor for the rest of predator species at BAT-3 (Table 5, Fig. 3, Supplementary Table 3). In any event, most ursids, and Indarctos arctoides is not an exception, are omnivores species, so coexistence would be facilitated by this taxon consuming substantial amounts of vegetation.
Coexistence of the large predators (Machairodus aphanistus, Magericyon anceps, Thaumastocyon sp., Indarctos arctoides) and the medium-sized predators (Promegantereon ogygia, Eomellivora piveteaui) in BAT-3 could have been further facilitated by elusive behavior of the latter relative to the former. By analogy with the behavior of modern sympatric felids, Salesa et al. (Reference Salesa, Antón, Turner and Morales2006) suggested that coexistence of the two sabertoothed cats was possible because the smaller species, Promegantereon ogygia, would have used tree cover (plausible with our inferred presence of woodland habitat) to hide from encounters with the larger species, Machairodus aphanistus. Coexistence between the two medium-sized carnivorans analyzed from BAT-3, Promegantereon ogygia and Eomellivora piveteaui, could have been facilitated by Eomellivora being not only an active hunter but also a scavenger and bone-crusher (Valenciano et al. Reference Valenciano, Abella, Sanisidro, Hartstone-Rose, Álvarez-Sierra and Morales2015). In modern carnivoran guilds, other strategies that permit the coexistence of predators include separation of hunting-activity times (diurnal versus nocturnal carnivores; Karanth and Sunquist Reference Karanth and Sunquist2000; Owen-Smith and Mills Reference Owen-Smith and Mills2008). These strategies could also have occurred in the BAT-3 carnivoran guild, but they cannot be directly inferred from the fossil record.
In this study, we performed new analyses of the carnivoran-rich BAT-3 assemblage and have rejected the hypothesis that differences between the carnivoran guilds of BAT-1 and BAT-3 were a consequence of significant habitat changes during the time elapsed between the formation of the two sites. We have expanded our knowledge of the feeding ecology and habitat preferences of these ancient predators with stable isotopic analysis of tooth enamel, a powerful tool that has been applied to the study of Neogene carnivores only on limited occasions.
Conclusions
Cerro de los Batallones, and specifically the localities of BAT-1 and BAT-3, stand out in the Miocene record of mammals for preserving an unusual concentration of carnivoran remains that represent diverse predator guilds. These time-successive sites display notable differences in the composition and abundance of carnivoran species. A habitat change was proposed as a possible hypothesis to explain the differences in the carnivoran guild composition.
Our carbon isotope analyses and comparison of the herbivore and carnivore faunas, as well as of individual species present at both sites, demonstrate that the vegetation remained stable during the time between the formation of BAT-1 and BAT-3, with the predominance of a woodland to mesic C3 grassland habitat. The carnivoran guild from the Madrid Basin experienced a rapid change in its component species without a significant change in habitat. The faunal differences could reflect (1) the original carnivoran population densities and (2) the sequence of appearances and disappearances. These were driven by competitive interactions rather than by vegetation change. The alternative hypothesis, that differences in the carnivoran taxonomic composition between BAT-1 and BAT-3 were caused by chance, cannot, however, be rejected at this point.
Evidence from carbon stable isotopic composition of Indarctos arctoides teeth are consistent with a diet including meat, so this ursid can be considered a carnivorous omnivore.
A Bayesian mixing model allowed us to characterize the contribution of selected prey to carnivoran diets. For the two sabertoothed cats, we detected subtle changes in their prey preferences, with BAT-1 populations preferring the unidentified bovid species and BAT-3 populations preferring the hipparionine horses. The considerable number of medium to large predator species with hypercarnivore diets in BAT-3, along with the high overlap in their δ13C values, imply the occupation and use of a similar portion of the habitat (with the possible exception of Magericyon anceps). This amount of overlap for several species suggests that strong interspecific competition occurred among them (stronger than at BAT-1). The mixing model also points to high levels of rivalry among BAT-3 predators, as it identified a common preferred prey for BAT-3 carnivores: the equids Hipparion spp.
Advances in stable isotope sampling techniques along with smaller sample sizes needed by modern laboratories make it possible to minimize damage inflicted to fossils. Therefore, at those fossil sites where remains are abundant enough to support statistically sound analyses, it is highly advisable to perform stable isotope analyses, since the insights gained about the ecology and trophic interactions of extinct mammals are invaluable and sometimes impossible to obtain with other techniques.
Acknowledgments
This study was funded by the Spanish Ministerio de Economía y Competitividad (MINECO) project CGL2011-25754 to J.M., and it is part of the BSCH-UCM910607 research group. M.S.D. was supported by postdoctoral fellowships from a U.S. National Science Foundation grant (EAR-0957992 to C.B.), the MINECO project CGL2009-09000, and the MINECO Formación Postdoctoral 2013 program. L.D. acknowledges a PICATA postdoctoral fellowship of the UCM-UPM, Moncloa Campus of International Excellence, and a Juan de la Cierva postdoctoral fellowship from the MINECO. J.A. is researcher of the Prometeo program (Secretaría de Educación Superior, Ciencia Tecnología e Innovación, Ecuador Republic) and a member of the MINECO project CGL2011-28681. A.V. is a researcher in training in the CSIC program JAE-PRE_CP2011 (CSIC program Junta para la Ampliación de Estudios), cofunded by the European Social Fund. We thank Lora Wingate (University of Michigan) and Dyke Andreasen (University of California Santa Cruz) for their help with stable isotope analyses. We thank Mauricio Antón, Israel Sánchez, and Sergio Pérez for permission to use their illustrations. This manuscript benefited from comments from Paleobiology associate editor Bruce MacFadden and four anonymous reviewers.
Supplementary Material
Supplemental material deposited at Dryad: doi: 10.5061/dryad.3c2hm



