Advances in genomic information, automated data capture and modern analytical techniques have provided new opportunities for genetic improvement of important economic traits in dairy cattle (Miglior et al., Reference Miglior, Fleming, Malchiodi, Brito, Martin and Baes2017). The collection of detailed phenotypic data for a sufficiently large population, in conjunction with the corresponding genotype information, has enabled the identification of genetic markers underlying complex phenotypic traits. In recent years, a multitude of genetic markers influencing milk production and quality traits have been localized within quantitative trait loci (QTLs) scattered throughout the cattle genome (Bobbo et al., Reference Bobbo, Tiezzi, Penasa, De Marchi and Cassandro2018). Integration of these markers into selection programs provides great potential to improve the efficiency and accuracy of conventional breeding, hence accelerating the genetic improvement of milk production traits considerably (Viale et al., Reference Viale, Tiezzi, Maretto, De Marchi, Penasa and Cassandro2017; Li et al., Reference Li, Lu, Gao, Wang, Arbab, Sun, Chen, Zhang, Karrow and Yang2019).
Association studies with candidate-gene approaches have proven extremely powerful methods for identifying genetic markers that contribute to a specific trait of interest (Li et al., Reference Li, Lu, Gao, Wang, Arbab, Sun, Chen, Zhang, Karrow and Yang2019; Li et al., Reference Li, Gao, Wang, Liang, Sun, Chen, Zhang, Karrow, Yang and Mao2020). 1-Acylglycerol-3-phosphate O-acyltransferase 3 (AGPAT3) is a crucial acyltransferase involved in the biosynthesis of triglyceride (TG) and phospholipid (Biao et al., Reference Biao, Jiang, Yaling and Hatch2005) and has been considered as a candidate gene involved in fatty acid synthesis. The protein encoded by this gene can catalyze the acylation of lysophosphatidic acid (LPA) at the second carbon (sn-2 position) to form phosphatidic acid (PA), a key intermediate of lipid synthesis (Yamashita et al., Reference Yamashita, Hayashi, Nemoto-Sasaki, Ito, Oka, Tanikawa, Waku and Sugiura2014). The AGPAT3 mRNA is ubiquitously expressed in various mouse tissues, showing high expression levels in the mammary gland, adipose, testis, kidney, liver, and heart tissues, and low levels in spleen and skeletal muscle (Biao et al., Reference Biao, Jiang, Yaling and Hatch2005; Lu et al., Reference Lu, Jiang, Man, Brown, Elias and Feingold2005). The expression of AGPAT3 in mouse heart seemed to be modulated by peroxisome proliferator activated receptor α (PPARα) activation (Biao et al., Reference Biao, Jiang, Yaling and Hatch2005). In PPARα null mice, cardiac AGPAT3 activity was 25% lower than that in wild-type (Biao et al., Reference Biao, Jiang, Yaling and Hatch2005). AGPAT3-knock-out mice exhibited a specific and almost complete deficiency of DHA-containing glycerophospholipids in the retina (Shindou et al., Reference Shindou, Koso, Sasaki, Nakanishi, Sagara, Nakagawa, Takahashi, Hishikawa, Iizuka-Hishikawa and Tokumasu2017). In Drosophila S2 cells, AGPAT3 was strongly enriched in the lipid droplets fraction and specifically interacted with glycerol-3-phosphate acyltransferase 4 (GPAT4), metabolizing the product of the GPAT4 reaction (Wilfling et al., Reference Wilfling, Wang, Haas, Krahmer, Gould, Uchida, Cheng, Graham, Christiano and Fröhlich2013). Depletion of AGPAT3 impaired TG synthesis and led to a drastic reduction of the large lipid droplets (Wilfling et al., Reference Wilfling, Wang, Haas, Krahmer, Gould, Uchida, Cheng, Graham, Christiano and Fröhlich2013).
In humans, the single-nucleotide polymorphism (SNP) rs283452 in AGPAT3 gene has demonstrated an association with plasma TG levels after omega-3 polyunsaturated fatty acids (n-3 PUFA) supplementation (Ouellette et al., Reference Ouellette, Cormier, Rudkowska, Guénard, Lemieux, Couture and Vohl2013). In a genome-wide association study, SNP rs7435 in AGPAT3 gene has been reported to be associated with docosapentaenoic acid (DPA) levels (Lemaitre et al., Reference Lemaitre, Tanaka, Tang, Manichaikul, Foy, Kabagambe, Nettleton, King, Weng and Bhattacharya2011), an n-3 PUFA that is an intermediary between EPA and DHA and has a proven hypotriglyceridemic effect (Mann et al., Reference Mann, O'Connell, Baldwin, Singh and Meyer2010). Bovine AGPAT3 is located at 146.7 Mb on Bos taurus autosome 1 (BTA1) and consists of eight exons encoding 376 amino acid chains. In dairy cattle, genome-wide association studies have identified AGPAT3 as a positional candidate gene influencing milk fatty acids profile (Li et al., Reference Li, Sun, Zhang, Wang, Wu, Zhang, Liu, Li and Qiao2014; Olsen et al., Reference Olsen, Knutsen, Kohler, Svendsen, Gidskehaug, Grove, Nome, Sodeland, Sundsaasen, Kent, Martens and Lien2017), which is a fundamental aspect of milk nutritional quality. However, studies on the discovery of novel polymorphisms in bovine AGPAT3 gene and their subsequent association with milk production traits in dairy cattle are still lacking. Therefore, the present study aimed to identify the novel SNPs located in the AGPAT3 gene and to evaluate their effects on milk production and quality traits in a population of Chinese Holstein cows.
Materials and methods
Animals and phenotypic data
All animal experiments were performed following the guidelines of the Institutional Administrative Committee and Ethics Committee of Laboratory Animals (license number: SYXK [Su] 2017-0044) and were approved by the Yangzhou University Institutional Animal Care and Use Committee.
A total of 9114 test-day records including milk, fat and protein yields, fat and protein contents, somatic cell counts (SCC), and milk urea nitrogen (MUN) measured on 1416 lactations of 989 Chinese Holstein dairy cows were collected in January 2016 and December 2018. The cows were located on six herds in East China and raised under similar feeding and management conditions. All cows were in the first, second or third lactation and were milked three times a day. The lactation stage, season, parity, and date of milk sampling were registered for each milk sample. Milk samples were analyzed in the Dairy Herd Improvement laboratory of Nanjing Dairy Cattle Breeding Center using Milko-Scan FT6000 (Foss Electric, Denmark). Somatic cell counts were determined by flow cytometry with a Fossmatic 5000 cell counter (Foss Electric, Denmark) and samples with an SCC > 300 000 cells/mL were excluded to avoid any effects of mastitis. Somatic cell score (SCS) were calculated using the formula: SCS = log2(SCC/100 000) + 3 (Wiggans and Shook, Reference Wiggans and Shook1987).
DNA extraction and SNP genotyping
Five milliliters of venous blood from each cow were collected in EDTA Vacutainer tube (Becton Dickinson, Franklin Lakes, NJ, USA). Genomic DNA was extracted from the white blood cells using the TIANamp Genomic DNA kit (DP304, TIANGEN, China). The quality and quantity of DNA were assessed using NanoDrop 1000 spectrophotometer (Thermo Scientific, Wilmington, DE, USA) and agarose gel electrophoresis.
Five pairs of genome-specific primers were designed based on the published NCBI sequence (GenBank NC_037328.1) using the Primer Premier 5.0 software (Premier Biosoft International, Palo Alto, CA, USA) to identify putative SNPs in the promoter, exons and their adjacent intronic regions of bovine AGPAT3 gene (online Supplementary Table S1). DNA samples from 20 randomly selected cows were used for PCR amplification and sequencing. The PCR reactions were conducted in a PTC-200 DNA Engine cycler (Bio-Rad, CA, USA) using a touchdown procedure. Twenty microliters of PCR amplicons were sequenced bi-directionally using the Sanger method in Shanghai Sangon Company (Shanghai, China). After sequencing, the forward and reverse sequences were assembled using the ContigExpress module in Vector NTI Advance 11.5 (Invitrogen, Carlsbad, CA, USA) to identify SNPs. All eight identified SNPs were genotyped in the population commercially using the MassARRAY platform (Sequenom Inc., San Diego, CA, USA) (Gabriel et al., Reference Gabriel, Ziaugra and Tabbaa2009). Genomic DNA from 20 animals was genotyped in duplicate for each SNP. Concordance across the eight SNPs and all duplicates was 100%.
Statistical analyses
The allele frequency and genotype frequency were directly calculated. The Hardy−Weinberg equilibrium was tested by a χ2 test to compare the observed genotype frequencies within the expected frequencies. The pairwise linkage disequilibrium (LD) between each pairwise AGPAT3 combination of the segregating SNPs was calculated based on the allele frequency correlation using Haploview 4.2 (https://www.broadinstitute.org/haploview). Association studies were carried out using the linear mixed model in the GLM procedure of SAS (SAS Institute Inc, Cary, NC, USA) as the following:
 $$y_{ijkl} = \mu + {\rm HY}{\rm S}_i + {\rm parit}{\rm y}_j + {\rm DI}{\rm M}_k + G_l + a_m + e_{ijklmn}$$
where y is the phenotypic value for the analyzed trait; μ is the overall mean; HYSi is the fixed effect of farm, year and season of calving; parityj is the fixed effect of the parity (three classes: parity 1, 2 and 3); DIMk is the fixed effect of the stage of lactation (10 levels of 30 d each); Gl is the fixed effect of the lth genotype, am is the individual random effect, and eijklmn is the random residual.
The allele additive (a), dominance (d) and substitution (α) effects were calculated using the formula: a = (AA-BB)/2, d = AB-(AA + BB)/2 and α = a + d(q-p), where AA and BB represent the phenotype values of two homozygous genotypes, AB represents the phenotype value of heterozygous genotype, and P and q are the relevant allele frequencies of A and B (Falconer and Mackay, Reference Falconer and Mackay1996).
Transcription factor binding sites analysis
Bioinformatic analysis was performed using the panel of SNP in the promoter regions of the AGPAT3 gene to investigate the effects of allele substitution on the transcription factor binding sites predicted by the JASPAR CORE database (Fornes et al., Reference Fornes, Castro-Mondragon, Khan, van der Lee, Zhang, Richmond, Modi, Correard, Gheorghe and Baranašić2020).
Results
SNP detection
Sequence analysis of the promoter, exons, and their adjacent intronic regions of the bovine AGPAT3 gene revealed the presence of eight SNPs. One SNP (g.12264 C > T) located within the promoter region of AGPAT3. One SNP (g.18852 C > T) occurred within the exon 5 and was a synonymous mutation with no effect on amino acid 143 (p. Phe143Phe). While the other six SNPs (g.18658 G > A, g.20046 G > A, g.23034 C > A, g.28332 C > T, g.28484 C > T, and g.28731 A > G) were all located within intronic regions of AGPAT3. To the best of our knowledge, the eight putative novel SNPs identified in the current study have not been described previously. Details of the segregating SNPs including the location on BTA1 relative to AGPAT3 are illustrated in Figure 1.
Schematic diagram of the AGPAT3 gene with the localization of the eight identified SNPs.

Genetic diversity analyses
The allele and genotype frequencies are summarized in online Supplementary Table S2. The minor allele frequency (MAF) for the eight segregating SNPs ranged from 0.070 (g.12264 C > T) to 0.496 (g.23034 C > A). At g.12264 C > T locus, the observed frequencies of C and T alleles were 0.930 and 0.070. The frequencies of the CC, CT, and TT genotypes were 86.3%, 13.3%, and 0.4%, respectively. At g.23034 C > A locus, the minor allele frequency (C allele) was 0.496. The CA genotype had the highest frequency in the investigated population (43.6%) followed by the AA genotype (28.6%), while the CC genotype was the least frequent (27.8%). A chi-square test showed that the individual frequencies of the genotypes deviated from Hardy−Weinberg equilibrium for SNP g.23034C>A (χ2 = 15.547; P < 0.01), with a deficit of both CC and AA genotypes and in favor of heterozygotes (14.7% more than the expected value).
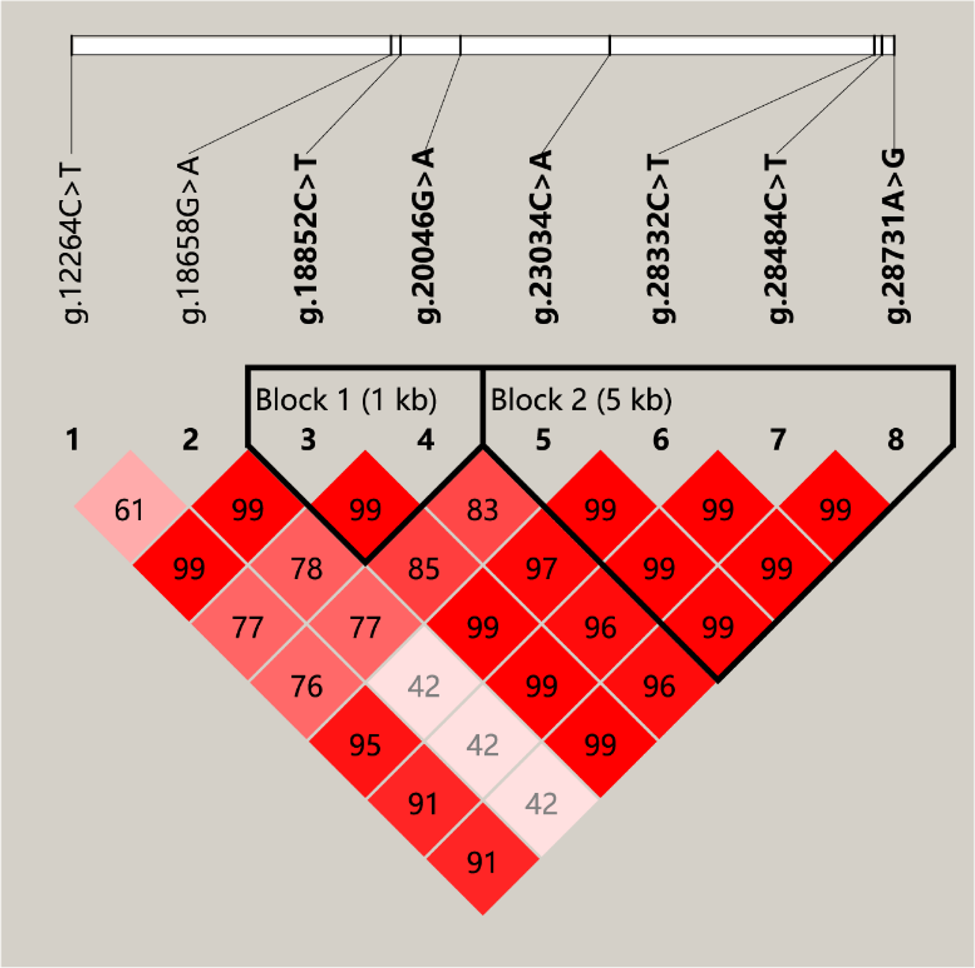
Figure 2 details the extent of linkage disequilibrium among the 8 segregating SNPs in the Chinese Holstein population. SNP g.18852 C > T was in strong LD with g.20046 G > A and the former had the greatest call rate. As such, SNP g.20046 G > A was omitted from the further association analysis. Furthermore, strong LD was observed between g.23034 C > A, g.28332 C > T, g.28484 C > T, and g.28731 A > G, all of which were within 5 kilobase pairs (kb), suggesting that these SNPs are unlikely to function independently of each other. Therefore, only SNP g.28731 A > G was retained in the association analysis.
Linkage disequilibrium as measured by D’ between the eight segregating SNPs in the bovine AGPAT3 gene.

Association analysis
Following the removal of all the aforementioned putative SNPs, a total of 4 segregating SNPs, g.12264 C > T, g.18658 G > A, g.18852 C > T, and g.28731 A > G, remained for further association analysis. Table 1 summarizes the effects of the AGPAT3 polymorphisms on routinely collected milk production traits, milk, fat and protein yields, fat, and protein percentage, SCS, and milk urea nitrogen.
Effects of AGPAT3 gene SNPs on milk production traits

α = allele substitution effects.
Means with different lowercase superscripts within a column differ (P < 0.05); P-value shows the significance of SNPs effects on production traits.
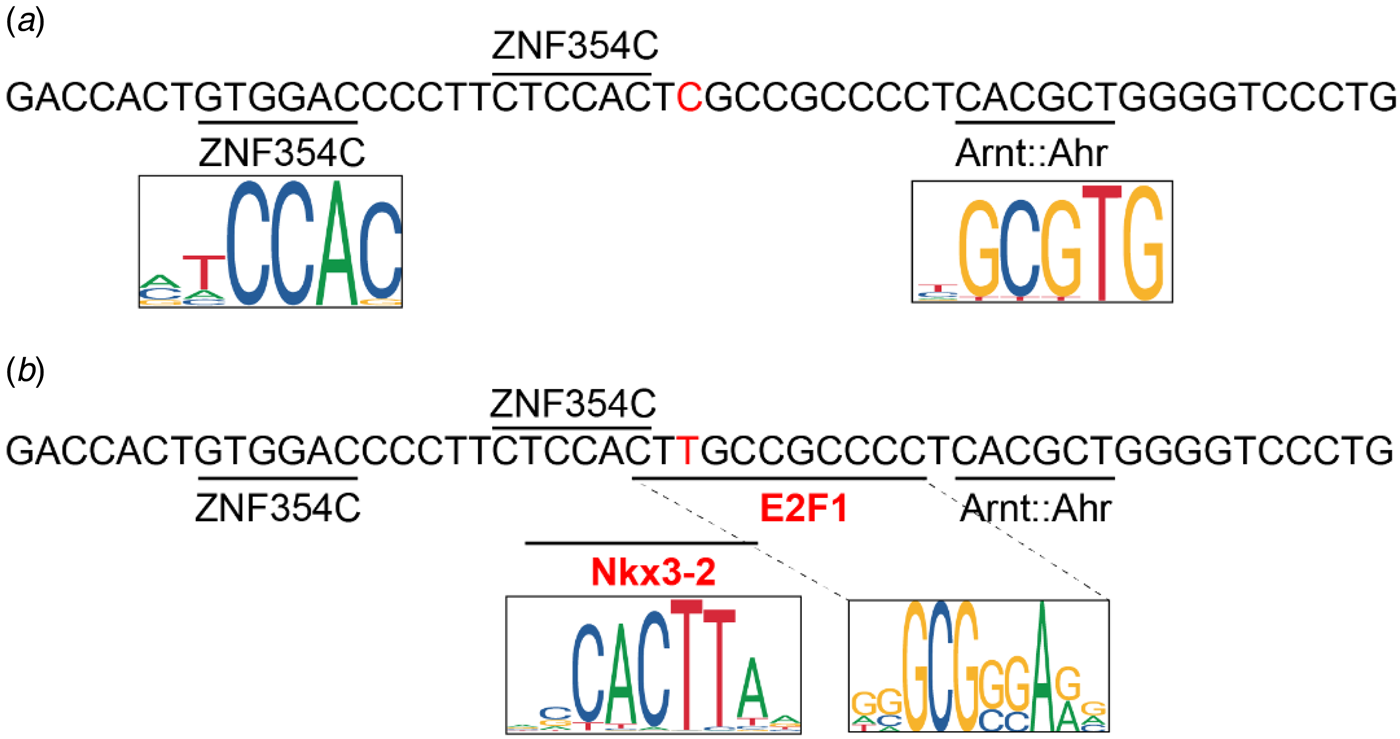
SNP g.12264 C > T, a promoter variant, was significantly associated with the test-day milk yield, protein percentage, and 305-day milk yield, with genotype CC showing higher increases in the affected traits (Table 1). This result is supported by the allele substitution analysis whereby substituting the allele T for C at g.12264 C > T locus reduced test-day milk yield by 2.89 kg, protein percentage by 0.07%, and 305-day milk yield by 473.93 kg, respectively (Table 1). Additionally, in silico analysis of transcription factor binding sites (TFBS), manifested the existence of multiple potential regulatory elements in AGPAT3 promoter DNA sequences (Fig. 3). Of particular interest is the observation that the C/T transition at SNP g.12264 C > T locus gives rise to two new TFBS, E2F transcription factor 1 (E2F1) and NK3 homeobox 2 (Nkx3-2).
Putative transcription factor binding sites are predicted in the flanking sequences of SNP g.12264 C > T of the AGPAT3 promoter region. The C and T allele with the flanking sequences are shown in A and B, respectively. Graphical sequence logos of the transcription factor binding motif sequence are from the JASPAR database.

The SNP g.18658 G > A showed a highly significant effect (P < 0.05) on fat percentage, as well as SCS and milk urea nitrogen (Table 1). Homozygous GG compared to GA and AA carriers had higher fat percentage and milk urea nitrogen, whereas the SCS were lower in cows of GG than GA and AA genotypes. The G allele of the SNP g.18658 G > A was associated with a 5% increase in fat percentage and 0.19 mg/dL increase in milk urea nitrogen, respectively, but a 0.22 decrease in SCS (P < 0.05; Table 1).
The SNP g.18852 C > T remained associated with test-day milk yield but not 305-day milk yield (P < 0.05; Table 1). In this case, the genotype TT was linked to the highest increase in test-day milk yield. Allele substitution at this locus (allele T substituted for C) indicated that the allele T increased test-day milk yield by 0.23 kg (Table 1).
The SNP g.28731 A > G showed highly significant effects on fat and protein percentage, 305-day milk yield, and SCS (Table 1). Allele substitution effects suggested that the G allele at this locus was associated with higher fat and protein percentage, and lower 305-day milk yield and SCS. It is particularly interesting that significant differences were not only found between AA and AG genotypes but also between AG and GG genotype classes, which indicate additive genetic effects of the two AGPAT3 alleles. No significant effect of the SNP g.28731 A > G on test-day milk yield was detected.
Discussion
Association studies with candidate genes have been widely used for the study of complex traits. Bovine AGPAT3 gene is located at 146.7 Mb on Bos taurus autosome 1 (BTA1). A connection between this region and predominantly long-chained fatty acid was reported in several studies. Bouwman et al. (Bouwman et al., Reference Bouwman, Bovenhuis, Visker and van Arendonk2011) detected a QTL region for C16 : 1 that is located between 146.4 and 161 Mb in the Dutch Holstein–Friesian population. Li et al. (Reference Li, Sun, Zhang, Wang, Wu, Zhang, Liu, Li and Qiao2014) observed significant associations with markers on BTA1 for C18 : 0 and C18 index at 146 Mb in Chinese Holstein. In another study, associations were reported between BTA1 and C18 index at 142.2 Mb in Chinese Holstein and C18 : 0 at 146.3 Mb in a joint analysis of Chinese and Danish Holstein (Li et al., Reference Li, Buitenhuis, Lund, Li, Sun, Zhang, Poulsen and Su2015). It is reasonable to assume that a gene involved in milk fatty acid synthesis may influence other production traits. However, there is a dearth of information about bovine AGPAT3 polymorphisms and their impacts on the important economic traits of dairy cattle. The current study reported the identification of previously undiscovered SNPs in the promoter, exons, and their adjacent intronic regions of the AGPAT3 gene which were associated with milk yields, fat and protein contents, somatic cell score and milk urea nitrogen.
Interestingly, the major allele C of the SNP g.12264 C > T is positively correlated with test-day milk yield, protein percentage, and 305-day milk yield, indicating that it is a marker for increasing milk yield without compromising milk contents traits. However, it should be noted that the standard errors for TT genotype effects were very large due to the small number of observations for these genotype classes. Recent studies have identified the role of low frequency and rare coding variation in complex traits, and emphasize the requirement for large sample sizes to vigorously identify such associations (Zuk et al., Reference Zuk, Schaffner, Samocha, Do, Hechter, Kathiresan, Daly, Neale, Sunyaev and Lander2014). Although a sufficiently larger population size is needed to draw a confident conclusion of the effects of the low-frequency T allele on milk production traits, the SNP g.12264 C > T identified herein emphasizes the benefits of the candidate gene approach to facilitate the discovery of rare variants affecting complex phenotypic traits.
The underlying mechanism of SNP g.12264 C > T corrected with milk production traits may be ascribable to its location in the AGPAT3 promoter region and its possible impacts on the transcription factor binding sites (TFBS). In silico analysis of putative transcription factor binding sites demonstrated that the T allele of g.12264 C > T introduces two novel TFBS which are abolished by the C allele. One of which is for E2F transcription factor 1 (E2F1), the first-described and well-studied member of the E2F family which are the terminal effectors of diverse signaling cascades that control the expression of genes implicated in cellular homeostasis (Dimova and Dyson, Reference Dimova and Dyson2005). E2F1 is also involved in the regulation of lipid metabolism through transcriptional regulation of the master lipogenic factor sterol regulatory element-binding protein 1c (SREBP1c) (Denechaud et al., Reference Denechaud, Lopez-Mejia, Giralt, Lai, Blanchet, Delacuisine, Nicolay, Dyson, Bonner and Pattou2016). E2F1-deficient mice exhibited decreased expression of lipogenic gene acetyl-CoA carboxylase 1 (ACACA), fatty acid synthase (FASN), and stearoyl CoA desaturase 1 (SCD1) in the liver (Denechaud et al., Reference Denechaud, Lopez-Mejia, Giralt, Lai, Blanchet, Delacuisine, Nicolay, Dyson, Bonner and Pattou2016). Given the important role of APGAT3 in the biosynthesis of triglyceride, it is therefore reasonable to assume that AGPAT3 mRNA may be regulated by E2F1. Similarly, the T allele introduces a predicted TFBS for NK3 homeobox 2 (Nkx3-2), which is a member of the NK family of homeobox-containing proteins and can act as a transcriptional repressor to negatively regulate chondrocyte maturation (Provot et al., Reference Provot, Kempf, Murtaugh, Chung, Kim, Chyung, Kronenberg and Lassar2006). However, binding of these transcription factors to the potential regulatory sites remains to be proved by experiment to further determine if this SNP is a quantitative trait nucleotide or causal mutation that was associated with milk production traits.
Polymorphism g.18658 G > A was the only SNP associated with milk urea nitrogen (MUN) with the G allele related to an increase in MUN as well as fat percentage, but a reduction in SCS. These results are consistent with previous findings that MUN had a moderate and positive genetic correlation with fat percentage but a negative genetic correlation with SCS (Miglior et al., Reference Miglior, Sewalem, Jamrozik, Bohmanova, Lefebvre and Moore2007). MUN is commonly used as a non-invasive assessment to measure animal protein status and nitrogen utilization efficiency (Jonker et al., Reference Jonker, Kohn and Erdman1998; Eicher et al., Reference Eicher, Bouchard and Bigras-Poulin1999). An increasing level of MUN is connected with a decreasing relative risk of culling in Holstein cows (Miglior et al., Reference Miglior, Sewalem, Jamrozik, Lefebvre and Moore2006). The positive genetic correlation of the allele G with MUN and a negative genetic correlation with SCS indicates that the SNP g.18658 G > A is a marker for the health and longevity status of cows.
The SNP g.28731 A > G was associated with fat percentage, protein percentage, 305-day milk yield and SCS. In dairy cattle, milk yield was positively genetically correlated to milk protein and fat yield, while negatively correlated to protein and fat percentages, and somatic cell count. From the results we could see that compared to AA and AG genotype at this locus, individuals with GG genotype have lowest 305-day milk yield and SCS, and highest fat and protein content. This data could further illustrate the veracity of our results. Holstein cows have been intensely selected for high milk yield, which may have an adverse effect on the fitness traits of the cows (Egger-Danner et al., Reference Egger-Danner, Cole, Pryce, Gengler, Heringstad, Bradley and Stock2015). This is supported by our results obtained here. Currently, the negative genetic decline of cow fitness traits is becoming a major issue, and the focus of selective breeding has shifted from production-oriented to more balanced breeding objectives. Fitness traits, such as mastitis resistance, are now integrated into the selection process (Egger-Danner et al., Reference Egger-Danner, Cole, Pryce, Gengler, Heringstad, Bradley and Stock2015). Genetic assessment and selection to reduce SCS can decrease the incidence of mastitis in dairy cattle. Our results indicate that the integration of the G allele of SNP g.28731 A > G into genetic selection breeding may be beneficial to the health of dairy cows.
SNPs g.18658 G > A and g.28731 A > G were both located within intronic evolutionary conserved regions of the AGPAT3 gene. It is widely recognized that gene transcription is precisely and coordinately regulated. Introns are known to bear cis-regulatory sequences and play an essential role in the rate of gene transcription (Carmel and Chorev, Reference Carmel and Chorev2012; Naftelberg et al., Reference Naftelberg, Schor, Ast and Kornblihtt2015). Alternatively, the association of g.18658 G > A and g.28731 A > G with milk production traits may simply be interpreted by the mapping of QTL for milk fatty acids composition at 146.4 and 161 Mb on BTA1 (Bouwman et al., Reference Bouwman, Bovenhuis, Visker and van Arendonk2011).
In conclusion, our study demonstrates that polymorphisms including low-frequency variants located within AGPAT3 can affect milk production traits of dairy cattle. The association between AGPAT3 locus and milk production traits could be utilized in marker-assisted selection for the genetic improvement of milk production traits and, probably in conjunction with other traits, for selection to improve the fitness of dairy cattle. In any event, further experiments in a larger population size are necessary to draw a confident conclusion of the effects of these SNPs on milk production traits.
Supplementary material
The supplementary material for this article can be found at https://doi.org/10.1017/S0022029921000546.
Acknowledgements
The research was funded by The Natural Science Foundation of Jiangsu Province (BK20180914), Natural Science Foundation of China (31972555), and China Postdoctoral Science Foundation (2018M642344).