I. INTRODUCTION
Knowledge of the physical properties of semiconductors, particularly the electrical response to an applied mechanical stimulus, is the foundation to present-day semiconductor technology. Furthermore, successful implementation of semiconductors into electronic, mechanical, magnetic, and optical devices necessitates a thorough understanding of both the electrical and mechanical properties. Recently, significant interest has grown in in-situ characterization of the electromechanical response of various semiconductor materials that undergo structural phase transformations (crystalline–crystalline or crystalline–amorphous) under extreme conditions such as pressure and/or temperature.Reference Eremets, Struzhkin, Mao and Hemley1, Reference Besson, Mokhtari, Gonzalez and Weill2 Such investigations are a novel means to characterize the subtle differences in electrical conductivity, from an initial-to-final phase, and to give valuable information on the transformation pathway of such materials. Nanoindentation is one such technique that can be easily used to both quantify and link the mechanical and electrical behavior of semiconductor materials and give significant insight into the deformation processes during indentation loading and unloading.Reference Nowak, Chrobak, Nagao, Vodnick, Berg, Tukiainen and Pessa3, Reference Bradby, Williams and Swain4
In situ electrical characterization during the load–unload cycle of a nanoindentation experiment is made possible through the use of a conductive tip.Reference Ruffell, Bradby, Williams and Warren5, Reference Mann, van Heerden, Pethica and Weihs6 Recently, conductive nanoindentation tips fabricated from B-doped diamond (BDD) have been used during in-situ electromechanical characterization.Reference Ruffell, Sears, Knights, Bradby and Williams7–Reference Fujisawa, Ruffell, Bradby, Williams, Haberl and Warren9 The technique has provided some qualitative measurements that have shed light on the electrical/mechanical response of several semiconductor materialsReference Nowak, Chrobak, Nagao, Vodnick, Berg, Tukiainen and Pessa3, Reference Ruffell, Bradby, Fujisawa and Williams10 and piezoelectric materials.Reference Bhaskaran, Sriram, Ruffell and Mitchell11
The dramatically improved lateral resolution (nm) and load control of modern nanoindentation systems now facilitate correlation between the mechanical and morphological data on dimensional scales comparable to atomic force microscopy based techniques,12 but with significantly enhanced mechanical information. Such improvements in nanoindentation instrumentation allow unique electromechanical characterization of molecular and biological systems, where the coupling between electrical and mechanical phenomena is a universal feature in virtually all biological systems. Potential bioapplications include uncovering the fundamental mechanisms of the electromechanical response of cellular membranes and electromotive proteins.Reference Kalinin, Rodriguez, Jesse, Karapetian, Mirman, Eliseev and Morozovska13
Phenomenologically, when two materials are brought into contact there is a resistance associated with the constriction of electron flow through the small area. This resistance, known as the contact (or constriction) resistance R, has been derived from the principles of Ohmic conduction and electric fields by HolmReference Holm14 as

Here, ρ 1 and ρ 2 are the resistivities of material 1 and material 2, respectively, and r is the radius of the contact. Determination of r from indentation experiments is relatively straightforward by considering the tip geometry used during nanoindentation and contact area of the tip as a function of the applied load/penetration depth. As such, the measured resistance between two materials, like that in the current nanoindentation experiments discussed below, is highly dependent on the active contact area.
The implementation of conductive diamond for device fabrication in high-power transistors, high-temperature and harsh-environment device applications has been recognized for many years.Reference Tachibana, Williams and Glass15–Reference Thonke18 While there has been significant progress in the growth and quality of single-crystal layers, effective incorporation of electrically active p- and n-type dopants remains a main issue.Reference Tumilty, Welch, Lang, Wort, Balmer and Jackman19 This is of paramount importance in nanoindentation applications where the conductive tip probes depths of a few hundred nanometers. Thus, if the electrically active area and the contact area discussed above are different due to inconsistencies in the doping profile as electrically inactive centers, or a nonuniform doping profile, the accuracy and reproducibility of any in-situ electrical measurements is limited. Thus, understanding the electrical, structural, surface, and dopant properties of the BDD tips is crucial as the electrical response of the material studied is intrinsically linked to the quality of the tip.
In the present article, we quantify various differences in the electronic and structural properties and doping profile present for several conductive BDD nanoindentation tips. These differences are then used to discuss the electrical response of the tips used to indent gold films and glassy carbon substrates. The different atomic B environments and near-surface homogeneity of active B doping within each tip was quantified via cathodoluminescence (CL) spectroscopy and CL mapping, whereas Raman microspectroscopy was used to determine the structural characteristics on the atomic scale and to estimate the B concentration of the BDD tips.
II. EXPERIMENTAL
All indentations were performed using a Hysitron TriboIndenter (Minneapolis, MN) fitted with 11 different BDD tips for the “nanoECR” mode of operation (the conductive tips were all commercially bought from Hysitron and were boron doped to a nominal resistivity of 3.3 Ω-cm). These conductive tips allow through-tip electrical measurements whereby the current can be monitored during loading/unloading, and current–voltage (IV) characteristics can be determined at any point on the load/unload cycles. Two bulk electrical standards were used to investigate the different BDD tips, specifically a 1.5 μm Au film deposited on a Si substrate and a thick conductive glassy carbon (800 μm) sample. The latter standard is known to show almost purely elastic mechanical response to nanoindentation (consequently with no pile up) for Berkovich indentation at the loads up to ∼10 mN used here.Reference Iwashita, Swain, Field, Ohta and Bitoh20 The indentation experiments were run consecutively in each sample, with no environmental changes to limit the effects of humidity and sample contamination. The electrical resistivity of the glassy carbon standard was metallic-like (∼6 × 10⁻⁴ Ω-m) as confirmed by the four-point probe technique.
CL spectra and maps were collected using an FEI Quanta 200 scanning electron microscope (SEM) equipped with a Gatan MonoCL3 system. The CL signal was detected using either an Ocean Optics QE65000 optical charge coupled device (CCD, Renens/Lausanne, Switzerland) spectrometer or a Hamamatsu R94302 Peltier cooled photomultiplier tube (Hamamatsu Photonics, Shizuoka, Japan). The wide spectral range of the CL system used, from the ultraviolet (UV) (∼200 nm) to far infrared (1000 nm), allows the characterization of the major defect structures in diamond. Spatially resolved spectral maps were generated using a Moran Scientific system (Goulburn, Australia) attached to the SEM-CL set up. CL and SEM images were recorded at liquid nitrogen temperature (LNT). All CL spectra were corrected for the detection response of the system. Acceleration voltages of 10 and 15 kV corresponding to excitation depths of ∼0.5–0.8 μm in diamond were used to produce sufficient CL signal. Raman microspectroscopy measurements at room temperature were made using a Jobin-Yvon T64000 instrument (HORIBA Jobin-Yvon, Longjumeau Cedex, France) fitted with an LNT-cooled CCD detector. Spectra were acquired at a short working distance (100× objective aperture) with a HeNe laser (632.8 nm) focused to a spot of 2 μm in diameter.
III. RESULTS AND DISCUSSION
A. In situ electrical properties
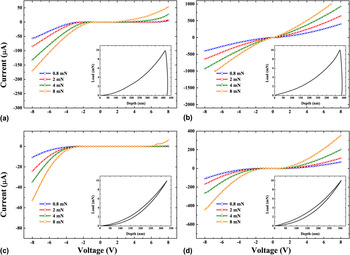
Figure 1 shows the through-tip IV curves at various positions on the loading cycle in the Au film (a, b) and in glassy carbon substrates (c, d). The load versus penetration depth curves for each material are shown as insets. The mechanical response for both tips is comparable (slight differences in the penetration depth are due to differences in tip wear), in contrast to the electrical responses, which differ significantly. For ease of discussion, the tips that show more rectifying IV curves are henceforth labeled as “family S” and those that show more Ohmic-like IV curves (almost linear IV curves) are labeled as “family O.” Note that the Ohmic-like IV curves in Figs. 1(b) and 1(d) do not exhibit the expected linear IV characteristics since at low loads the contact area is small resulting in the departure from pure Ohmic behavior at low voltages.Reference Ruffell, Bradby, Williams and Warren5 Fang and coworkers have also observed non-Ohmic IV curves while indenting bulk Cu.Reference Fang, Muhlstein, Collins, Romasco and Friedman8 The origins of the nonlinear electrical properties were not, however, investigated in the aforementioned study and were attributed to either surface oxidation or doping nonuniformities in the BDD tips.
Current–voltage curves extracted at loads of 0.8, 2, 4, and 8 mN for a (a, c) family S and (b, d) family O tips in (a, b) gold; and (c, d) glassy carbon standards. The insets show the load versus penetration depth curves.

The electrical properties of BDD, like other semiconductors, are principally governed by the dopant concentration.Reference Thonke18 For B concentrations below ∼1019 cm−3, the high bonding energy of the B acceptors results in only a small fraction (0.2%) of ionized B donors at room temperature. Hence, in this concentration range semiconducting (i.e., Schottky) contacts dominate when the tips are brought into contact with metal-like substrates. In the intermediate doping range (1019–1020 cm−3), current conduction is dominated by nearest neighbor hopping, and for B concentrations ∼2 × 1020 cm−3 the diamond is degenerate or metal-like. Our observation of rectifying IV curves of “family S” tips is similar to the electrical response commonly observed for metal–semiconductor (Schottky) diamond contacts,Reference Baumann and Nemanich21 due to a low active B concentration, typically below 1019 cm−3. The Ohmic-like properties of family O tips are similar to our previous reports,Reference Ruffell, Bradby, Williams and Warren5 indicative of a higher active B concentration, typically above 1020 cm−3 in these tips.
B. Cathodoluminescence spectroscopy
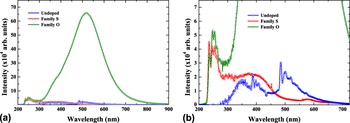
Representative CL spectra collected over an area of 25 × 25 μm2 for the different BDD and undoped diamond tips at LNT are shown in Fig. 2. Several distinct bands are visible in the undoped tip at high magnification, and these are commonly observed for various nitrogen (N)-related defects in diamond.Reference Collins, Connor, Ly, Shareef and Spear22–Reference Kadri, Araujo, Wade, Deneuville and Bustarret26 The absence of the free exciton bands and phonon replicas below 300 nm is attributed to N-related nonradiative recombination channels quenching their emission.Reference Robins, Farabaugh and Feldman27, Reference Sternschulte, Horseling, Albrecht and Thonke28 The structural integrity of the undoped diamond tip is evident, with no visible band at 430 nm indicative of dislocations/grain boundaries.Reference Takeuchi, Watanabe, Yamanaka, Okushi, Sawada, Ichinose, Sekiguchi and Kajimura29
(a) CL spectra recorded at liquid nitrogen temperature (LNT) for an undoped diamond tip and the BDD tips at an acceleration voltage of 15 kV and (b) the same data enlarged to highlight details of the undoped and family S tips.

The BDD tips show less fine structure in the CL signal compared to the undoped diamond tip. Vastly different broad bands are visible in Fig. 2, and these clearly indicate considerably different defect states within the BDD tips. The lack of any N-related bands (compared to the undoped tip) indicates that N contamination in the BDD tips is below the detection limit of CL. The CL emission from the family S tip is lower in intensity compared to the family O tip. This difference in intensity between the two families was consistently observed for the various BDD tips, with family O tips always showing higher signals. The UV bands (at ∼250 nm) shown in Fig. 2(b) are attributed to the free exciton recombination bandsReference Robins, Farabaugh and Feldman27, Reference Kawarada, Matsuyama, Yokota, Sogi, Yamaguchi and Hiraki30, Reference Kawarada, Yokota and Hiraki31 common to diamond. The differences in the free exciton recombination band heights observable between family S and O tips are attributed to different B concentrations.Reference Kawarada, Matsuyama, Yokota, Sogi, Yamaguchi and Hiraki30 The relatively featureless, broad blue band centered at ∼360 nm is the main band evident in the family S tips. This band has previously been observed in heavily BDD films grown by chemical vapor deposition in a very high concentration region where phase separation has been observed to occur, and also in BDD with low levels of electrically activated B.Reference Graham, Moustakas and Disko32, Reference Koizumi, Watanabe, Hasegawa and Kanda33 The presence of this band indicates that there is a significant component of nonactive BReference Lawson, Kanda, Kiyota, Tsutsumi and Kawarada34 or B-rich clustersReference Muret and Wade35, Reference Baron, Deneuville, Wade, Jomard and Chevallier36 in the family S tips.
The broad band at 520 nm observed in the family O tips is commonly observed for BDD films.Reference Kawarada, Yokota, Mori, Nishimura and Hiraki37 This band has been studied in detail for various natural, CVD, and high-pressure/high-temperature grown diamond samplesReference Klein, Crossfield, Freitas and Collins24, Reference Kawarada, Yokota, Mori, Nishimura and Hiraki37, Reference Dean38 and is found to occur in regions with high active B concentration and is unaffected by the N content.Reference Lawson, Kanda, Kiyota, Tsutsumi and Kawarada34, Reference Ruan, Kobashi and Choyke39 The lack of this band in the family S tips again indicates that the B present in these tips is (largely) not electrically activated. The small, broad shoulder band at 360 nm is an evidence that family O tips also contain some electrically inactive B component.
C. Cathodoluminescence mapping
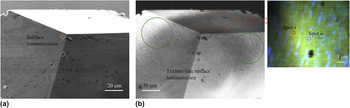
The luminescence from the family O tips was further examined by performing CL mapping. Family S tips were omitted in this study due to significant charging and weak signals. Figure 3 shows an (a) SEM and (b) corresponding full spectral CL map recorded at LNT for a representative family O tip. The near-surface luminescence is clearly nonuniform with a mosaic-like texturing apparent across the whole surface. Upon close inspection, it was found that these lighter regions (not visible in the SEM image) vary greatly in size with widths ranging from 0.5 to 1.5 μm. Some of the darker regions in the CL image (many also observed in the SEM image) are attributed to surface contamination.
(a) Scanning electron microscope and (b) spectral cathodoluminescence (CL) map recorded at LNT and with an acceleration voltage of 10 kV for a representative family O tip. The orange and green circles in (a) and (b) highlight surface contaminants and nonuniform surface luminescence, respectively. The colors in the pseudocolor map are identical to those discussed in the text. The CL spectra from the regions labeled “spot i” and “spot ii” in the inset are shown in Fig. 4.

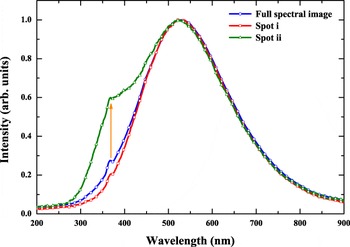
To investigate the origin of the nonuniform luminescent behavior, pseudocolor maps were generated over a smaller (and relatively contaminant free) region of the tip, as shown in the inset of Fig. 3. Such a technique is highly advantageous, with each individual pixel containing a single CL spectrum. As a result, more quantitative CL information can be extracted from the tip surface. The normalized CL spectra extracted from the green background (spot i), blue streak (spot ii), as indicated in the inset of Fig. 3, and the complete spectra from the full spectral image are shown in Fig. 4. The spectra from the full spectral image again show that the CL emission is dominated by the broad green band at 520 nm with the appearance of a small, but distinct blue shoulder band at 360 nm. Spectra taken from the blue streaks (spot ii) show a mixture of both green and a higher intensity 360 nm blue band compared to both spot i (which predominately contains the green band) and the background. The presence of this blue band thus indicates that the near-surface of the family O tips does contain regions high in electrically inactive centers. Furthermore, the presence of these “electrically dead” surface regions potentially hinders a quantitative analysis of through-tip electrical measurements with such tips.
CL spectra recorded at LNT from the regions shown in the inset of Fig. 3 for the family O tip.

D. Raman microspectroscopy
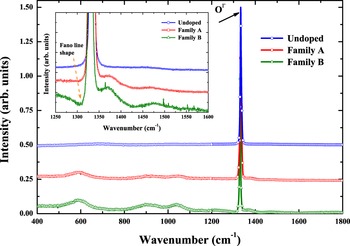
Figure 5 shows normalized Raman spectra collected for the undoped and representative BDD tips from families S and O. All tips show an intense zero center band (0Γ) located at ∼1332 cm−1 in agreement with previous studies.Reference Knight and White40 Family O tips appear to have a sharper 0Γ band compared to the undoped and family S tips, and this has previously been observed for polycrystalline BDD films with high B concentrations (∼1020 cm−3).Reference Nishimura, Das and Glass41 Another feature evident in the Raman spectra of all BDD tips are the broad, low-intensity bands centered at 592, 920, 1029, 1371, and 1475 cm−1. The presence of these bands is consistent with previous Raman studies of homoepitaxial BDD layersReference Mermoux, Jomard, Tavars, Omns and Bustarret42 and in polycrystalline BDD films.Reference Mermoux, Marcus, Swain and Butler43, Reference Szunerits, Mermoux, Crisci, Marcus, Bouvier, Delabouglise, Petit, Janel, Boukherroub and Tay44 They occur over a wide (active) B concentration range of 1018–1020 cm−3. At still higher concentrations (>2 × 1020 cm−3), further changes have been reported in the Raman signal and include the disappearance of the aforementioned low-intensity bands, a decrease in the intensity of the 0Γ band and the emergence of new bands at 500 and 1225 cm−1. The origin of the broad band at 500 cm−1 has recently been attributed to the formation of electrically inactive B dimers and/or large B clusters in very heavily doped diamond.Reference Bourgeois, Bustarret, Achatz, Omnes and Blase45, Reference Goss and Briddon46
Raman spectra for undoped, family S, and family O tips. All spectra have been normalized (to the 0Γ band height) and offset for clarity. The inset shows the extended region from 1300 to 1600 cm−1, more clearly displaying the broad bands discussed in the text.

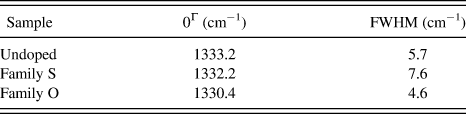
The 0Γ band of each tip shown in Fig. 5 was fitted with a Lorentzian function, and the results are given in Table I. As Table I demonstrates, relative to undoped diamond a shifting in the position of 0Γ to lower wave number is observed in the family O tip. A substantial narrowing of the 0Γ bandwidth is also observable in the family O tips. These are common features of all family O tips studied. The narrowing of the 0Γ bandwidth is commonly observed in heavily BDD.Reference Ager, Walukiewicz, Mc Cluskey, Plano and Landstrass47, Reference Gonon, Gheeraert, Deneuville, Fontaine, Abello and Lucazeau48 The 0Γ band narrowing is accompanied by a small depression in intensity on the lower side of 0Γ, and this change in the line shape typically occurs in heavily doped semiconductors and is referred to as the “Fano effect.”Reference Pruvost and Deneuville49 Furthermore, the Fano 0Γ band shape begins to occur in BDD with concentrations greater than 1019 cm−3.Reference Ager, Walukiewicz, Mc Cluskey, Plano and Landstrass47, Reference Gonon, Gheeraert, Deneuville, Fontaine, Abello and Lucazeau48 It is interesting that, relative to undoped diamond, the family S 0Γ band shows a much smaller shift than family O tips, but exhibits substantial peak broadening in contrast to narrowing observed for family O tips.
Refined Lorentzian fitting parameters for Raman spectra shown in Fig. 5.

FWHM, full width at half maximum.
The analysis of the 0Γ band, peak width deviations, and Fano shape obtained by Raman complement the CL data presented above, whereby the position and intensity of the bands allow us to estimate the B concentration in each tip. Family S tips, with low CL signal, broad low-intensity Raman bands and no Fano shape in the 0Γ band, thus have low active B concentrations up to ∼1018 cm−3. Family O tips, with intense CL signal and a sharper 0Γ band exhibiting the Fano effect in Raman spectra, have high active B concentrations of ∼1019–1020 cm−3.
IV. CONCLUSION
The B electrical activity, surface heterogeneity, local structure at the atomic level, and estimates of overall B concentrations of the different BDD tips were studied by employing a combination of characterization techniques including CL spectroscopy, CL mapping, and Raman microspectroscopy. The CL and Raman studies demonstrate that each tip family has significantly different active B concentrations. The lower CL signal, B environment, and atomic structure inferred from the Raman analysis indicate that the family S tips contain low levels of electrically active B and low overall B concentrations. Consequently, the rectifying electrical properties of indents into Au and glassy carbon can be understood in terms of low active B concentration and subsequent Schottky electrical contacts with metal-like substrates. The Ohmic-like electrical properties of the family O tips were the result of a much larger number of electrically active B and overall higher B concentrations. The high active B concentrations were identified from the intensity of the 520 nm CL band and a narrowing and shifting to lower wave numbers in the 0Γ Raman band. CL mapping showed that the surface of family O tips also contained inhomogeneities in the form of regions that were low in electrically active B concentration. Our study demonstrates that a priori knowledge of the B electrical activity and atomic structure, as well as the overall B concentration, is essential prior to any in situ electromechanical testing, if quantitative electrical data is required. Alternatively, other hard tips with uniformly high conductivity could be used.
ACKNOWLEDGMENTS
This research was supported by an Australian Research Council Linkage project. JB is the recipient of an Australian Research Council QEII Fellowship.