Introduction
Osteochondrosis (OC) belongs to those developmental disorders of the locomotory system frequently detected radiographically in young horses (Arnan and Hertsch, Reference Arnan and Hertsch2005; Stock et al., Reference Stock, Hamann and Distl2005a; Wittwer et al., Reference Wittwer, Hamann, Rosenberger and Distl2006). Articulations mainly affected are fetlock, hock and stifle joints. A disturbance in the process of enchondral ossification of growing cartilage of the growth plates (Van de Lest et al., Reference Van de Lest, Van den Hoogen, Van Weeren, Brouwers, Van Golde and Barneveld1999) leads to the signs of OC including subchondral bone cysts, wear lines, cartilage flaps, osseous fragments and synovitis (Trotter and McIlwraith, Reference Trotter and McIlwraith1981; Jeffcott and Henson, Reference Jeffcott and Henson1998). Osteochondrosis dissecans (OCD) is an advanced stage of OC, which is characterized by the presence of osteochondral fragments (joint mice, chips and corpora libera). Available epidemiological data indicate that OC is present in warmblood, coldblood, thoroughbred and trotter horse populations between 10% and 25% across a range of different breeds (Grøndahl and Dolvik, Reference Grøndahl and Dolvik1993; Philipsson et al., Reference Philipsson, Andreasson, Sandgren, Dalin and Carlsten1993; KWPN, 1994; Stock et al., Reference Stock, Hamann and Distl2005a; Wittwer et al., Reference Wittwer, Hamann, Rosenberger and Distl2006). Specific causes are still unknown but the origin of OC is multifactorial, including genetic factors, growth rate, body size, nutrition, mineral imbalance, endocrinological dysfunction and biomechanical trauma (Jeffcott, Reference Jeffcott1991; Van Weeren, Reference Van Weeren2005). The heritability estimates in animal threshold models were in the range from 0.10 to 0.34 for trotters, warmblood and coldblood horses for the prevalence of OC and these estimates corroborate the hereditary disposition to OC (Grøndahl and Dolvik, Reference Grøndahl and Dolvik1993; Philipsson et al., Reference Philipsson, Andreasson, Sandgren, Dalin and Carlsten1993; KWPN, 1994; Pieramati et al., Reference Pieramati, Pepe, Silvestrelli and Bolla2003; Schober, Reference Schober2003; Stock et al., Reference Stock, Hamann and Distl2005b; Wittwer et al., Reference Wittwer, Hamann, Rosenberger and Distl2007a).
Whole genome scans in Hanoverian warmblood and South German coldblood horses revealed quantitative trait loci (QTL) for OC (Dierks et al., Reference Dierks, Löhring, Lampe, Wittwer, Drögemüller and Distl2007; Wittwer et al., Reference Wittwer, Löhring, Drögemüller, Hamann, Rosenberger and Distl2007b). The traits analyzed were OC (fetlock and/or hock joints affected), OCD (fetlock and/or hock joints affected), fetlock OC, fetlock OCD, hock OC and hock OCD. In Hanoverian warmblood horses, chromosome-wide and genome-wide significant QTL for traits of OC and OCD were on ECA16. These QTL were located at 33 cM (COR011) for OC in fetlock and/or hock joints and OCD in fetlock and/or hock joints as well as at 0 to 3.0 cM (AHT037, TKY279), 33 to 59 cM (COR011, AHT038, TKY350, TKY871, LEX059 and LEX048) for hock OC and hock OCD and at 89 cM (TKY406) for hock OC. The marker coverage was at approximately 15 to 20 cM, which did not allow a clear delineation of the QTL.
Thus, the aim of this study was to refine the QTL on ECA16, especially between 33 and 59 cM as the markers in this region reached genome-wide significant test statistics. For that purpose non-parametric linkage and association analyses were performed using newly developed single nucleotide polymorphisms (SNPs) and microsatellites. The genes selected to design SNPs are, a major part, positional candidate genes and also two functional candidate genes that might be involved in the development of OC. For the development of new microsatellites, the horse genome assembly EquCab2 on ECA16 was searched for all variations of di-, tri- and tetra-repeat motifs with a minimum length of 15 repeats and a maximum length of 30 repeats. Those repeats which gave significant BLAST (Basic Local Alignment Search Tool) hits to the horse genome were taken into further investigation and employed for refinement of the QTL on ECA16.
Material and methods
Pedigree structure and phenotypic traits
From a large sample of Hanoverian warmblood horses including 629 radiographed foals, 168 stallions and more than 600 mares, 14 paternal half-sib families were chosen for genotyping due to their large family size and their high number of affected foals. The average size of the paternal half-sib groups was 7.4 ranging from three to 20. In total, 211 horses were genotyped including 104 foals, 99 of their mares and eight stallions. These horses were identical with the families used in the previous QTL study (Supplemental Table 1 published online). Diagnosis of OC was done following the recording and evaluation scheme developed for warmblood horses (Kroll et al., Reference Kroll, Hertsch and Höppner2001). The sagittal ridge of the 3rd metacarpal/metatarsal bone of fetlock joints, the intermediate ridge of the distal tibia, the lateral trochlea of the talus and the medial malleolus of the tibia were considered as predilection sites for OC. Signs consistent with OC were irregular bone trabeculation with variable radiolucency, irregular bone margin, new bone formation or osseous fragments when these changes were located at these predilection sites. Horses showing radiographic changes of OC with or without osseous fragments at the predilection sites of the fetlock and/or hock joints were classified as affected by OC and those horses exhibiting radiodense bodies as signs for osteochondral fragments at the above-mentioned predilection sites were treated as affected by OCD. Horses with pathological changes in fetlock or hock joints other than OC were not employed in our study. Animals without any signs of radiographic changes at all joints examined (fetlock, hock and stifle) were considered as free from OC, and only these horses were included as controls.
Development of microsatellites and single nucleotide polymorphisms
For the refinement of the QTL on ECA16, 34 new microsatellites (ABGe032 to ABGe058, ABGe092 to ABGe098) were developed. Therefore permutation sequences were built with all variations of di-, tri- and tetra-repeat motifs with a minimum length of 15 repeats and a maximum length of 30 repeats. These sequences were aligned with the horse genome assembly (NCBI, version EquCab2, 2008, http://www.ncbi.nlm.nih.gov/sites/entrez) using the SSAHA2 package (Sequence Search and Alignment by Hashing Algorithm combined with the cross-match sequence alignment program developed by Phil Green at the University of Washington, version 1.0.1, The Wellcome Trust Sanger Institute, UK, 2007). Alignment results that obtained a maximum score per length (100% identity) were selected for primer design. For this purpose, flanking sequences of these simple sequence repeats were extracted and investigated for their suitability for primer design. Equine PCR primers were designed using the Primer3 program (http://frodo.wi.mit.edu/cgi-bin/primer3/primer3_www.cgi) after masking repetitive elements with the RepeatMasker (http://www.repeatmasker.org/).
For SNP development, both whole genome shotgun sequences or equine expressed sequence tags (ESTs) which yielded significant BLAST hits to the syntenic region of ECA16 on HSA3 (http://www.ncbi.nlm.nih.gov/BLAST/) and the UCSC (University of California Santa Cruz) Horse genome browser (http://genome.ucsc.edu/cgi-bin/hgGateway?hgsid=120144566&clade=mammal&org=Horse&db=0) were used to choose functional and positional candidate genes for OC in the identified QTL region on ECA16. Equine PCR primers for SNP identification were designed using the Primer3 software after masking repetitive elements with the RepeatMasker.
Screening for SNPs was performed by comparative sequencing of genomic DNA from eight unrelated stallions, which sired eight of the 14 paternal progeny groups.
For verifying the marker positions on ECA16 on the horse genome assembly (EquCab2), the BLAST (BLASTall version 2.2.17) of NCBI was used.
Genotyping
For genotyping of microsatellites, 1.35 μg genomic DNA was isolated from 75 μl EDTA blood using the QIAamp® 96 Spin Blood Kit (Qiagen, Hilden, Germany). PCR reactions for genotyping of microsatellite markers were performed in 12-μl reaction volumes using 10 ng DNA, 1.2 μl 10× incubation buffer containing 15 mM MgCl2, 0.5 μl dimethyl sulfoxide, 0.15 μl each dNTP (100 μM each) and 0.5 U Taq polymerase (Qbiogene, Heidelberg, Germany). The primer amount ranged from 3.0 to 7.0 pmol. All forward primers were fluorescently labelled at the 5′ end with IRD700 or IRD800. To increase efficiency all primers were pooled in PCR multiplex groups of two to six markers according to their allele size and the fluorescence labelling. PCR amplification was carried out in PTC 100™ or PTC 200™ thermocyclers (MJ Research, Watertown, MA, USA) with the following standard program with variable annealing temperature (T a) between 58°C and 62°C: 94°C for 4 min, followed by 36 cycles at 94°C for 30 s, optimum T a for 1 min, 72°C for 30 s and finally storing at 4°C for 10 min. The PCR products were size-fractionated by gel electrophoresis on 6% polyacrylamide denaturing gels (Rotiphorese Gel40; Carl Roth, Karlsruhe, Germany) using an automated capillary sequencer (LI-COR 4200/S-2 and 4300; LI-COR, Lincoln, NE, USA). Prior to loading, PCR products were diluted with formamide loading buffer in ratios of 1 : 10, according to empirical values. Allele sizes were detected using an IRD700- and IRD800-fluorescence-labelled DNA ladder, and the genotyping data were analyzed by visual examination.
The PCR reactions for SNP genotyping were performed in a total volume of 30 μl containing 10 ng of genomic DNA as template, 10 pmol of each primer and 1 U Taq polymerase (Qbiogene). Thermocycling was carried out under the following conditions: initial denaturation at 94°C for 4 min was followed by 35 cycles of 94°C for 30 s, optimum T a for 1 min, 72°C for 1 min and a final cooling at 4°C for 10 min.
The amplicons for SNP development were sequenced on a MegaBACE 1000 (GE Healthcare, Freiburg, Germany) automated capillary sequencer. The sequencing reaction was carried out using the DYEnamic ET Terminator Cycle Sequencing kit (GE Healthcare). Amplification started with an initial denaturation at 94°C for 1.5 min, followed by 34 cycles of 20 s denaturing at 94°C, 15 s annealing at 50°C and 2 min elongation at 60°C. Finally, the reaction was cooled down to 4°C for 10 min. The reaction product was cleaned up using a Sephadex G50 filtration (GE Healthcare). Sequence data were analyzed using the Sequencher 4.7 program (GeneCodes, Ann Arbor, MI, USA).
Genotyping of the identified SNPs was performed via restriction fragment length polymorphisms (RFLPs) or, when no RFLP was available, using Custom TaqMan® SNP Genotyping Assays (Applied Biosystems, Darmstadt, Germany). For RFLPs, the amplification of the PCR products containing the SNPs was performed as described above for the development of SNPs. RFLPs were done in 20-μl reaction volumes using 2 μl buffer, possible 0.2 μl bovine serum albumin dependent on the used endonucleases and 1.5 U endonuclease with 15 μl of the PCR product. The marker genotypes were determined by gel electrophoresis using 2% agarose gels and evaluated by visual examination. The genotyping assays were analyzed on a 7300 Real Time PCR System (Applied Biosystems) in 12 μl volume using 5.3 μl SensiMix DNA kit (Quantance, London, UK), 0.3 μl Custom TaqMan® SNP Genotyping Assays (Applied Biosystems) and a DNA template of 10 ng. After 10 min initial denaturation at 95°C, 40 cycles of 15 s at 92°C and 60 s at 60°C were used.
Mendelian inheritance and correctness of marker transmission in the pedigrees genotyped was confirmed using the Pedstats software (Wigginton and Abecasis, Reference Wigginton and Abecasis2005).
Data analysis
Multipoint non-parametric linkage analysis (NPL) was performed using the Merlin software (multipoint engine for rapid likelihood inference, version 1.1.2) (Abecasis et al., Reference Abecasis, Cherny, Cookson and Cardon2002) and included 34 newly developed microsatellites, one published microsatellite, 15 SNPs and 21 microsatellites already used in the former whole genome scan (Supplemental Table 2 published online). The Zmean and LOD (logarithm (base 10) of odds) score test statistics were used to test for the proportion of alleles shared by affected individuals identical by descent for the considered marker loci (Whittemore and Halpern, Reference Whittemore and Halpern1994; Kruglyak et al., Reference Kruglyak, Daly, Reeve-Daly and Lander1996; Kong and Cox, Reference Kong and Cox1997). The maximum (minimum) achievable Zmeans were 6.65 (−2.16) for OC in hock joints and 5.78 (−1.63) for OCD in hock joints. The corresponding maximum (minimum) values for LOD scores were 3.87 (−0.37) and 2.56 (−0.25) indicating enough power to detect genome-wide significant linkage. Chromosome-wide error probabilities were obtained as described in Dierks et al. (Reference Dierks, Löhring, Lampe, Wittwer, Drögemüller and Distl2007). Genome-wide probabilities were calculated by applying a Bonferroni correction: P genome-wide = 1 − (1 − P chromosome-wide)1/r, where r = length of the respective equine chromosome in Mb, which is 87.4 Mb according to the horse genome assembly EquCab2.0, divided by the total equine genome length (2680 Mb).
In this study, six different phenotypes for OC were distinguished: (i) OC present in fetlock and/or hock joints, (ii) OCD present in fetlock and/or hock joints, (iii) OC present in fetlock joints, (iv) OCD present in fetlock joints, (v) OC present in hock joints and (vi) OCD present in hock joints. Controls were horses that did not have any signs of OC in any of the joints examined including fetlock, hock and stifle joints.
In addition, the genotypic data were evaluated using the ALLELE and CASECONTROL procedures of the software package SAS/Genetics (Statistical Analysis System, Version 9.2; SAS Institute, Cary, NC, USA, 2008) to determine the observed heterozygosity (HET), the polymorphism information content (PIC) and Hardy–Weinberg equilibrium, and to evaluate genotypic and allelic associations, haplotype association and the trend of the genotypes with the phenotypic OC traits using χ 2-tests.
Results
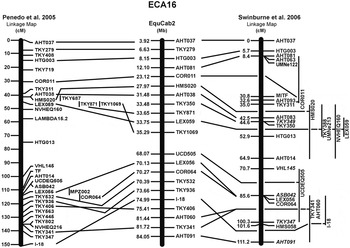
The former whole genome scan was performed with relative marker positions in cM taken from Swinburne et al. (Reference Swinburne, Boursnell, Hill, Pettitt, Allen, Chowdhary, Hasegawa, Kurosawa, Leeb, Mashima, Mickelson, Raudsepp, Tozaki and Binns2006) and Penedo et al. (Reference Penedo, Millon, Bernoco, Bailey, Binns, Cholewinski, Ellis, Flynn, Gralak, Guthrie, Hasegawa, Lindgren, Lyons, Roed, Swinburne and Tozaki2005). The release of the horse genome has made it possible to verify the QTL on the horse genome assembly (EquCab2) (Figure 1). Thus, the QTL of the previous whole genome scan on ECA16 were located at 23.12 Mb (COR011) for OC in fetlock and/or hock joints and OCD in fetlock and/or hock joints, at 3.92 to 6.63 Mb (AHT037, TKY279) and 23.12 to 54.20 Mb (COR011–LEX048) for hock OC and hock OCD and at 75.41 Mb (TKY406) for hock OC.
Comparison of the marker order on the horse genome assembly (EquCab2) in Mb with the linkage map reported by Penedo et al. (Reference Penedo, Millon, Bernoco, Bailey, Binns, Cholewinski, Ellis, Flynn, Gralak, Guthrie, Hasegawa, Lindgren, Lyons, Roed, Swinburne and Tozaki2005) and Swinburne et al. (Reference Swinburne, Boursnell, Hill, Pettitt, Allen, Chowdhary, Hasegawa, Kurosawa, Leeb, Mashima, Mickelson, Raudsepp, Tozaki and Binns2006) in cM. For the positions of the 34 newly developed microsatellites, see Supplemental Table 2.

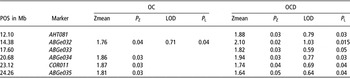
We identified 34 previously unknown microsatellites and 15 SNPs in the region from 0.49 to 52.38 Mb on ECA16. These markers were genotyped in 14 half-sib families with a total of 211 horses and then used for linkage and association analysis to refine the QTL in Hanoverian warmblood horses. The average PIC of the new microsatellites was 56.1% with a minimum of 17.4% and a maximum of 79.8%, while the mean observed HET was 62.2% ranging between 19.9% and 80.8%. The multipoint NPL showed chromosome-wide significant Zmeans and LOD scores at 14.38 Mb on ECA16 for OC in fetlock and/or hock joints and in the region from 12.10 to 24.26 Mb for OCD in fetlock and/or hock joints (Table 1).
Multipoint non-parametric chromosome-wide test statistics (Zmean and LOD (logarithm (base 10) of odds ratio) score) with their chromosome-wide significant error probabilities (P Z, P L) and their map positions (POS) on the horse genome assembly 2.0 for osteochondrosis (OC) and osteochondrosis dissecans (OCD) in fetlock and/or hock joints in Hanoverian warmblood horses

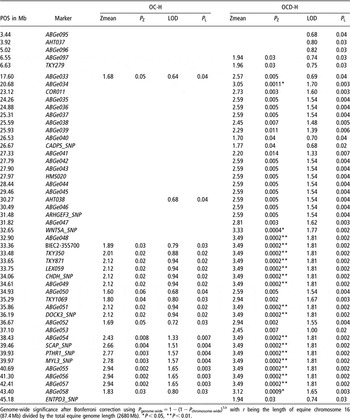
Chromosome-wide significant Zmeans and LOD scores could be detected for hock OCD in the region from 6.55 to 6.63 Mb and 17.60 to 45.18 Mb on ECA16 and in the region from 33.36 to 36.67 Mb and 38.43 to 43.40 Mb for hock OC (Table 2).
Multipoint non-parametric chromosome-wide test statistics (Zmean and LOD (logarithm (base 10) of odds ratio) score) with their chromosome-wide significant error probabilities (P Z, P L) and their map positions (POS) on the horse genome assembly 2.0 for hock osteochondrosis (OC-H) and hock osteochondrosis dissecans (OCD-H) in Hanoverian warmblood horses

Genome-wide significance after Bonferroni correction using P genome-wide = 1 − (1 − P chromosome-wide)1/r with r being the length of equine chromosome 16 (87.4 Mb) divided by the total equine genome length (2680 Mb). *P < 0.05, **P < 0.01.
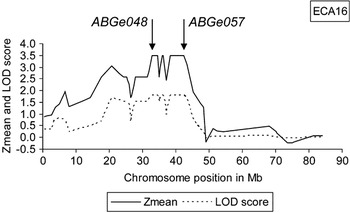
The highest Zmeans and LOD scores were 3.49 and 1.81 for hock OCD, with corresponding genome-wide error probabilities of 0.006 and 0.05 after Bonferroni correction for the regions between 32.90 and 34.61 Mb, between 35.86 and 36.19 Mb and between 38.43 and 42.41 Mb (Figure 2).
Zmeans and LOD (logarithm (base 10) of odds ratio) scores for 56 microsatellite markers and 15 single nucleotide polymorphisms on ECA16 harboring a quantitative trait locus for equine osteochondrosis dissecans in hock joints.

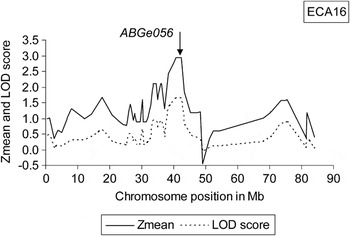
For hock OC, the highest Zmeans and LOD scores were 2.94 and 1.65 at 40.69 to 42.41 Mb with chromosome-wide error probabilities of 0.002 and 0.003 and genome-wide error probabilities of 0.06 and 0.09 (Figure 3).
Zmeans and LOD (logarithm (base 10) of odds ratio) scores for 56 microsatellite markers and 15 single nucleotide polymorphisms on ECA16 harboring a quantitative trait locus for equine osteochondrosis in hock joints.

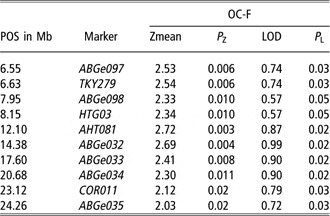
Furthermore, a chromosome-wide significant linkage with fetlock OC was evident for the region between 6.55 and 24.26 Mb. The highest Zmean was 2.72 at 12.10 Mb with a chromosome-wide error probability of 0.003 and the highest LOD score was 0.99 at 14.38 Mb with a chromosome-wide error probability of 0.02 (Table 3).
Multipoint non-parametric chromosome-wide test statistics (Zmean and LOD (logarithm (base 10) of odds ratio) score) with their chromosome-wide significant error probabilities (P Z, P L) and their map positions (POS) on the horse genome assembly 2.0 for fetlock osteochondrosis (OC-F) in Hanoverian warmblood horses

All results from the linkage analyses for all six traits of OC in fetlock and hock joints are given in Supplemental Tables 4 to 6 published online.
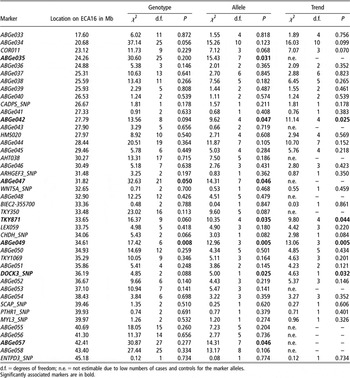
Association tests using the CASECONTROL procedure of SAS/Genetics revealed significant genotypic and/or allelic association with hock OCD in the QTL region on ECA16 at 24.26 Mb (ABGe035), 27.79 Mb (ABGe042), 31.82 Mb (ABGe047), 33.65 Mb (TKY871), 34.61 Mb (ABGe049), 36.19 Mb (DOCK3_SNP) and 42.41 Mb (ABGe057) (Table 4). The lowest error probabilities had the microsatellite ABGe049. The allele 162 of the microsatellite ABGe049 was associated with hock OCD, whereas the alleles 168 and 172 were significantly more frequently present in the horses free from signs of OC. Haplotype testing did also reveal significant associations for single haplotypes when adjacent pairs of the above mentioned markers (ABGe035, ABGe042, ABGe047, TKY871, ABGe049, DOCK3_SNP and ABGe057) were employed. All markers, associated with hock OCD, were in Hardy–Weinberg equilibrium. This result also confirms the QTL location in the region between 17.60 and 45.18 Mb.
Results of association analysis of microsatellites located in the quantitative trait loci for osteochondrosis dissecans in hock joints using χ 2-tests for genotypes, alleles and trend of alleles

d.f. = degrees of freedom; n.e. = not estimable due to low numbers of cases and controls for the marker alleles.
Significantly associated markers are in bold.
The SNPs in the CRTAP and the PTHR1 genes as potential functional candidate genes did not reveal significant associations.
Discussion
This study presents an important step towards the identification of genes responsible for equine OCD in hock joints in the QTL region on ECA16. The partial consistence of the QTL for hock OC and hock OCD leads to the assumption that the same genes may play a role in the development of this disease and that OCD is an aggravated form of OC. However, fetlock and hock joints seem to be influenced by different genes located on ECA16, as the hock QTL did not map at the fetlock QTL. The delimitation of the QTL using very dense microsatellite scans allows clarifying how many positional candidate genes have to be tested for linkage disequilibrium with OC and which of these candidate genes may be responsible for OC. In order to reach this goal and to develop a marker test for OC in Hanoverian warmblood horses, it is necessary to develop more SNPs in the QTL region for hock OCD. Significantly associated markers may indicate locations where SNPs in linkage disequilibrium may be found and where possible positional candidate genes may be located. For that purpose, it is possible to use the SNP Table from Broad Institute (http://www.broad.mit.edu/ftp/distribution/horse_snp_release/v2/) although it is not assured that the SNPs reported are detectable in the examined breed. Furthermore, it can be helpful to use the Equine Articular Cartilage cDNA Library to select candidate genes that are at least expressed in cartilage. At the moment a total of 13 964 equine articular ESTs can be found at the NCBI nucleotide database (http://www.ncbi.nlm.nih.gov/sites/entrez), from which ESTs located in 75 genes are in the QTL region between 17.60 and 45.18 Mb on ECA16. Near to the significantly associated microsatellite ABGe049 at 36.9 Mb, there are located several hyaluronoglucosaminidase genes, HYAL1, HYAL2 and HYAL3. These genes encode a lysosomal hyaluronidase (HYAL1) or a protein that is similar to hyaluronidases HYAL2 and HYAL3. Hyaluronidases intracellularly degrade hyaluronan, one of the major glycosaminoglycans of the extracellular matrix. Hyaluronan is an important integral structural component of articular cartilage and other tissues and acts as a lubricant in joints. It contributes to tissue hydrodynamics, movement, cell proliferation, migration and differentiation, and participates in a number of cell surface receptor interactions. Besides association of hyaluronidases with tumor suppression, mutations in the HYAL1 gene were found to be associated with mucopolysaccharidosis type IX, or hyaluronidase deficiency (Natowicz et al., Reference Natowicz, Short, Wang, Dickersin, Gebhardt, Rosenthal, Sims and Rosenberg1996; Triggs-Raine et al., Reference Triggs-Raine, Salo, Zhang, Wicklow and Natowicz1999). Due to their functions, these HYAL1, HYAL2 and HYAL3 genes seem to be suitable functional candidate genes for OC.
Acknowledgements
This study was supported by grants of the German Research Council, DFG, Bonn (DI 333/12-2).