
I. INTRODUCTION
Machine tool guideways are generally considered to be the integral parts of the table and bed castings. Reference Walter1 The wear of the components greatly governs the positioning of a machine system. Reference Nakano, Miyake, Korenaga, Sasaki and Ando2–Reference Panckow, Steffenhagen, Wegener, Dübner and Lierath5 Therefore, it is anticipated that machine tool precision can be improved through enhancing the tribological properties of guideways. Gray cast iron is commonly used in the machine tool guideways due to its low melting point, good damping property, low hardness, and low cost. Reference Campbell6,Reference Walter7 However, the wear of gray cast iron in lubricated conditions has been observed frequently in many of its applications. Reference Neville, Morina, Haque and Voong8–Reference Qu, Blau, Dai, Luo and Meyer, II10
Both theoretically and experimentally, laser processing has been used to improve the wear resistance of gray cast iron. Reference Benyounis, Fakron, Abboud, Olabi and Hashmi11 In most of the previous studies, Pin-on-disk wear-testing machine was used which exhibits some differences in guideway movement of bionic cast iron. Reference Sun, Shan, Zhou, Chen, Li, Xia and Ren12,Reference Zhou, Sun, Shan, Ma, Tong and Ren13 However, there are few studies on linear reciprocating wear motion of gray cast iron. Therefore, it becomes imperative to analyze the wear characteristics of materials on a dry sliding wear. Thus a home-made linear reciprocating wear testing machine was designed and manufactured to achieve the linear reciprocating sliding wear. This form of wear resembles to wear occurred in practical application. Reference Zhou, Sun, Shan, Ma, Tong and Ren13,Reference Chen, Lu, Song, Zhang, Yang and Zhou14
Over billions years of natural selection and evolution, biological structures gradually adapt to their living environment. Reference Zhang, Xu, Xuan, Wang and Tu15 The nacreous layer of a shell, a natural compound material, for example, possesses excellent mechanical properties. Nacreous layers are composed of 96% v/v of aragonite (hard) and 4% v/v protein (soft). The hardness of the nacreous layer is two times that of common aragonite. Due to the structure of soft and hard parts, nacreous layers are 1000 times tougher than plain aragonite. Kamat et al. Reference Kamat, Su and Ballarini16 studied the deformation and fracture of nacreous layers with bending resistance tests, and found that cracks were unable to penetrate the aragonite layer directly and caused deflection at the layer’s interface. In another study, Pederson et al. Reference Pederson, Ruberti and Messersmith17 demonstrated that material with the non smooth surface in accordance with the unique construction of shell structures showed superior mechanical behavior. With respect to the bionic principles, the pangolin surface was abstracted to a toughening structure with alternately soft and hard characteristic. Recently a bionic method was developed to improve the anti-wear property of parts’ surfaces Reference Hu, Han, Xu and Zhang18,Reference Wang, Zhang, Sun, Gao, Liang and Li19 using the cuticles of soil animals (such as dung beetles, black ants, and pangolins). The cuticles of soil animals caused excellent anti-wear properties against soil. Reference Ren20,Reference Wu, Phillips, Jiang, Sanders, Zabinski and Malshe21 Dubey and Yadava Reference Dubey and Yadava22 proved that laser treatment is an effective method of surface modification, characterized by high hardness, unaltered composition and other favorable properties. High energy beam remelting may further improve the properties of metallic compounds without seriously affecting the properties of the base material, as the maximum depth of the reinforced layer is only few millimeters. It is mentioned that laser remelting used in gray cast iron, Reference Blarasin, Corcoruto, Belmondo and Bacci23 nodular cast iron Reference Schaaf, Biehl, Gonser, Bamberger and Bauer24 and compacted graphite cast iron Reference Guo, Zhou, Wang, Zhang, Lin, Sun and Ren25 induces hard phases on the materials surface which improves the wear resistance. It is reported that the wear properties of bionic units are key to improve the materials’ wear resistance. Therefore the laser bionic process in water is thought to improve the performance of bionic units. Reference Guo, Zhou, Wang, Zhang, Lin, Sun and Ren25,Reference Zhou, Wang, Guo, Yu, Wang, Liao, Zhao and Ren26 However cracks appeared on the bionic units processed in water by laser influence on thermal crack propagation resistance. Reference Liu, Zhou, Su, Yang, Cheng, Zhang and Ren27,Reference Tong, Zhou, Liu and Dai28 Thus it is necessary to understand the influence of surface cracks in bionic samples on wear resistance.
Enlightened by the bionic method, we have attempted to improve the wear resistance of materials by modifying samples surface to imitate the surface structure of pangolin which exhibited excellent wear resistance at its life. To understand the influence of the surface crack of bionic sample processed in water by laser on sliding wear resistance, the sliding wear resistance of bionic sample with units processed in water by laser for different time is investigated in this work. To make a comparison bionic sample processed in air by laser is also studied. It is worth mentioning that bionic samples with alternate distribution units processed in water and air were prepared to prevent the stress concentration of the unit processed in water and to improve the unit’s function for protecting substrate. Moreover, it also can reduce the formation of large hard particles with sharp corners in substrate leading to the degradation of wear resistance.
II. MATERIALS AND EXPERIMENTAL METHODS
A. Materials
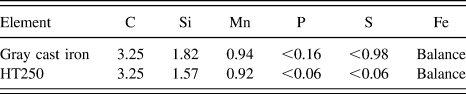
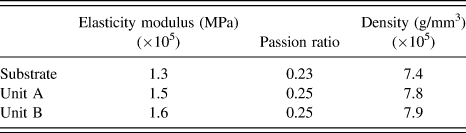
The substrate, gray cast iron was cut from the guide rail part of a lathe (which was supplied by Shenyang machine tool plant, China). The chemical composition of the gray cast iron is listed in Table I. The physical parameters used in numerical simulation obtained from Ref. Reference Chen, Zhou, Zhao, Zhang, Lu, Yang and Zhou29 are listed in Table II.
Chemical composition of gray cast iron and friction pair (wt%).

The physical parameters used in numerical simulation.

B. Sample preparation
The size of the samples used in wear test was 30 × 20 × 6 mm. All samples were cut from the guide rail part using an electric spark machine. Samples were ground using grit papers to avoid premature crack initiation from surface machining marks which might reduce the life of tools. Prior to wear test, samples were polished to remove all the surface irregularities and machine marks.
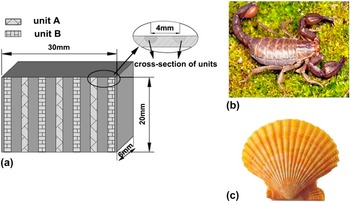
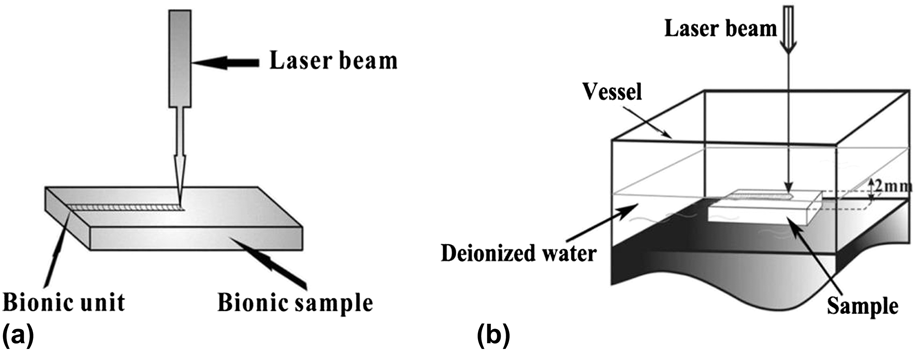
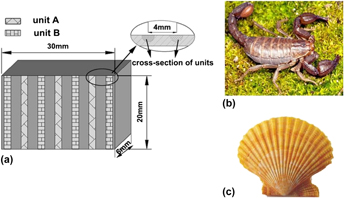
A solid state Nd-YAG laser with a wave length of 1.06 µm and maximum power of 300 W was used for processing the bionic units where parallel striations was applied on the samples’ surface by imitating the shape of an animal’s body surface. Reference Cong, Zhou, Ren, Zhang, Zhang, Meng and Wang30,Reference Meng, Zhou, Zhang, Tong, Cong, Wang and Ren31 The distance between two neighboring traces on biomimetic samples was 4 mm, as shown in Fig. 1(a). Biological archetypes used in this study were desert scorpions (which exhibit excellent antierosion function under gas/solid mixed media environment) [Fig. 1(b)] and shell (which can withstand the wear of sand) [Fig. 1(c)]. Figure 2 displays a schematic of the laser surface melting apparatus. Air and de-ionized water were used as the processing medium. Following laser processing parameters were applied: current of 180 A; pulse width of 6 ms; frequency of 7 Hz; laser energy of 12.6 J. In addition, argon was used as shielding gas with constant flow rate of 10 L/min. The bionic unit processed in air by laser was named unit A herein. During the processing, the samples were placed in water containing glass flume where 2 mm distance between water surface and the samples was kept. Thereafter laser beam scanned the samples. Here, laser processed region called unit B is shown in Fig. 2. To describe the experimental results, the bionic sample No. 1 was consisted of single unit A while bionic sample No. 2 was assembled completely by unit B. On the other hand, bionic sample No. 3 was composed of an alternative mixture of unit A and unit B. Prior to wear experiment, the surface of each biomimetic sample was ground using sand papers for fixing the roughness requirement. Here the structural features of unique biological surface with alternative soft-hard phase were imitated to understand the effect of the bionic structure on its wear resistance. Thus the surface processing traces were removed beforehand to better observe the wear trace.
Biological archetypes of the specimens: (a) bionic sample with various units; (b) desert scorpion archetype with stripy Sclerite cuticle; (c) shell archetype with stripy ribs.

A simulation diagram of bionic units processed in different medium: (a) unit A processed in air; (b) unit B processed in water.

C. Experimental methods
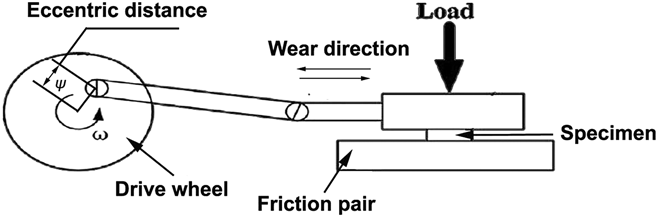
A home-made linear reciprocating wear testing machine was used for wear test. A schematic showing the home-made linear reciprocating wear testing machine is shown in Fig. 3. The eccentric wheel was put in motion along with the rotation of gear reducer by electromotor. This arrangement makes the moving part to move easily on straight line reciprocating movement along with the connecting rod, and the load is located at the top of the moving part. The speed of the wear test was controlled using a frequency converter, which was connected to the electromotor. The pressure of the wear test was adjusted by adding or subtracting load. Frictional pair in wear test was HT250 which was manufactured by high-frequency induction quenching. The chemical compositions in weight percentage of HT250 are also given in Table I. Micro-hardness of HT250 is measured to be 780–820 HV by Vickers microhardness tester (Model 5104, Buehler Co. Ltd., Chicago, Illinois). Wear tests were carried out at room temperature. A normal load of 60 N was used for the wear tests. The rotational speed of the electrical machine was used to be 690 rpm. Samples were ultrasonically cleaned in anhydrous alcohol and dried before and after the wear tests. An electronic balance (FA2004, Shanghai Sunny Hengping, Shanghai, China) with the accuracy of ±0.0001 g was used to measure the mass of the samples before and after each wear test, so as to calculate the mass loss. Reference Pang, Zhou, Xie, Cong, Meng and Ren32 During wear tests, samples were periodically interrupted for mass loss measurement every 20 h until 120 h. Mass loss and mass loss rate were measured to evaluate the durability of wear resistance and to find out wear mechanisms. An optical microscope (Axio Imager A2m, Carl Zeiss AG, Oberkochen, Germany) was used to investigate the morphology of worn damaged surface and to observe the cross-section of the bionic coupling units. The value of mass loss for each sample was determined as an average of three repeated tests.
Working principle of the homemade linear reciprocating wear testing machine.

A scanning electron microscope (Zeiss, Evo 18, Germany) with 18.31 mm working distance and 25 kV operating voltage and an x-ray diffraction (D/Max, 2500 PC, Japan) with Cu Kα radiation at a voltage of 50 kV, a current of 300 mA, and a scanning rate of 4°/min were used to characterize the microstructure and to identify the phases present in the units and base metal.
In addition, to understand the stress distributions and the wear mechanism of the samples, finite element method (FEM) was used in this study on the basis of the sample which was composed of an alternative mixture of unit A and unit B. In the Finite element modeling, the model consists of bionic unit and base material with different materials having different properties was used. Prior to meshing, two volumes were glued using Booleans.
III. RESULTS AND DISCUSSION
A. Shape and cracks of biomimetic units
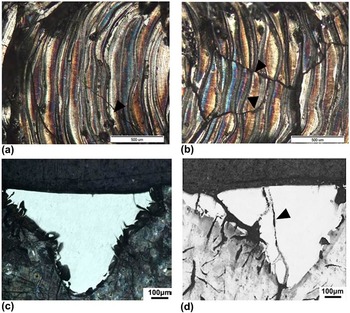
The initial microstructure of gray cast iron used in the present study is consisted of flake graphite (G) surrounded by ferrite (F) with some pearlite (P) (Fig. 4). After laser processing, the modified layers called biomimetic units (unit A and unit B) were obtained, which were processed in air and water, respectively. Figure 5 shows the effect of processing medium on surface cracks of biomimetic units’. The surface topography of the bionic unit A and B is shown in Figs. 5(a) and 5(b) respectively. More cracks are appeared in unit B than in unit A. It is clear that surface longitudinal crack in unit B are deeper than in unit A which reaches even at the bottom of the molten pool [Figs. 5(c) and 5(d)]. This can be attributed to the higher stress developed in unit B as a result of rapid solidification during water cooling.
Microstructure of gray cast iron (P represents pearlite and G denotes graphite flake).

Surface and cross-section of bionic units: (a) surface of bionic unit A; (b) surface of bionic unit B; (c) cross-section of bionic unit A; (d) cross-section of bionic unit B. Black arrows in the microstructures indicate cracks.

B. Microstructures and micro-hardness of biomimetic units
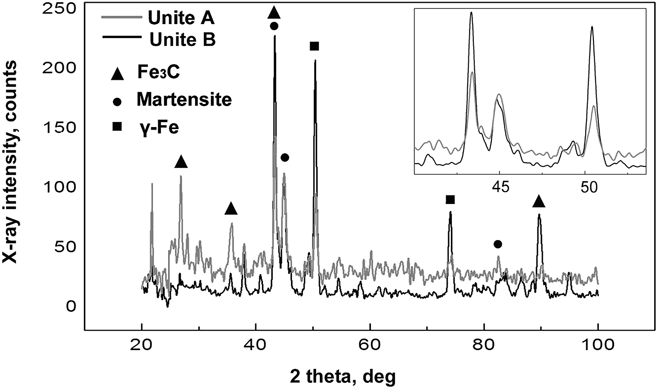
Figure 6 shows SEM micrographs of the biomimetic units processed by laser beam in the medium of air and water, respectively. It is clear that in addition to intrinsic ferrite (α-Fe), there are martensite, austenite (γ-Fe) and Fe3C in the microstructures. Microstructure of unit B processed by laser in water is found to be more refined than its counterpart and it contains non-equilibrium phases and precipitates. In addition, the new phases transform from vermicular graphite and pearlite structure to typical ledeburite structures, i.e., dendritic cementite and austenitic networks (M + A + Fe3C). Cementite dendrites are characterized by main arms and secondary arms, as shown in Figs. 6(b) and 6(d). From XRD results, it can be seen that new phases of gray cast iron formed in bionic units during laser processing. In addition, similar phases appeared in unit A and unit B (the bionic units processed in air and water by laser), while the broadening of the main peaks of unit B is due to the refinement of microstructure (Fig. 7) and the higher magnitude of γ-Fe and Fe3C. Diffraction peaks corresponding to martensite indicate its content which is of particular importance for wear resistance. In addition, the spacing of the main dendrites in unit B (processed in water by laser) decreases which indicates that a higher cooling rate was used during solidification. The higher cooling rate causes the transformation from liquid austenite to crystallite austenite as primary dendrites. The last liquid will be enriched in carbon and form a eutectic of austenite and cementite.
Microstructure of bionic units: (a) bionic unit A and (b) enlarged view of (a) showing A: austenite and Fe3C (c) bionic unit B and (d) enlarged view of (b) showing martensite (M), austenite (A) and Fe3C.

X-ray diffraction of bionic units: (gray) bionic unit A; (black) bionic unit B.

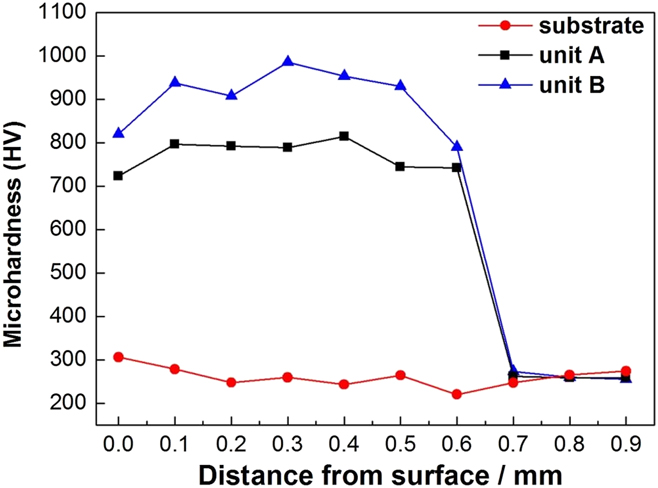
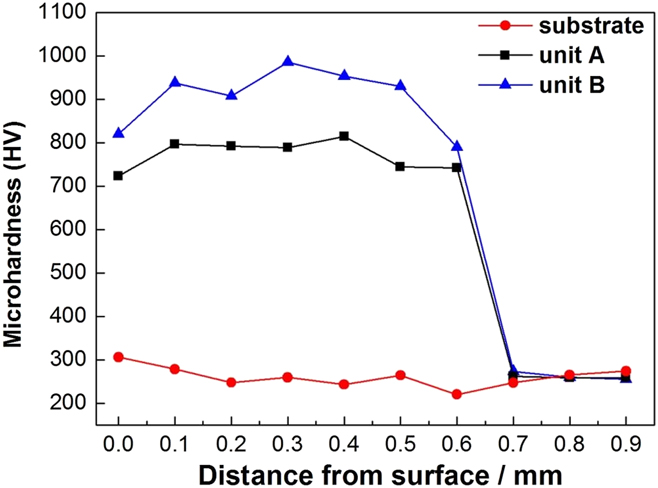
Micro-hardness is considered to be an indicator of coating integrity and wear resistance. Reference Pawlowski33 Figure 8 shows the micro-hardness profiles of biomimetic units processed by laser in air and in water along the distance from their surface. It is clear that a typical plateau from molten pool surface to 0.55–0.6 mm is visible for both units A and B followed by a sharp decrease to reach the level of substrate. The micro-hardness of unit B (which processed by laser in water, 904 HV) is considerably harder than that of unit A (which processed by laser in air, 772 HV) and the substrate (261 HV). The presence of hard phases such as martensite and carbides and ultra-fine microstructures of unit B are the reasons for showing highest micro-hardness.
Average microhardness of the cross section of bionic units and substrate.
C. Wear tests
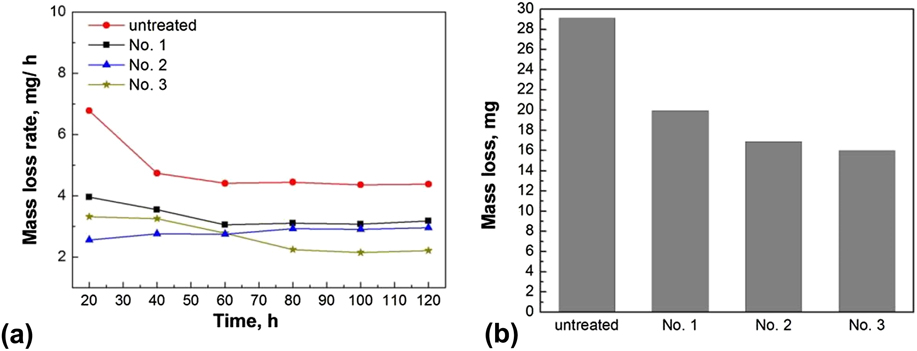
Figure 9(a) shows mass loss measurement at the regular intervals of 20 h. It is evident that bionic samples (No. 1, No. 2, and No. 3) displays better wear resistance than untreated samples. Further, No. 2 sample displayed maximum mass loss rate performance for first 60 h which is 48% less than the untreated conditions. During first 60 h, the wear resistance of No. 1 sample and No. 3 sample decreased by 33% and 40% respectively than the untreated sample. However, the mass loss rate of bionic samples was unstable for first 80 h and then it enters into a relatively steady period. Initially, the substrate suffered serious wear due to its lower hardness and the units experienced lower wear due to their higher hardness. Therefore it can be assumed that most of the debris is produced from substrate at this stage. It is worth noting that the mass loss rate of No. 2 sample is found to be stable over the time. Lowest mass loss rate at 2.22 mg/20 h is recorded for No. 3 during steady period. In contrast, mass loss rate of No. 1 and No. 2 is measured to be 3.08 mg/20 h and 2.91 mg/20 h respectively. Figure 8(b) shows the total mass loss of samples which can be arranged as No. 1 > No. 2 > No. 3. Therefore, it can be concluded that the samples with mix mode (of unit A and unit B) with alternative distribution effectively improve the mass loss rate than the single unit distribution.
Wear results of samples: (a) mass loss rate of samples as a function of time; (b) total mass loss of samples in 120 h.
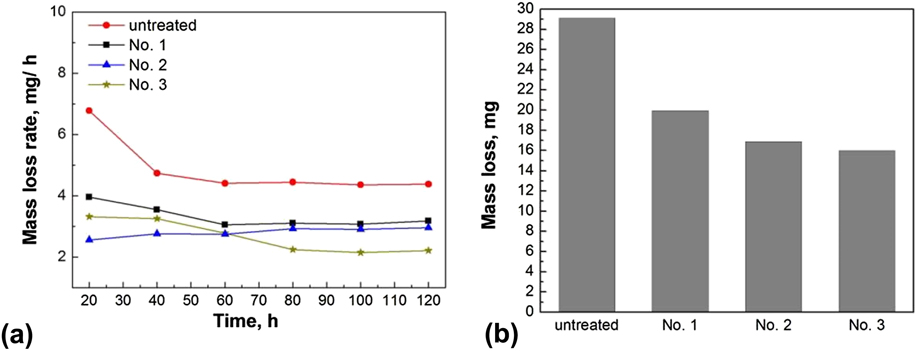
In addition, due to the higher micro-hardness of unit B, the wear resistance of No. 2 sample (with unit B) always is higher than No. 1 sample (with unit A), even much higher than No. 3 sample (mix mode of unit A and unit B) for first 60 h. However, the cracks on unit B is harmful for wear life. It results in the performance degradation at steady state.
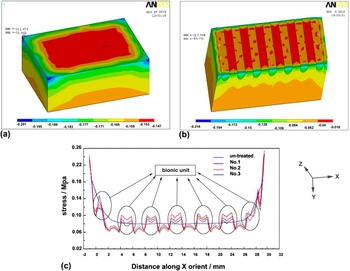
Figure 10 represents the finite element analysis of bionic units under experimental conditions which could explain the phenomenon. In this study, a nonlinear area–area contact was performed by ANSYS 12.0 to analyze the component of the Z-equivalent of stress of the surface of bionic units and base material. The analyses belong to an X orientation force analysis. The model imitated the real samples consisting of base material and modified material, and the size equals to the real sample (20 × 30 × 6 mm3) [as shown in Figs. 10(a) and 10(b)]. The materials properties are given in Table II. To satisfy the demands of accuracy and calculation stability, the substrate and bionic unit were glued before meshing. The smart meshing size was 0.2 mm. In addition, there were two steps. At the loading step, the bottom of friction pair was given constraint at X, Y, Z direction, all round faces of the model were given constraint at X and Y direction. And the bottom of the model was defined by loads (60 N) at Z direction to make contact areas gluing. At the second step, the constraints of all round faces of model were modified as Y and Z displacement. And a displacement constraint is set at X direction to make the model sliding on the friction pair. At last, Z-component of stress along X orientation were obtained when the model moves to middle of friction pair [as shown in Fig. 10 (c)]. Here most representative, X orientation along the center of the sample has been chosen to show stress of the samples. Stress of untreated sample and bionic samples (No. 1, No. 2 and No. 3) along X orientation of Figs. 10(a) and 10(b) is shown in Fig. 10(c). Compared with untreated one, all bionic samples show a reduction in stress on substrate, especially sample No. 2 (with unit B). It could be proven that bionic treatment can decrease the amount of stress on the substrate surface. Although it can also be seen that stress distribution on bionic unit region was higher than substrate region in the major zone of treated sample and the unit region of No. 2 sample suffered correspondingly highest stress compared to other two treated samples. However, units of all treated samples experienced slightly less scratch than that of substrate, especially the unit B of No. 2 (Fig. 11). As a result, it can be assumed that the substrate suffered serious wear due to its lower hardness and the presence of graphite, and the units experienced less wear attributing to their higher hardness and the absence of graphite.
Z-component of stress along X orientation on the surface of middle of samples: (a) stress distribution on untreated sample; (b) stress distribution on treated sample (No. 3) with unit A and unit B; (c) stress value along X orientation of untreated sample and treated samples (No. 1, No. 2 and No. 3).

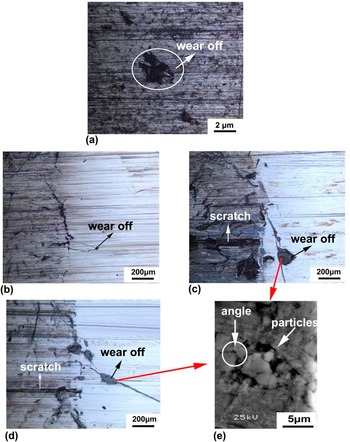
(a) Untreated sample (b) No. 1 sample with unit A; (c) No. 2 sample with unit B; (d) No. 3 sample with various units; (e) hole in unit B.

Compared with the worm surfaces of bionic samples [Figs. 11(b)–11(d)], untreated gray cast iron surface shows relatively uniform scratch with bigger and more pitting resulting from the wear by the friction pair [Fig. 11(a)]. The presence of the graphite in the matrix of gray cast iron may cause such wear in the form pitting. Since graphite displays poor mechanical properties, wear easily happened in surrounding of graphite and holes form. On the other hand, the wear properties of bionic samples are supposed to improve as the microstructure of bionic units processed by laser does not possess any graphite.
Figures 11(b)–11(d) shows the worn surface of bionic samples. The scars on the worn surface of No. 1 sample [Fig. 11(b)] are relatively smaller and uniform than that of No. 2 or No. 3. As shown in Fig. 11(c), most scratches in No. 2 are wider than that in No. 1. The reason can be speculated from the worn surface of bionic unit region. There are not only tiny scratches, but also cracks on the unit surfaces. In addition, obvious holes appeared at the junction of the cracks. And larger and harder particles with angles were found in the holes [Fig. 11(e)]. Moreover, larger holes in unit could cause wider scratches on substrate. Therefore, it can be speculated that the particles worn off from the holes make a wider scratches on the substrate. These particles damage No. 2 and substrate. Figure 11(d) shows the wear morphology of the boundary between unit B and substrate of sample No. 3. Scratches on the substrates are found to be smaller than that of No. 2. Further, unit B on sample No. 3 shows better wear resistance than unit A on No. 1. Furthermore, No. 3 displays maximum wear resistance performance than No. 1 and No. 2. It may be because of its unique wear mechanism and stress distribution.
D. Wear process and mechanism
Hardness and ultra-fine microstructures of units indicate that wear would be difficult under dry sliding wear condition. From a macro perspective, bionic units and substrate initially remain in the same plane and contact with the friction pair simultaneously. As the wear and tear continues, the wear of substrate is deemed to be more than the units as units possess finer microstructure and higher micro-hardness than substrate. So, the units will prop up the friction pair to protect the substrate from wear and tear in the next stage. This process will last for a long time due to the better wear resistance of bionic units. It is believed that the wear between units and friction pair is important for determining the whole wear process. Therefore it can be inferred that the wear resistance depends on the performance of units. Consequently, No. 2 and No. 3 samples with unit B processed by laser in water show a remarkable wear resistance than No. 1 sample having unit A processed by laser in air. High wear resistance of No. 2 sample consisting of unit B can be attributed to the effect of grain refinement, increased hardness and reinforced phases (martensite and carbides). However, fracture occurs and gradually propagates after a long reciprocating sliding wear. This is due to the stress concentration in the cracks on the surface of unit B. Carroll and Beynon Reference Carroll and Beynon34 investigated the fatigue behaviors of rail steel, and revealed that the maximum pressure occurs at the surface, while the maximum shear stress is observed in the subsurface. Thereby, the nonuniform elastic deformation will emerge as the elastic deformation produces cracks in substrate (which has graphite) and bionic unit with cracks. According to the Paris’ law, for crack propagation, the driving force is incurred by the accumulation of micro-strain caused by cyclic stress–strain, from both shear and axial direction. Reference Pugno, Ciavarella, Cornetti and Carpinteri35 The Paris law gives the advancement da of fatigue crack per unit cycle dN, Paris’ law can be seen as follows:
 $$v\alpha = {{{\rm{d}}\alpha } \mathord{\left/ {\vphantom {{{\rm{d}}\alpha } {{\rm{d}}N}}} \right. \kern-\nulldelimiterspace} {{\rm{d}}N}} = C\Delta Km = f\Delta \sigma \sqrt {\pi \alpha }$$
vα is the rate of crack advance per cycle which is expressed as a function of the amplitude of stress intensity factor (ΔK). C and m are the Paris’ constants. f is the function of crack size, α is the size of crack, and Δσ is the stress range at crack.
The produced cracks at the tip will propagate after thousands of cycles to accumulate plastic deformation during linear reciprocating wear testing. Furthermore, as the sliding continues, wear particles were easily embedded into cracks to repeat plastic deformation on different level of interface. However, bionic units with few cracks could decrease the accumulation of plastic deformation. More energy is required for crack propagation in the unit zone owing to the burned down or dissolved graphite and a compact eutectoid in it. Furthermore, as the sliding continues, adjacent cracks on bionic unit B connected together to falling-off irregular shaped particles with angles and higher micro-hardness. This seems to be a principal reason for forming crater on the surface. In addition, the falling-off of bulk particles from unit B would be harmful for the wear resistance of substrate, owing to its higher micro-hardness and hard angles Reference Pugno, Ciavarella, Cornetti and Carpinteri35,Reference Jiang, Stott and Stack36 [Fig. 11(e)].
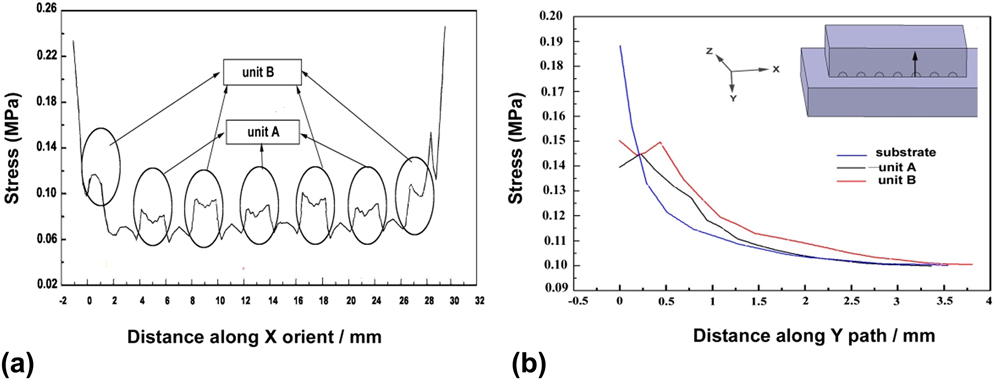
No. 3 sample with unit A and unit B showed a more stable and longer wear resistance among the samples examined. This can be attributed to the replacement of part of unit B by unit A which carried part of the load. Figure 12 shows the Z-component of stress on No. 3 sample along X and Y orientation. From Fig. 12(a), it can be seen that the stress distribution of unit A, unit B, and substrate on No. 3 sample was different during the sliding wear process. Unit B suffered most stress and substrate suffered the least stress than mixed bionic units (unit A and unit B). Moreover, it can be seen that the highest magnitude of stress on bionic units (unit A and unit B) and substrate distributed in different depth from Fig. 12(b) which presented Z-component of stress on No. 3 sample along Y orientation. And the stress concentrated on bionic unit B of No. 3 under vary bionic units’ distribution in depth alternately will be weaker than that of No. 2 [Fig. 10(c)]. Meanwhile, it also could reduce the stress concentration on the cracks of unit B and improve the unit B function by protecting substrate using the vary units (unit A and unit B) with alternative distributions.
Z-component of stress of No. 3 sample: (a) along X orientation; (b) along Y orientation (indicated by the arrow).

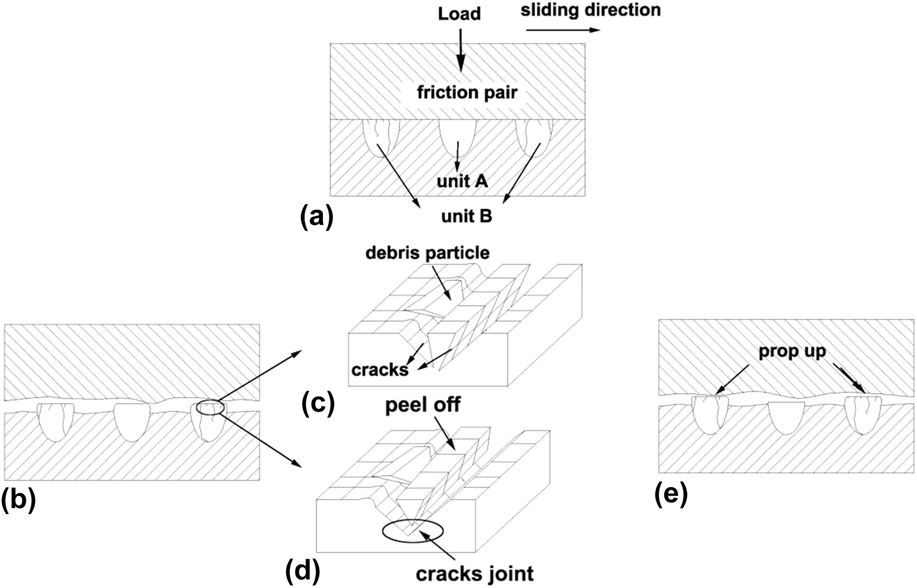
Figure 13 schematically shows the wear stages of sample No. 3. Two wear stages of the surface of sample No. 3 with different units are observed. In the first stage, when wear commences, soft substrate easily wears away and loses mass quickly. However, hard units (unit A and unit B) lose less mass and withstand wear as units and substrates are in the same plane [Fig. 13(a)]. As shown in Fig. 13(b), friction pair is only supported by the units. In the second stage, only units bear the abrasion and unit A will be consumed away first as unit B shows finer microstructure with highest micro-hardness and maximum wear resistance than unit A and substrate. Thereafter, unit B will be propped up as shown in Fig. 13(e). In this stage, the wear rate between unit B and friction pair is far smaller than that in between substrate and friction pair or between unit A and friction pair due to higher hardness and smaller contact area of friction pair. As sliding continues, the cracks in unit B propagate and heavily deformed wear debris particles would produce [Figs. 13(c) and 13(d)]. This makes the material of unit B falls off until the surfaces of unit A and unit B are in the same plane. The cycle of unit A and unit B repeats until different bionic units (unit A and unit B) and substrate are in the same plane again. These two stages will be repeated in the entire cycle until the bionic units are worn out.
Schematic of wear process on the surface of sample No. 3.

IV. CONCLUSIONS
-
(1) Compared with the untreated sample, bionic coupling samples processed by laser re-melting showed improved wear resistance. Bionic sample with single units processed by laser in water displayed maximum wear resistance in the short run. In addition, bionic sample with different units processed by laser in different media showed maximum wear resistance in the long run.
-
(2) Bionic unit B (processed by laser in water) displayed refined microstructure and harder micro-hardness, while cracks on bionic unit B produced due to the rapid cooling during laser processing in water. It negatively affects wear resistance in the long run.
-
(3) Bio-inspired wear surfaces with alternative units (unit A and unit B) showed maximum wear resistance as a result of two stages wear mechanism. Firstly particles from substrate and unit A peel off to form a stronger protective layer. In the long run, it will directly prevent damage of substrate surface from the large grinding grain with sharp corners from unit B.
ACKNOWLEDGMENT
This article was supported by Project 985–High Performance Materials of Jilin University and the Project 985–Bionic Engineering Science and Technology In novation and National Natural Science Foundation of China (No. 51275200).