

Introduction
History of Psychological Measurement
Assessment and, therefore, measurement of human capacity are known to have occurred in the Civil Service in China as early as 3000–2000BC (Anastasi & Urbina, Reference Anastasi and Urbina1997; Bondy, Reference Bondy1974). Psychiatry in the 19th century attempted to categorise and find commonalities among different mental problems, in the broadest sense. From this, the search for and classification of inter-individual differences arose which constitutes the basis of ‘contemporary testing’ (Anastasi & Urbina, Reference Anastasi and Urbina1997, p. 33). The measurement of all kinds of phenomena of human experience is now commonly labelled ‘psychometrics’. More specifically, ‘ . . . all assessments share a common set of fundamental characteristics – they should be reliable, valid, standardised and free from bias. There are good assessments and bad assessments, and there is a science of how to maximise the quality of assessment. That science is psychometrics’. (Rust & Golombok, Reference Rust and Golombok2009, p. 5). (For a discussion of terminology concerning ‘psychometric’ versus ‘clinimetrics’ (see de Vet, Terwee, & Bouter, Reference de Vet, Terwee and Bouter2003; Streiner, Reference Streiner2003a, Reference Streiner2003b).)
Some of the earliest examples of psychometric testing are related to early definitions and attempts at measuring intelligence by researchers, such as Cattell, Binet, Thurstone and Thorndike. Woodworth's Personal Data Sheet and its precursor, assessing Psychoneurotic Tendencies, devised during World War I to assess shell shock, is often considered the first assessment of inter-individual differences of personality (Gibby & Zickar, Reference Gibby and Zickar2008).
Since then the field of psychometrics has expanded exponentially, both in terms of characteristics, abilities or attributes that are assessed, as well as the methods employed to conduct the assessment. Standardised testing is regularly undertaken to categorise, diagnose, select, evaluate, predict and compare. However, in contrast to the fairly stable characteristics of, for example, biomarkers in medicine used to measure physiological indicators of disease, the assessment of internal experience or individual ability, whether by observation, self-report or some other way of data collection, is by nature a lot more prone to be influenced by components other than the characteristic of interest, and thence to ‘error’ in measurement (in the statistical sense).
There are numerous causes of threats to validity and reliability of measurement, and the use of conceptual and methodological frameworks may guide the development of instruments and the assessment of reliable and valid measurement across different populations and measurement purposes (Guyatt, Kirshner, & Jaeschke, Reference Guyatt, Kirshner and Jaeschke1992; Kirshner & Guyatt, Reference Kirshner and Guyatt1985).
Gyuatt and colleagues (Guyatt et al., Reference Guyatt, Kirshner and Jaeschke1992; Kirshner & Guyatt, Reference Kirshner and Guyatt1985) proposed a framework describing different purposes for which questionnaires may be used, which can be predictive, discriminative and/or evaluative. The first, prediction, is useful for screening and diagnostic purposes, wherein the measure predicts a specified target outcome. Discrimination is important in instruments that will be used to distinguish among individuals or groups. Finally, evaluation refers to the assessment of longitudinal change, where the instrument needs to be sufficiently sensitive to real change, either due to naturally occurring changes, or due to an intervention. Each of these purposes place distinct requirements on the questionnaire in terms of number of items and content coverage (the way in which a construct is covered by the items), phrasing of item content, as well as response options. For more detail see Guyatt et al. (Reference Guyatt, Kirshner and Jaeschke1992).
These purposes also require different foci when it comes to the assessment of psychometric properties: depending on the purpose of measurement, the aspects of reliability and validity may be of greater or lesser relevance. For example, a questionnaire developed with the intention to assess treatment outcomes should be shown to have high test–retest reliability, i.e., evidence that scores are stable over a specified time period while no change in the state/trait/condition occurs (i.e., no treatment). Further to this, evidence that the measure is sensitive (responsive) to change once change does occur (i.e., during or after treatment) is needed. In contrast, a questionnaire intended to measure individual or group differences requires evidence for test–retest stability, but evidence for responsiveness is probably not as relevant.
With one or multiple clear measurement purposes established, the researcher can start with the development of construct definition and item/content development. The process of item generation is complex and textbooks specifically devoted to scale construction may need to be consulted. Following scale construction, the evaluation process can also be guided by a framework, such as those delineated in de Vet, Terwee, Mokkink, and Knol (Reference de Vet, Terwee, Mokkink and Knol2011a); Frost, Reeve, Liepa, Stauffer, and Hays (Reference Frost, Reeve, Liepa, Stauffer and Hays2007); and Streiner, Norman, and Cairney (Reference Streiner, Norman and Cairney2015a). Table 1 lists some of the questions that a researcher needs to consider in developing a questionnaire and subsequently report what they have done in their communication with the scientific community.
Examples of Questions Relevant/Pertinent to Instrument Development

Once clarity is gained on the topics outlined above, a suitable technique for statistical analyses of the psychometric properties of the instrument should be selected, including decisions about whether some of the statistical analyses will be based on Classical Test Theory (CTT) or Item Response Theory (IRT),Footnote 1 any data manipulation, such as missing value imputation or rotation, as well as any benchmarks or cut-off points applied in model testing (CTT or IRT). Further, the previously mentioned framework may have provided an indication of those psychometric properties that are most pertinent to the specific instrument and should thus be investigated as a priority.
We focus here on the requirements for testing of reliability and validity that are relevant to questionnaire-based assessment. Other types of instruments, such as ability testing, have similar requirements for the evaluation of reliability and validity, but the specifics exceed the scope of this discussion. The aims of the paper are therefore, (i) to briefly describe the most frequently assessed measurement properties, (ii) to present available tools for the critical appraisal of publications on psychometric properties with regard to their respective focus on reporting, design and/or statistical outcomes, and (iii) to provide a worked example of how to evaluate the measurement properties of a questionnaire with currently available tools.
Aim 1: Frequently Assessed Psychometric Properties: Reliability, Validity and Responsiveness
One of the many challenges in the field is that definitions of measurement properties are used inconsistently or synonymously. Similarly, standards for statistical outcome criteria are often fairly subjective and a wide variety of standards is applied (Mokkink et al., Reference Mokkink, Terwee, Stratford, Alonso, Patrick, Riphagen and De Vet2009).We largely follow the expert consensus-based taxonomy and definitions outlined by the COSMIN project (COnsensus-based Standards for the selection of health status Measurement INstruments; Mokkink et al., Reference Mokkink, Terwee, Patrick, Alonso, Stratford, Knol and de Vet2010b) in the description of psychometric properties: reliability, validity and responsiveness.
Reliability
Assessment of reliability attempts to establish whether a measure produces the same outcome consistently, either across time (test–retest; intra-rater reliability), across assessors (inter-rater reliability) or across closely related items (internal consistency). Ideally, all types of reliability should be very high. But there are some caveats. Depending on the instrument and its measurement purpose, some properties may be more relevant than others: some internal experience constructs (e.g., mood) by their nature may not be stable over time, and particular types of instruments (e.g., self-report) are not amenable to inter-rater reliability. There is also criticism about how internal consistency is commonly assessed (Dunn, Baguley, & Brunsden, Reference Dunn, Baguley and Brunsden2014; Revelle & Zinbarg, Reference Revelle and Zinbarg2009).
Validity
Investigations into validity refer to whether an instrument measures what it purports to measure. The broad concept of validity encompasses several subcomponents that each cover additional facets of validity: content validity, including face validity; construct validity, including structural validity; cross-cultural validity; convergent, discriminant and divergent validity (all three of which are subsumed under ‘hypothesis-testing’ in the COSMIN framework); and criterion validity, including concurrent and predictive validity.
Structural validity refers to the dimensionality of a questionnaire. CTT offers exploratory and confirmatory factor analytic techniques. Principal axis factoring and principal component analysis are the most commonly employed exploratory techniques. Confirmatory factor analysis requires a hypothesis driven approach based on a theoretical model, and model fit is tested statistically. Common issues include factor retention (Hayton, Allen, & Scarpello, Reference Hayton, Allen and Scarpello2004) and minimum sample sizes (MacCallum, Widaman, Zhang, & Hong, Reference MacCallum, Widaman, Zhang and Hong1999). IRT approaches towards structural validity are, in essence, mathematical extensions of CTT models, but are computationally more complex and have a stronger theoretical focus on testing model assumptions. There is a great variety of IRT-based methods to investigate structural validity and the paper by Kean and colleagues in this special issue considers IRT in detail.
Responsiveness
This psychometric property is especially relevant for evaluative questionnaires. Responsiveness refers to change in scores over time, and specifically, the extent to which scores on a questionnaire change in individuals for whom intended change has in fact occurred. Testing this property is strongly advised for questionnaires that are to be administered in clinical trials. Again, statistical methods are available to test responsiveness (e.g., effect size, standard error of measurement, smallest detectable change, minimally important change; for a discussion, see de Vet et al., Reference de Vet, Terwee, Ostelo, Beckerman, Knol and Bouter2006), but a common standard appears to be lacking.
Aim 2: Appraisal Tools for Psychometric Studies
The past 20 years has seen new types of instruments introduced to the scientific literature that seek to improve the standards of published research. Such instruments take a variety of forms. One is to recommend the inclusion of specific information in the written report so that they provide a clear and complete account of the study (reporting standards). Another is to prescribe what to investigate in a study and how this should be done (design standards). Finally, some tools propose criteria that evaluate the strength of the statistical outcomes. Terwee et al. (Reference Terwee, Mokkink, Knol, Ostelo, Bouter and de Vet2012) have pointed out that there is an important distinction to be made between the design and statistical outcome standards, in a similar fashion to the quality evaluation of intervention studies. The distinction is based on the premise that the results of a study are trustworthy if the study design and methodology are sound. If they are not, the trustworthiness of findings remains unknown. Thus, both study design and study results need to undergo quality assessment, also referred to as critical appraisal. In systematic reviews, the synthesis of results and findings on the design quality of each study can be used to classify interventions according to ‘levels of evidence’ (e.g., Bayley et al., Reference Bayley, Tate, Douglas, Turkstra, Ponsford, Stergiou-Kita and Bragge2014; Charters, Gillett, & Simpson, Reference Charters, Gillett and Simpson2015; Turner‐Stokes, Pick, Nair, Disler, & Wade, Reference Turner‐Stokes, Pick, Nair, Disler and Wade2015), which facilitates translation of research into practice.
Although critical appraisal tools for the design of a study are most commonly associated with clinical trials (e.g., PEDro Scale, Downs & Black Reference Downs and Black1998; Maher, Sherrington, Herbert, Moseley, & Elkins, Reference Maher, Sherrington, Herbert, Moseley and Elkins2003), and single-case studies (e.g., RoBiNT Scale, Tate et al., Reference Tate, Rosenkoetter, Wakim, Sigmundsdottir, Doubleday, Togher and Perdices2015; WWC standards, Kratochwill et al., Reference Kratochwill, Hitchcock, Horner, Levin, Odom, Rindskopf and Shadish2010), similar instruments are also available for psychometric studies. Table 2 summarises basic characteristics of several currently available guidelines, the contents of which are described later in this section; three of the scales without titles are referred to by the senior author, Andresen (Andresen, Reference Andresen2000), Terwee and Terwee-m (Schellingerhout et al., Reference Schellingerhout, Verhagen, Heymans, Koes, Henrica and Terwee2012; Terwee et al., Reference Terwee, Bot, de Boer, van der Windt, Knol, Dekker and de Vet2007), Francis (Francis, McPheeters, Noud, Penson & Feurer, Reference Francis, McPheeters, Noud, Penson and Feurer2016). The remaining three instruments are the COSMIN (COnsensus-based Standards for the selection of health status Measurement INstruments; Mokkink et al., Reference Mokkink, Terwee, Patrick, Alonso, Stratford, Knol and de Vet2010b), EMPRO (Evaluating the Measurement of Patient-Reported Outcomes; Valderas et al., Reference Valderas, Ferrer, Mendívil, Garin, Rajmil, Herdman and Alonso2008), and SACMOT (Scientific Advisory Committee of the Medical Outcomes Trust, Reference Aaronson, Alonso, Burnam, Lohr, Patrick and Stein2002).
Basic Characteristics of Psychometric Evaluation Tools

COSMIN = COnsensus-based Standards for the selection of health status Measurement INstruments; EMPRO = Evaluating the Measurement of Patient-Reported Outcomes; SACMOT = Scientific Advisory Committee of the Medical Outcomes Trust.
Another research quality aspect that is gaining prominence in recent years is that of adequate reporting. The development of reporting guidelines such as the CONSORT Statement (Schulz, Altman, & Moher, Reference Schulz, Altman and Moher2010) and the SCRIBE Statement (Tate et al., Reference Tate, Perdices, Rosenkoetter, Shadish, Vohra, Barlow and Wilson2016) for randomised controlled trials and single-case experimental designs respectively, is aimed at supporting research authors, in describing unambiguously what was done and how it was done and journal reviewers and editors in evaluating such studies (for other reporting guidelines, see www.equator-network.org).
Figure 1 presents an overview of the proportions of item coverage for each of the presented tools across reporting, design and statistical outcomes. Two raters (the authors) independently evaluated the item content of each tool and categorised items (taking into account explanatory text and response categories) according to whether they related to reporting, design, statistical outcomes, or other instrument development topics (e.g., administration, response burden, score interpretation). If a tool presented separate criteria in line with CTT or IRT requirements, such items were only counted once because a researcher would do one or the other (for this purpose, the COSMIN checklist was considered to contain 88 items, although Boxes A to I contain a total of 96 items relating to both CTT and IRT).
A comparison of the content of six critical appraisal tools designed to evaluate psychometric studies.
COSMIN = Consensus-based Standards for the selection of health status Measurement Instruments; EMPRO = Evaluating the Measurement of Patient-Reported Outcomes; SACMOT = Scientific Advisory Committee of the Medical Outcomes Trust.

As Figure 1 shows each of the tools contains a mix of items that relate to at least two of the three primary domains (i.e., excluding the ‘Other’ category). Four of the guidelines had items that address the three principal components, the other two (COSMIN and SACMOT) did not cover statistical outcome standards. In overall terms, the EMPRO and SACMOT items are mainly phrased in a way that focuses on reporting issues, whereas the COSMIN items primarily evaluate adherence to design standards, with the Terwee scale having the largest proportion of items addressing statistical outcomes.
Instrument description
The Andresen tool (Andresen, Reference Andresen2000) summarises ‘instrument assessment criteria’, some of them generic, others with a particular focus on requirements in disability research. It contains 11 domains: (i) conceptual (essentially content validity), (ii) norms, standards values, (iii) measurement model (viz. floor and ceiling effects), (iv) item/instrument bias, (v) respondent burden, (vi) administrative burden, (vii) reliability, (viii) validity, (ix) responsiveness, (x) alternate/accessible form and (xi) culture/language adaptations. The reliability and validity domains each contain more specific measurement aspects (for reliability: test–retest reliability, internal consistency, inter-rater reliability; for validity: multitrait–multimethod matrix and structural validity). A grading system is applied in which each property is assigned a grade A, B or C. However, only for reliability and validity are numerical standards specified. All other properties have gradings, but these are much less specific. This tool itself has not been evaluated psychometrically.
The EMPRO (Valderas et al., Reference Valderas, Ferrer, Mendívil, Garin, Rajmil, Herdman and Alonso2008) was designed as a ‘standardised assessment of patient-reported outcomes’ (p. 700). It contains 39 items, which were converted from the SACMOT attributes, sampling the same eight domains as the SACMOT: (i) conceptual and measurement model, (ii) reliability, (iii) validity, (iv) responsiveness, (v) interpretability, (vi) burden, (vii) alternative modes of administration and (viii) cross-cultural and linguistic adaptations. Its structure and 4-point score system are based on that of the AGREE guideline (The AGREE Collaboration, 2003). Several psychometric properties of the EMPRO have been investigated (Table 2). The EMPRO has been used for evaluation of psychometric properties in systematic reviews (e.g., Schmidt et al., Reference Schmidt, Garin, Pardo, Valderas, Alonso, Rebollo and Grp2014). The tool and a manual are available free of charge in English, however, registration and sublicensing is required via a Spanish-language library system. A scoring algorithm for SPSS is provided so that attribute-specific scores and a total score can be derived. No information could be found on how to deal with (discrepant) evidence when data for each EMPRO item are extracted from more than one publication.
The Francis tool (Francis et al., Reference Francis, McPheeters, Noud, Penson and Feurer2016) extracted criteria from other existing tools and compiled an 18-item checklist with the aim of providing a user-friendly, economical assessment tool of psychometric properties that can be used in the preparation of systematic reviews of instruments. The 18 items cover the domains of (i) conceptual model, (ii) content validity, (iii) reliability, (iv) construct validity, (v) scoring and interpretation and (vi) respondent burden and presentation. Each items is scored as 1=criterion met or 0=criterion not met. The authors emphasise that the tool was not designed to cover assessment standards exhaustively. Inter-rater reliability has been reported (Table 2).
The COSMIN checklist (Mokkink et al., Reference Mokkink, Terwee, Patrick, Alonso, Stratford, Knol and De Vet2010a) is a carefully developed tool, using Delphi consensus-based procedures. It has a number of objectives, including, to identify methodologically sound instruments, design and report psychometric studies, and inform the peer-review process. In total, it contains 114 items, 96 of which relate to psychometric properties, which are presented in the checklist as Boxes. The nine measurement properties are: (i) internal consistency, (ii) reliability, (iii) measurement error, (iv) content validity, (v) structural validity, (vi) hypothesis testing, (vii) cross-cultural validity, (viii) criterion validity and (ix) responsiveness. Other important characteristics of psychometric investigations are covered by the remainder of the items and assess the generalisability and interpretability of results, as well as IRT-related design issues. The checklist has a modular format, in that only the properties presented in a publication are assessed. Where relevant for a measurement property, raters need to complete different questions based on whether psychometric testing was conducted within a CTT or an IRT framework. Different scoring methods can be applied: yes/no/not applicable or a 4-point system (excellent, good, fair, poor). Quality scores can be derived for the design quality of each property assessed in a psychometric study, whereby the worst score determines the overall score for the property (Terwee et al., Reference Terwee, Mokkink, Knol, Ostelo, Bouter and de Vet2012). Inter-rater reliability data have been reported (Table 2). The COSMIN requires users to have some familiarity with concepts such as formative versus reflective measurement models (see, for example, Howell, Breivik, & Wilcox, Reference Howell, Breivik and Wilcox2007; Jarvis, MacKenzie, & Podsakoff, Reference Jarvis, MacKenzie and Podsakoff2003; MacKenzie, Podsakoff, & Podsakoff, Reference MacKenzie, Podsakoff and Podsakoff2011), as well as the previously mentioned framework put forward by Guyatt and colleagues. The COSMIN checklist is a popular tool that has been used in many systematic reviews. It is available online freely, along with an extensive manual which includes scoring instructions.
The SACMOT criteria (Lohr et al., Reference Lohr, Aaronson, Alonso, Burnam, Patrick, Perrin and Roberts1996; Scientific Advisory Committee of the Medical Outcomes Trust, Reference Aaronson, Alonso, Burnam, Lohr, Patrick and Stein2002) aim to ‘define a set of attributes and criteria to carry out instrument assessment’. The criteria are designed to offer prompts for instrument reviewers who evaluate issues applicable to eight domains: (i) conceptual and measurement model, (ii) reliability, (iii) validity, (iv) responsiveness, (v) interpretability, (vi) respondent and administrative burden, (vii) alternative forms and (viii) cultural and language adaptations. Along with definitions, review criteria are tabulated for each of these concepts which are further elaborated in the text. The SACMOT criteria were not developed within a psychometric framework; that is, there are no items, no scoring and no psychometric evaluation of the content of the SACMOT. Nonetheless, the SACMOT criteria have provided the basis for a number of other assessment tools described in this paper.
The Terwee tool was developed as a first attempt to establish criteria for the standardised assessment of the statistical outcomes of psychometric studies (Terwee et al., Reference Terwee, Bot, de Boer, van der Windt, Knol, Dekker and de Vet2007). The authors noted that while criteria for the assessment of psychometric properties had been outlined in publications such as those of the SACMOT and various textbooks, what was needed were clear specifications of when statistical standards for measurement properties were met. They developed such a tool, presenting statistical cut-off scores for the measurement properties of (i) reliability (reproducibility), (ii) internal consistency, (iii) validity (content, criterion and construct), (iv) responsiveness, (v) floor and ceiling effects and (vi) interpretability of results. Each of the eight items is scored as follows: + (positive rating); ? (indeterminate rating); - (negative rating); or 0 (no information available). The tool has not yet been evaluated psychometrically. The instrument developers noted that other researchers may disagree with the criteria outlined in their checklist, and encouraged the provision of explicit rationales for applying different benchmarks (de Vet, Terwee, Mokkink, & Knol, Reference de Vet, Terwee, Mokkink and Knol2011b). In Table 2, an additional tool is listed as the Terwee-m. This tool was derived from the original Terwee (2007) scale with minor changes to items and criteria. In combination with a COSMIN assessment, this allows for the classification of the findings on psychometric properties of a questionnaire into levels of evidence. The method is described in more detail in the worked example under Aim 3.
Reporting standards
Reporting standards, often in the form of published guidelines (see www.equator-network.org), have the purpose of promoting clarity, transparency and completeness in research reports. Only when this is achieved can research be adequately evaluated for design robustness and strength of statistical outcomes. This forms the basis of any subsequent evaluation.
To our knowledge, no guideline has so far been developed in the rigorous CONSORT tradition that purely addresses the reporting of psychometric property investigations in the way they are usually structured in psychology and related disciplines, i.e., reflecting reporting of the psychometric measurement properties listed earlier. Streiner, Norman, and Cairney (Reference Streiner, Norman, Cairney, Streiner, Norman and Cairney2015b), however, extracted and summarised the reporting topics most relevant to instruments used within research contexts only (in contrast to commercially available instruments) as outlined in the ‘Standards for Educational and Psychological Testing’, published by the American Educational Research Association (1999). Twelve brief instructions relate to test development, six to reliability and seven items to validity. This list of instructions is not developed into a tool, per se, and as such is not presented in an item format with response categories, nor has it been examined psychometrically.
The same group (Streiner & Kottner, Reference Streiner and Kottner2014) provided a ‘guide’ to reporting psychometric studies that addresses all features of a research publication which are universal, including information that should be stated in an abstract, information on the study sample and study methods, topics to be covered in the discussion section, and other study details. A special focus is on the outcomes of the study concerning findings on reliability and validity.
Other available guidelines are aimed at investigations of tests in medicine: the STARD guideline covers ‘Standards for Reporting Diagnostic accuracy studies’ (Bossuyt et al., Reference Bossuyt, Reitsma, Bruns, Gatsonis, Glasziou, Irwig and De Vet2015); its extension STARDdem has the same purposes but is specifically geared towards diagnostic accuracy in dementia (Noel-Storr et al., Reference Noel-Storr, McCleery, Richard, Ritchie, Flicker, Cullum and Rutjes2014). Another guideline, the GRRAS (Guidelines for Reporting Reliability and Agreement Studies; Kottner et al., Reference Kottner, Audigé, Brorson, Donner, Gajewski, Hróbjartsson and Streiner2011), covers reporting of reliability and agreement testing in some detail, but not other aspects of psychometric studies that may be considered important.
As Figure 1 demonstrates, however, all of the six scales reviewed contain items that address issues of reporting, as opposed to, for example, providing guidance on good study design (i.e., methodological quality). On the SACMOT, for instance, much of the explanatory text is phrased in a way that relates to good reporting of what was done and how. Similarly, although of all the scales reviewed, the COSMIN most clearly focuses on design standards, the phrasing of almost one-third of its items can be regarded as relating to issues of reporting, one of the several stated aims of the COSMIN. For instance, every measurement property evaluated contains items on ‘design requirements’, including whether the percentage of missing items was described, and how missing items were handled. A design standard would instead suggest methods of dealing with missing items, in a similar way that suggestions about sample size requirements are made to meet the standards explicated for various properties.
Design standards
Design standards are proposed as a means of reducing risk of bias to the internal validity of a study, which if complied with, should result in sound methodological quality of the study, making the results and outcomes more reliable. For psychometric studies, design issues relate to all decisions about what is assessed in whom and, particularly, how. Questions focus on which psychometric properties are assessed, the requirements needing to be fulfilled to conduct the assessment (e.g., sample size), and the methods applied (e.g., selecting an appropriate statistical technique). There is often a multitude of options available, especially with regard to statistical analyses, and there may not be consensus among experts exactly which technique may be most suitable for a given purpose. It is therefore crucial that instrument developers describe clearly and provide a rationale and/or reference for all design and method decisions. As pointed out earlier, the reason for this is that any statistical results can only be interpreted in light of the appropriateness and soundness of the underlying methods of the study.
Statistical outcome standards
The standardised recommendations for investigation of statistical outcomes is perhaps the most difficult to devise. One difficulty that affects the presented quality evaluation tools pertains to the assessment of structural validity and the outcomes obtained with statistical techniques that are derived from CTT and IRT. Both these theoretical frameworks have produced a multitude of statistical options for the purpose of assessing structural validity, and each technique has its own statistical standards (and, to make matters more complex, for which expert agreement does not necessarily exist). Neither the Terwee nor the Andresen tools cover these aspects in depth,Footnote 3 and specific criteria may need to be drawn from the literature. For example, Schreiber, Nora, Stage, Barlow, and King (Reference Schreiber, Nora, Stage, Barlow and King2006) summarise and recommend suitable fit indices and cut-off scores applicable to structural equation modelling for confirmatory models within CTT. Similarly, for statistical methods in the IRT tradition, criteria will also depend on the statistical method used, and ascertaining such criteria during the evaluation of psychometric properties may be difficult unless the criteria applied are explicitly described in the respective psychometric study. This naturally all adds to the complexity of quality assessment of psychometric properties.
The assessment of internal consistency is plagued by other issues. Disagreement over what some of the statistical concepts refer to (see Tang, Cui, & Babenko, Reference Tang, Cui and Babenko2014), and what statistic to use to assess them (Revelle & Zinbarg, Reference Revelle and Zinbarg2009) complicates the matter. Furthermore, there may be an over-reliance on well-known techniques, such as Cronbach's alpha, that numerous statisticians have advised against using and suggested alternatives, for example, the omega coefficient (Dunn et al., Reference Dunn, Baguley and Brunsden2014; Trizano-Hermosilla & Alvarado, Reference Trizano-Hermosilla and Alvarado2016). Within IRT, additional statistics have been developed and require their own standards to be defined (see article by Kean et al., in this special issue). Hence, no all-encompassing standards are currently available. A component or modular approach, similar to that taken in the COSMIN checklist, could allow for the assessment of relevant criteria for each psychometric property depending on the statistical method employed.
Combining results of design and statistical outcome evaluation into levels of evidence
Schellingerhout et al. (Reference Schellingerhout, Verhagen, Heymans, Koes, Henrica and Terwee2012) describe a system they used in their systematic review to synthesise evidence across publications on measurement properties. They utilised a modified version of the Terwee (2007) statistical quality criteria tool (henceforth the Terwee-m) and the COSMIN checklist to combine those results into levels of evidence for each respective psychometric property for which evidence had been published. Because these tools do not appear to have been developed within the same comprehensive framework (although they have considerable overlap), some of the original Terwee definitions and quality criteria were adapted for the purpose of synthesising evidence. The method described in Schellingerhout et al. (Reference Schellingerhout, Verhagen, Heymans, Koes, Henrica and Terwee2012) will be outlined in the worked example.
Given that this ‘Levels of Evidence’ approach is currently the most comprehensive method of evaluation of psychometric properties, with respect to both integration of findings, as well as flexibility of application, the worked example described in the next section is based on this approach.
Aim 3: Worked Example
Description of the technique: Using the Terwee-m and the COSMIN checklists to arrive at a Levels of Evidence table for the Impact on Participation and Autonomy Questionnaire (IPA)
Psychometric properties are usually investigated in multiple studies reported in subsequent publications by one or more research teams. The Schellingerhout et al. (Reference Schellingerhout, Verhagen, Heymans, Koes, Henrica and Terwee2012) approach allows for the collation and systematic synthesis of evidence for a single instrument across publications. Further, the psychometric properties of different instruments designed to measure the same construct can be compared using this method. At times, one psychometric property alone may be of special interest, for example, to find the instrument with sound evidence for its responsiveness in a particular population. Other times, one may be interested in comparing various psychometric properties of multiple questionnaires, or explore all the available psychometric evidence base for one questionnaire.
Using the example of the Impact on Participation and Autonomy Questionnaire (IPA; Cardol, de Haan, van den Bos, de Jong, & de Groot, Reference Cardol, de Haan, van den Bos, de Jong and de Groot1999), we now provide an example assessment of the psychometric properties of this particular measure. To facilitate comprehension, explanations for ratings are provided when they were not met or partly met.
While the measurement aims of the IPA have not been specifically stated, the instrument can be conceptualised as an evaluative questionnaire for a generic (i.e., not disease or impairment specific) assessment of the construct ‘participation’ and its ability to detect change following rehabilitation treatment. It is a self-report questionnaire containing 31 items (Cardol, de Haan, de Jong, van den Bos, & de Groot, Reference Cardol, de Haan, de Jong, van den Bos and de Groot2001), which represent five factors: autonomy indoors (7 items), family role (7 items), autonomy outdoors (5 items), social relations (6 items), and paid work and education (6 items). Response options are: very good, good, fair, poor, very poor. Another 8 items assess ‘problem experience’ with response options: no problems, minor problems, severe problems.
The IPA was originally developed in Dutch, with psychometric properties explored in three published studies (Cardol et al., Reference Cardol, de Haan, van den Bos, de Jong and de Groot1999; Cardol et al., Reference Cardol, de Haan, de Jong, van den Bos and de Groot2001; Cardol et al., Reference Cardol, Beelen, van den Bos, de Jong, de Groot and de Haan2002). Since then, several other studies have investigated the psychometric properties of translated versions and different patient populations. For illustrative purposes, the evaluation of psychometric properties of the original Dutch language versions, in line with the suggestions of Schellingerhout et al., are outlined and displayed in the following text and tables.
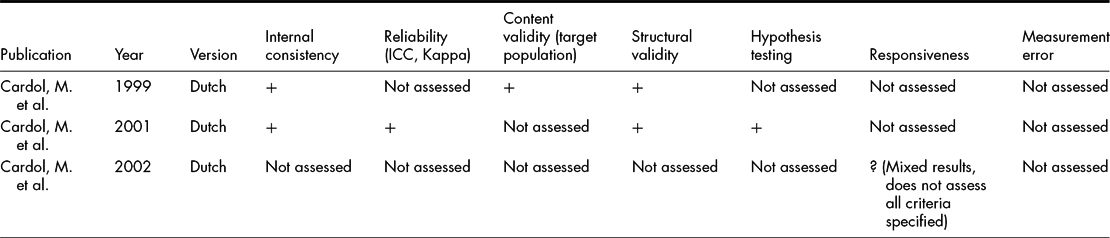
First, two independent assessors (the authors) rated the three IPA publications on the Terwee-m tool for all applicable properties. This included internal consistency, reliability, content and structural validity, hypothesis testing (convergent and divergent validity), as well as responsiveness. Assessment of measurement error was not reported in any of the studies. Discrepancies in ratings were resolved by consensus discussion. Results of these ratings are shown in Table 3. As can be seen, all but one of the investigated psychometric properties received positive ratings, showing that the criteria specified in the Terwee-m scale were met. The ?-rating for responsiveness was based on mixed results on the Terwee-m criteria, and the fact that not all of the criteria specified were investigated (or reported).
Evidence Table of IPA Terwee-m Ratings

Next, we scrutinised each publication against the applicable COSMIN criteria. If appropriate, the additional IRT-related criteria were also completed (for the purpose of this article, and following Schellingerhout et al.’s approach, we did not extract information on interpretability and generalisability). COSMIN raters are advised that there is a certain degree of subjectivity in completing the checklist items. For example, some information on the study design may not have been stated explicitly by study authors, but it can be deduced from other information in the article what was done and how. According to the COSMIN manual, this is permissible and raters are encouraged to use their own knowledge and expertise in the rating process (Mokkink et al., Reference Mokkink, Terwee, Patrick, Alonso, Stratford, Knol and de Vet2012).
As noted earlier, the COSMIN checklist mostly contains items that assess methodological quality, and the response options are: excellent, good, fair, or poor. However, items that pertain to transparency of reporting are also present. In fact, assessment of the ‘design requirements’ for all properties (except content validity) includes two items about missing values: reporting of the percentage of missing values and how they were handled. If a publication does not delineate how missing items were handled, the overall rating for this property will be ‘fair’ at most, due to the ‘worst-score-counts’ algorithm of the COSMIN. Table 4 indicates that COSMIN ratings would have improved if the issue of missing values had been addressed more clearly. With regard to the design and methods used, the COSMIN ratings were mostly ‘good’ or ‘excellent’. This possibly highlights the differences in what is commonly reported in different disciplines that utilise psychometric research. Similarly, the use of certain frameworks (such as that of Guyatt and colleagues to differentiate between predictive, evaluative and discriminative measurement purpose) may be more common in some areas of research than others (and thus impacts, in this case, on construct validity scores of the COSMIN checklist).
Evidence Table of IPA COSMIN Ratings

The information of Tables 3 and 4 was then integrated into the levels of evidence table (Table 5). Strong evidence for a measurement property (either positive [+++] or negative [−−−]) emerges from ‘consistent findings in multiple studies of good methodological quality or in one study of excellent methodological quality’ (Schellingerhout et al., Reference Schellingerhout, Verhagen, Heymans, Koes, Henrica and Terwee2012). Moderate (++ or −−) evidence comes from multiple studies with ‘fair’ ratings or one study with ‘good’ rating. Limited (+ or −) evidence is available from one study with a ‘fair’ rating. Conflicting finding can be indicated with a ± symbol, and ? is used when evidence is available from studies with ‘poor’ method ratings only.
Levels of Evidence Table Synthesising Findings of Design Standards and Quality of Quantitative Findings on the Dutch Version of the IPA

Table 5, based on the ‘worst-score-counts’ algorithm, shows that there is limited but supportive (positive) evidence for the internal consistency, reliability, and structural validity of the IPA. Moderately strong evidence in support of the content validity of the IPA was found. In terms of convergent and divergent validity (hypothesis testing), the evidence was rated as ‘unknown’, due to low COSMIN ratings despite positive Terwee-m ratings. Evidence for responsiveness was classified as conflicting, due the mixed results on the Terwee-m.
It should be noted that if the issue of reporting on missing values was removed from consideration, and only methodological standards were applied, the level of evidence for some of the measurement properties would be considered at least moderate, rather than limited. Based on the results collated in Table 5, one might conclude that the IPA is a promising questionnaire for the assessment of ‘participation’. Further research should be undertaken in an effort to support the robustness of these findings and elevate the level of evidence for the measurement properties of this questionnaire to moderate or strong.
Discussion and Conclusion
Psychometrics is a vast field and there remains complexity with regard to definitions and standards of assessment of psychometric properties. Only a small number of standards of reporting, methodological and statistical outcome quality are available. Efforts by researchers such as the SACMOT, COSMIN and EMPRO groups have led to a push for evidence-based evaluation and selection of outcome measures. The available assessment tools each cover a mix of standards, and future work may involve increasing the differentiation of issues of reporting, methodological quality and statistical outcome quality in these tools.
But what is perhaps even more urgently needed is the development of more consistent and widely agreed benchmarks for high standards of design and statistical outcomes in psychometric studies. The difficulties with the current tools may reflect the lack of such standards: instead of providing a benchmark, numerous items across the various tools presented here reverted to simply requesting information on what was done, rather than specifying what was expected to be done (design issues) or found (statistical outcome issues). Of course, any endeavour to develop these standards will be contentious, because the design requirements and statistical analyses may depend on the specific circumstances under which the investigation was undertaken. Sometimes, presenting the statistical outcome of one particular analysis strategy may be sufficient; at other times, supplementing one coefficient with additional calculations of other coefficients may be adequate or even required (e.g., Cronbach's alpha is often reported, but due to the way it is derived, other coefficients may be more informative). Any tool that aims to evaluate psychometric investigations is faced with the challenge of inherent design complexities and requirements, and potentially dealing with an enormous variety of possible analytic strategies and corresponding benchmarks. The assessment tools currently available have, each from a different perspective, made a start on developing various standards for psychometric studies.
As with any instrument, some of the tools presented here have been developed with greater scientific rigour than others. Their adequacy, accuracy and usefulness should be investigated in future research. Nevertheless, there are various tools at one's disposal to provide guidance on what to assess and how, and how to report one's psychometric study. For clinicians and intervention trialists, these tools can assist in selecting appropriate outcome measures and thereby adherence to evidence-based clinical and research methods.
Financial Support
This research received no specific grant from any funding agency, commercial or not-for-profit sectors.
Conflict of Interest
None.
Ethical Standards
The research does not involve human experimentation.