INTRODUCTION
An increasing number of studies on marine species genetic structure are available, especially concerning exploited species. Knowledge about population structure is among the most important questions to investigate. The resulting information can be critical both for the understanding of the biology of the species and for better management of their stocks (Zouros & Foltz, Reference Zouros and Foltz1984; Thorpe et al., Reference Thorpe, Solé-Cava and Watts2000).
Holothurians have an ecological and commercial importance. Despite this interesting feature, studies on this invertebrate in Tunisia are sparse, and lacking in specific details. No genetic study has been carried out on holothurians in Tunisia. Cherbonnier (Reference Cherbonnier1956) wrote generally on sea cucumber ecology in Tunisia and described several species. Bruun (Reference Bruun1940) and Boudouresque et al. (Reference Boudouresque, Harmelin and Grissac1986) reported on some sea cucumber species observed in the Gulf of Tunis. Ben Mustapha et al. (Reference Ben Mustapha, Hattour, Mhetli, EL Abed and Tritar1999) reported on some sea cucumbers species observed in the Gulf of Gabès.
Genetic subdivision depends on an interaction between the life history of a species and the environment. In general, marine species with inherently less potential for gene flow show a higher degree of genetic subdivision among populations (Burton & Feldman, Reference Burton, Feldman and Kennedy1982; Waples, Reference Waples1987; Ward, Reference Ward1990). The potential for gene flow is generally great in the marine environment, and species with planktonic larvae typically show low levels of genetic subdivision over large distances (e.g. Gyllensten, Reference Gyllensten1985; Palumbi, Reference Palumbi1992; Martinez & Richmond, Reference Martinez, Richmond, Mooi and Telford1998; Bohonak, Reference Bohonak1999). In the face of this large-scale genetic homogeneity, it is of special interest to search for conditions that favour genetic subdivision in marine species. Although the predominant mechanisms leading to population differentiation are not always clear (Palumbi, Reference Palumbi1994), several factors may be important either singly or in combination, including limited dispersal ability (Hunt, Reference Hunt1993; Doherty et al., Reference Doherty, Planes and Mather1995), local adaptation (Koehn et al., Reference Koehn, Newell and Immermann1980; Powers et al., Reference Powers, Lauerman, Crawford and DiMichele1991; Schmidt & Rand, Reference Schmidt and Rand1999), oceanographic currents (Benzie & Stoddardt, Reference Benzie and Stoddart1992; Benzie & Williams, Reference Benzie and Williams1997; Battaglene et al., Reference Battaglene, Seymour and Ramofafia1999; Rocha-Olivares & Vetter, Reference Rocha-Olivares and Vetter1999) and habitat discontinuities (e.g Riginos & Nachman, Reference Riginos and Nachman2001). Furthermore, isolation-by distance has been reported for a number of fish and invertebrates (e.g. Johnson & Black, Reference Johnson and Black1995; Chenoweth et al., Reference Chenoweth, Hughes, Keenan and Lavery1998; Mamuris et al., Reference Mamuris, Stamatis and Triantaphyllidis1999; Huang et al., Reference Huang, Peakall and Hanna2000).
Biogeographical regions are often described based on the overlapping ranges of many species, and boundaries between these regions may derive from historical discontinuities or from present-day environmental differences. These boundaries represent natural places to look for genetic discontinuities within species as well. In the Mediterranean Sea, the Siculo-Tunisian (S-T) Strait is considered an important genetic boundary for several species, resulting in an east–west Mediterranean cleavage for sea bass Dicentrarchus labrax (Bahri-Sfar et al., Reference Bahri-Sfar, Lemaire, Ben Hassine and Bonhomme2000), sea bream Sparus aurata (Ben Slimen et al., Reference Ben Slimen, Guerbej, Ben Othmen, Ould Brahim, Blel, Chatti, Elabed and Said2004), prawn Penaeus kerathurus (Zitari-Chatti et al., Reference Zitari-Chatti, Chatti, Elouaer and Said2008, Reference Zitari-Chatti, Chatti, Fulgione, Caiazza, Aprea, El Ouaer, Said and Capriglione2009), bivalves Mytilus galloprovincialis and Cerastoderma glaucum (Quesada et al., Reference Quesada, Beynon and Skibinski1995; Nikula & Vainola, Reference Nikula and Vainola2003), seagrass Posidonia oceanica (Arnaud-Haond et al., Reference Arnaud-Haond, Migliaccio, Diaz-Almela, Teixeira, Van de Vliet, Alberto, Procaccini, Duarte and Serrao2007) and several fish species (Borsa, Reference Borsa1997). These genetic patterns may be explained either by present-day dispersal and/or by historical biogeographical factors due to Pleistocene glacial episodes and the resulting variations in the sea level and surface temperature.
In Tunisia six morphological species of the genus Holothuria were described. Several times, the morphological study of the species showed its limits especially in the case of very conservative morphologies. Even in the absence of morphological variation, allozyme electrophoresis has been a powerful tool for analysing patterns of genetic variation within and among populations and species, by providing measures of heterozygosity, gene flow and differentiation (Ferguson, Reference Ferguson1980; Futuyma, Reference Futuyma1986; Hartl, Reference Hartl1988).
The sea cucumber Holothuria polii (Delle Chiaje, 1823) is a sedentary marine species which has low swimming ability, but pelagic larval dispersion. This context suggests that H. polii could be a good biological model to show genetic differentiation in H. polii populations on both sides of the S-T Strait.
In the present study, we examine the genetic structure of H. polii populations collected from seven localities on the eastern and western Mediterranean coasts of Tunisia, using allozyme electrophoresis as genetic markers, to evaluate the extent of gene flow and levels of genetic differentiation across the known genetic boundary of the S-T region.
MATERIALS AND METHODS
Sampling strategy
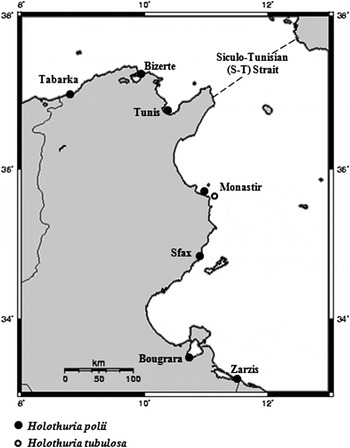
Samples of Holothuria polii (27–30 individuals per population) were obtained from seven locations in Tunisia (Figure 1). A sample of H. tubulosa from Monastir was included in this study to make a comparison between the two species. Samples of H. polii from Tabarka and Tunis were collected by snorkel; individuals from all other populations were obtained by dredging. Holothurians were transported live to the laboratory and were kept for several hours in containers with flowing seawater to allow the gut contents to be partially voided before processing. The specimens were identified using the morphological criteria described by Tortonèse (Reference Tortonèse, Fisher, Schneider and Bauchot1987). The diagnosis of H. polii and H. tubulosa was based on the form of specula and the colour of podia and papilla. After that, animals were dissected to obtain subsamples of longitudinal muscle bands and gut which were frozen for later electrophoresis analyses.
Locations of the Holothuria polii populations sampled in this study.

Allozyme electrophoresis
Approximately 350 mg of frozen tissue (gut or longitudinal muscle) was homogenized in the same volume of cold Tris HCL (100 mM Tris adjusted to PH 8.0 with HCL) prior to electrophoresis.
Electrophoresis of all enzymes was performed on 12% horizontal starch gels according to the protocol described in Pasteur et al. (Reference Pasteur, Pasteur, Bonhomme, Catalan and Britton-Davidian1986) and in Ballment et al. (Reference Ballment, Uthicke, Peplow and Benzie1997).
Eleven putative loci were scored using the following buffers: TC pH 8 was used for Pgm (phosphoglucomutase EC 2.7.5.1), Mdh-1, Mdh-2 (malate deshydrogenase, EC 1.1.1.3.7) and Pgd (phosphogluconate deshydrogenase EC1.1.1.4.3), TG pH 8.4 was used for Hk (hexokinase, EC 2.7.1.1). TCB pH 8.7 was used for Gpi (glucose-phosphate-isomerase, EC 5.3.1.9), Es-3, Es-14 (esterase EC 3.1.1.1), Sod (superoxide dismutase, EC 1.15.1.1) and Aat (amino-aspartate transaminase, EC 2.6.1.1).
The Gpi enzymatic system was screened from gut and the remainder from longitudinal muscle bands. Alleles were labelled according to their mobility relative to the most common allele in the total sample, which was set at 100. Calibration of alleles was accomplished by running selected individuals from different localities side by side on the same gel. We assumed a locus to be polymorphic when the frequency of the most common allele was 0.95 or less, and at least another allele was present at a frequency equal to or higher than 0.05. When multiple loci were observed, the slowest migrating locus was designated 1.
Statistical analyses
Several parameters of genetic variation were calculated from the allozymes data. The variation within population was estimated by the percentage of polymorphism (P), the observed and expected heterozygosity (Ho and Hexp) and the mean number of alleles resolved for a locus (A), all using GENETIX 4.03 (Belkhir et al., Reference Belkhir, Borsa, Chikhi, Raufaste and Bonhomme2001).
Exact tests for Hardy–Weinberg equilibrium (HWE) at each locus were calculated for each population using GENEPOP 3.4 (Raymond & Rousset, Reference Raymond and Rousset2003).
F statistics were calculated (Weir & Cockerham, Reference Weir and Cockerham1984) to estimate parameters F, ƒ and θ (which in Wright's (Reference Wright1978) notation correspond to Fit, Fis and Fst). Single-locus Fis and Fst calculations were performed for all populations. Multilocus Fst values were calculated for each pair of samples. First, the eleven collection sites were treated separately, and then were grouped according to their geographical origin. The three localities (Tabarka, Bizerte and Tunis) were pooled into a major regional group (western) and the remaining localities into another group (eastern).
To estimate the amount of gene flow between populations, the effective number of migrants between populations, Nm, was calculated using Wright's (Reference Wright1978) island model of population structure. Under this model, genetic divergence is related to gene flow by the formula Nm = (1 – FST/4FST) using the average FST across loci. The model assumes that migrants are randomly distributed among subpopulations, ignores any effects of natural selection, and considers that equilibrium has been reached between gene flow and genetic drift; therefore it provides only a rough estimate.
A phenogram by the UPGMA using programs in the PHYLIP software package 3.6 (Felsenstein, Reference Felsenstein1993) was constructed using pairwise Nei's (Reference Nei1972) genetic distances. A natural population of H. tubulosa was used as an out group. Bootstrap values were obtained from 1000 pseudo-replicates of allele frequencies using the Seqboot program in the same package.
Correlations between geographical and genetic distances were tested using Mantel's test (Mantel, Reference Mantel1967) implemented in GENETIX. Probability of correlation was read directly from the distribution of 10,000 randomized matrices computed by permutations.
RESULTS
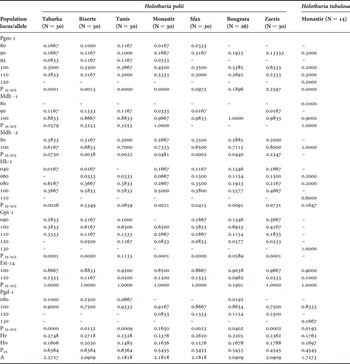
Analyses were limited to enzyme loci which produced well-resolved staining patterns for all populations. Aat-2, G6pdh and adenylate kinase (AK) showed activity but the observed banding patterns could not be interpreted. Four loci were found to be monomorphic, whereas the remaining seven loci showed from 2 to 5 alleles (Table 1). At most loci the genetic variation among the populations consisted in differences in allele frequencies.
Allele frequencies at seven polymorphic loci in the populations of Holothuria polii and Holothuria tubulosa sampled. PH-WE, probability of tests of goodness of fit to the Hardy–Weinberg equilibrium; He, expected heterozygosity; Ho, observed heterozygosity, P95, proportion of polymorphic loci at the 95% criterion; A, mean number of alleles per locus.

Quantitative parameters of the genetic variability A, P95 and H were computed for all populations and showed a relatively low genetic variation among all samples of Holothuria polii (Table 1). The observed heterozygosity values ranged from 0.14 and 0.20 and were the highest in the Bizerte population. The mean number of alleles per locus varied between 2.09 to 2.27 and was the highest in the Tabarka population. The P95 values ranged from 45.45% to 63.64%.
When compared to H. polii samples, the H. tubulosa sample showed lower Ho and lower A values. This was mainly characterized by the occurrence of alternative alleles at the majority of loci: Pgm-1120, Mdh-180, Hk-1110, Gpi-1130 and Pgd-1130. The mean genetic distance value calculated between H. polii samples and the H. tubulosa sample was Fst = 0.32.
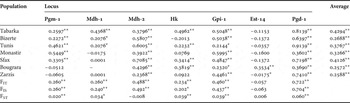
Departures from HWE were fairly common and significant for the majority of analysed loci, as shown by the exact test. Positive FIS values at these loci indicated heterozygote deficiencies. In particular, highly significant heterozygote deficiency (P < 0.001) was detected at the Mdh-2 and Pgd-1 loci, in all samples (Table 2). Likewise, the multi-locus test by population showed deviation from HWE in all populations with a significant heterozygote deficiency (Table 2).
Single and multilocus estimates of the fixation index FIS within each population of Holothuria polii. Average FST and FIT values are also given for each locus. Tests of significance were performed with permutation procedure.

*P<0.05; **P < 0.001.
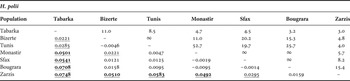
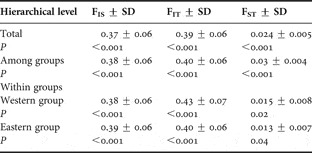
The pairwise genetic distances were consistently greater for comparisons that included Tabarka, and Zarzis populations (Table 3). After the Bonferroni correction, seven pairwise comparisons, including Tabarka and Zarzis, remained statistically significant (α = 0.0023). The mean FST value of 0.024 indicated that about 3% of the total gene diversity observed was due to population differentiation and that almost 97% was due to variation among individuals within populations. The mean FST value was statistically significantly > zero, indicating some spatial genetic structure, related essentially to the differentiation of Tabarka and Zarzis populations from the other populations.
Estimates of FST values between pairs of populations of Holothuria polii, based on seven polymorphic loci are given below the diagonal and the level of gene flow, given by the average number of migrants per generation (Nem) above the diagonal. Significant values before (underlined) and after sequential Bonferroni adjustment (in bold) are indicated for FST values.

The hierarchical F statistics analysis showed an among-groups FST estimate (FST = 0.030; P < 0.001) higher than that at the total population level. The within-group variance in allele frequencies indicated a sub-structuring (P< 0.05) among the proximal samples within each group (Table 4).
Unbiased jackknife estimates of F statistics (Weir & Cockerham, Reference Weir and Cockerham1984) of the Holothuria polii populations at all hierarchical levels. Estimates are given for all seven collection sites (total), among groups, and within groups. P values indicate the degree of significance of the corresponding F estimate (obtained by permutation procedure, 10,000 steps). SD, standard deviation.

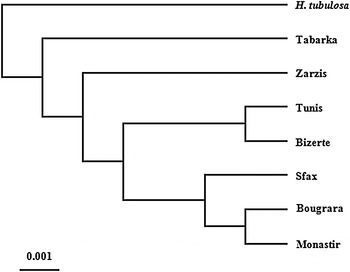
An UPGMA dendrogram based on Nei's genetic distance (Figure 2) does not clearly demonstrate the clustering of populations into two major clades according to their geographical origin, but shows the separation of the Tabarka population from the others.
Holothuria polii dendrogram illustrating genetic relationships among seven populations from the Tunisian littoral, using UPGMA cluster algorithm. The population of Holothuria tubulosa is included as an out group.

We found no correlation between geographical and genetic distances (r = 0.22; P > 0.05). Estimates of the level of gene flow between pairs of populations showed an average number of migrants per generation (Nem) higher than 1 in almost all pairs (Table 3). Nevertheless, a high variance in effective migrant number characterized pairwise comparisons. The populations of Tabarka and Zarzis exchange the lowest number of migrants between them and with all the other populations.
DISCUSSION
In the present study, we detected a relatively low genetic variability. Measures of genetic variability (H = 0.14–0.20; A = 2.09–2.27; P95= 45.45%–63.64%) are considered lower than those recorded for other holothurian species. For example, Holothuria nobilis (P = 99% H = 0.29 and A = 3), Holothuria scabra (P = 87%, H = 0.28 and A = 2.3) and Holothuria atra (P = 85%, H = 0.41 and A = 2.7) (Uthicke & Benzie, Reference Uthicke and Benzie2000, Reference Uthicke and Benzie2001).
Test of conformity to HWE and the high positive FIS values showed general heterozygote deficiency in all samples. Such a finding appears to be a general characteristic of natural marine invertebrate populations (Hare et al., Reference Hare, Karl and Avise1996). Possible explanations for this observation are categorized into technical artefacts (null alleles), population causes (Wahlund effect and mating system) and selection effects. Ayala et al. (Reference Ayala, Hedgecok, Zumwalt and Valentine1973) and Buroker et al. (Reference Buroker, Hershberger and Chew1975) also suggested that poor electrophoretic resolution may result in the mis-scoring of heterozygotes as homozygotes. Many electromorphs are known to harbour ‘hidden’ variation that cannot be uncovered by varying the assay conditions because some bands visualized as unique can actually be the result of several overlapping bands, and their separation could increase the number of heterozygotes as opposed to homozygotes (Rebordinos & Cross, Reference Rebordinos and Cross1999).
In our case the null alleles hypothesis cannot be definitely ruled out and needs more adequate investigations to be verified. Inbreeding may be discarded because in organisms with external fertilization and extended planktonic larvae dispersal like holothurians, mating between relatives is generally considered to occur with negligible frequency.
Elsewhere, the Wahlund effect was rejected simply on the basis of a genetic homogeneity observed over large distances (Zouros & Foltz, Reference Zouros and Foltz1984). In our study, geographical variation in allele frequencies is relatively modest and argues against population mixing as a possible source of large heterozygote deficiency.
Deviations from HWE with heterozygote deficits could also be due to a diversifying selection. For example, Tracey et al. (Reference Tracey, Bellet and Gravem1975) and Zouros et al. (Reference Zouros, Singh, Foltz and Mallet1983) found that heterozygote deficiency is larger among younger cohorts of Mytilus californicus and Crassostrea virginica. Mallet et al. (Reference Mallet, Zourous, Gartner-Kepkey, Freeman and Dickie1985) observed heterozygote deficiency in progeny of Mytilus edulis mating pairs and postulated that genotype-dependant larval mortality was the most likely cause.
In our case, the heterozygote deficiency might result from one or several of the above discussed causes and determining the effect of each needs more adequate investigations.
A relatively high level of genetic differentiation among populations was observed at almost all loci and hierarchical FST analysis suggested genetic distinctiveness of two groups of populations on both sides of the S-T Strait.
Correlation between FST and geographical distance provides no evidence for isolation by distance acting at the scales studied. However, the F statistics analysis indicated some spatial genetic structure. Levels of worldwide genetic population structure vary widely in different holothurian species, so that genetic structure can be strong over very short distances and weaker across large geographical scales (Benzie & Williams, Reference Benzie and Williams1992; Uthicke & Benzie, Reference Uthicke and Benzie2000, Reference Uthicke and Benzie2001, Reference Uthicke and Benzie2003).
Two categories of factors may account for the observation of patterns of population structure in species: intrinsic factors (i.e. biological, ecological, physiological or behavioural) (Stancyk & Feller, Reference Stancyk and Feller1986; Carvalho, Reference Carvalho1993) and extrinsic factors (such as historical events). In a wide survey of published data, Benzie (Reference Benzie2000) indicates that extrinsic factors may explain the patterns observed better than present-day dispersal.
The genetic structure observed in the populations of H. polii reflects biogeographical regions to some extent in that the two most differentiated populations, Tabarka and Zarzis, are situated at the margins of the range sampled in western and eastern Mediterranean basins, respectively. It is possible that these two localities sampled belong to two distinct reproductive units that have apparently been genetically isolated from one another. However, we have no direct evidence that could permit us to consider the intermediate region (from Bizerte to Bougrara) as a putative contact zone between the two divergent entities.
It is possible that the pattern of genetic variation observed in the sea cucumber H. polii reflects present-day processes in that local coastal currents might act as a substantial barrier to larval transportation and hence to gene flow between eastern and western populations. The water circulation in the S-T Strait is characterized by a unidirectional east–south-east flow of pelagic currents which go round Cape Bon and leaves the coast of Tunisia at the latitude of Kelibia, while eastern Mediterranean waters stay in the Lybico–Tunisian Gulf (Pinardi & Masetti, Reference Pinardi and Masetti2000). However, dispersal routes on such currents could have permitted sufficient gene flow, at least in one direction from western to eastern region, preventing the accumulation of substantial genetic differentiation unless the hydrographic regime was ancient and allowed progressive genetic differentiation. Furthermore, holothurians have pelagic larvae with a duration of about 13–26 days (Vergara-Chen et al., Reference Vergara-Chen, González-Wangüemert, Marcos and Pérez-Ruzafa2010), so that the planktonic larval phase of H. polii may allow transport of larvae over relatively long distances. Vergara-Chen et al. (Reference Vergara-Chen, González-Wangüemert, Marcos and Pérez-Ruzafa2010) have suggested that low population differentiation observed between samples of H. polii over small spatial scales is a consequence of unrestricted gene flow between populations.
This pattern of genetic structure, although unclear probably because of the low level of enzyme variability, may be explained by hydrographic regimes during the Pleistocene. Throughout this period the sea level dropped frequently and modified coastlines splitting apart the eastern and western basins; hence, exchange between basins was confined to the S-T Strait, which was much narrower than it is today (Thiede, Reference Thiede1978). Thus, H. polii populations will have experienced many opportunities for allopatric divergence. Previous studies on invertebrate and fish species in the region (see references in Introduction) agree in showing an east–west split between populations of these species. Some of these authors suggested natural selection through local adaptation and/or present day dispersal to explain this pattern of genetic differentiation. However, similar patterns of population structure among diverse taxa in the same region seem less probable to happen independently and strengthen the hypothesis of vicariance events that may promote the development of this pattern (Avise, Reference Avise1994; Bernardi et al., Reference Bernardi, Holbrook and Schmitt2001).
Otherwise, one can suspect the founder effect to play a role in the differentiation of Tabarka and Zarzis populations as they are situated on the margins of the range surveyed, but this seems to be the case in that both populations showed high genetic diversity when compared with the other populations sampled.
Our study needs to be extended to a larger geographical scale to determine whether the genetic structure suggested has a biogeographical component.
The relatively restricted gene flow over short distances and the differentiation of at least two populations, as revealed by allozyme markers, may indicate deeper population structure. Mitochondrial DNA and microsatellites markers, which are potentially more variable, may bring better resolution and provide new knowledge on the evolution of Holothuria polii populations. Mitochondrial and nuclear genes might be expected to differ in their resolution of past and present gene flow because of differences in the rates at which they come to genetic equilibrium.
There are still only a limited number of broadscale S-T Strait studies using both nuclear and mtDNA genes, but in some cases mitochondrial and nuclear variation show the same pattern of population structure.
ACKNOWLEDGEMENTS
We gratefully acknowledge the assistance of Mr Abderrahman Saidan and Mr Ali Elouaer in the collection of the samples from Sfax and from Zarzis respectively.