

There is widespread recognition that quality of life measurement makes an important contribution to understanding outcomes in health care and rehabilitation (The WHOQOL Group, 1995; Skevington & McCrate, Reference Skevington and McCrate2011). Within traumatic brain injury (TBI) rehabilitation, there is a strong focus on optimising quality of life. The measurement of an individual's quality of life following TBI provides an important indicator of their progress with rehabilitation and other outcomes (Diener, Reference Diener2000; Frisch, Reference Frisch and Maruish2004, Reference Frisch2005; Lazarus, Reference Lazarus1991). Depression is a common sequelae to TBI, and is often related to poorer QOL (Corrigan, Bogner, Mysiw, Clinchot, & Fugate, Reference Corrigan, Bogner, Mysiw, Clinchot and Fugate2001; Skilbeck, Holm, Slatyer, Thomas, & Bell, Reference Skilbeck, Holm, Slatyer, Thomas and Bell2011; Vickery, Gontkovsky, Wallace, & Caroselli, Reference Vickery, Gontkovsky, Wallace and Caroselli2006). The current study will investigate these matters by first identifying key domains of a commonly used measure of QOL, the Quality of Life Inventory (QOLI, Frisch, Reference Frisch1994), and second, investigating the ability of the QOLI to identify people with significant depression symptoms, when domain scores are systematically removed. The latter analyses will be conducted with two separate samples, one a normal population sample and the other consisting of adults with TBI.
There are various ways to conceptualise and measure quality of life in TBI. For instance, it has been suggested quality of life can be determined by an objective summation of factors thought to contribute to a ‘good’ life, such as employment, health and relationships with friends and family. Related to this is the health-related approach to QOL, which quantifies QOL in relation to a particular health condition. An example of a health-related quality of life measure developed specifically for application to TBI is the Quality of Life after Brain Injury (QOLIBRI, von Steinbüchel et al., Reference von Steinbüchel2010). A further approach to conceptualising QOL focusses on the ‘insider's’ perspective (Brown & Gordon, Reference Brown and Gordon1999). This approach seeks to measure life satisfaction as perceived by the relevant individual (for comprehensive reviews, please see Dijkers, Reference Dijkers2004; Frisch, Reference Frisch2005). This subjective approach to quality of life measurement equates quality of life with subjective wellbeing. Subjective quality of life (SQOL) measures ask respondents to rate their satisfaction with essential aspects of their lives. Ratings on these measures provide a greater understanding of an individual's perception of the fulfilment of their objectives, expectations, needs and desires, as well as enabling them to report their own sense of wellbeing and satisfaction (Berger, Leven, Pirente, Bouillon, & Neugebauer, Reference Berger, Leven, Pirente, Bouillon and Neugebauer1999; Brown & Vandergoot, Reference Brown and Vandergoot1998; Johnson & Miklos, Reference Johnson and Miklos2002; Kalpakjian, Lam, Toussaint, & Hansen Merbitz, Reference Kalpakjian, Lam, Toussaint and Hansen Merbitz2004).
There are some important considerations in selecting SQOL measures for use in the TBI rehabilitation context (reviewed in detail elsewhere, for instance, see Thomas, Skilbeck, & Slatyer, Reference Thomas, Skilbeck and Slatyer2009). In summary, key points include choosing a measure that utilises a concise, self-explanatory design which appropriately engages and focusses the respondent, a preference for a multi-dimensional or domain-based approach to scale design over a global or single item approach, and evidence that the scale's psychometric properties are adequate within the TBI rehabilitation context.
The Quality of Life Inventory (QOLI, Reference FrischFrisch 1994)
One well-developed scale which meets these criteria is the QOLI (Frisch, Reference Frisch1994, Reference Frisch1998, Reference Frisch and Maruish2004). This measure was developed in the US for use in medical and mental health contexts, in line with a theoretical model that argued individuals’ appraisals of satisfaction with aspects of their lives were a result of inter-relations between quality of life, wellbeing and both positive and negative affect (see review by Diener, Suh, Lucas, & Smith, Reference Diener, Suh, Lucas and Smith1999). Quality of life therapy was developed from this theoretical basis and has since been used to treat depression (Frisch, Reference Frisch1994, Reference Frisch1998, Reference Frisch, Clark, Rouse, Rudd, Paweleck, Greenstone and Kopplin2005; Grant, Salcedo, Linda, Michael, & Puster, Reference Grant, Salcedo, Linda, Michael and Puster1995).
The QOLI measures life satisfaction across 16 domains, namely health, self-esteem, goals and values, money, work, play, learning, creativity, helping, love, friends, children, relatives, home, neighbourhood and community. Respondents’ perceptions of the relative importance of each domain are rated either 0 = not important, 1 = important or 2 = extremely important. Respondents rate their satisfaction with each domain from −3 = extremely dissatisfied to +3 = extremely satisfied. QOLI total scores are calculated by multiplying importance scores by satisfaction scores for each domain and then taking an average of all non-zero domain scores. Possible QOLI total scores therefore range from −6 to 6 and may be compared with normative distributions (Frisch, Reference Frisch1994; Thomas et al., Reference Thomas, Skilbeck and Slatyer2009).
The QOLI has been used in a number of clinical and research contexts to measure outcomes in relation to treatment of psychopathology and adjustment following illness or injury, including TBI (e.g., Almlov et al., Reference Almlov, Carlbring, Källqvist, Paxling, Cuijpers and Andersson2011; Angstman, Schuldberg, Harris, Cochran, & Peterson, Reference Angstman, Schuldberg, Harris, Cochran and Peterson2009; Forman, Herbert, Moitra, Yeomans, & Geller, Reference Forman, Herbert, Moitra, Yeomans and Geller2007; Thomas, Reference Thomas2004; Woody & Adessky, Reference Woody and Adessky2003). Life satisfaction as measured by the QOLI has been shown to be an important predictor of functional outcomes such as retention in tertiary education, workplace functioning (Frisch et al., Reference Frisch, Clark, Rouse, Rudd, Paweleck, Greenstone and Kopplin2005) and recovery from injury (Slatyer, Skilbeck, Langley, Johnson, & Bell, Reference Slatyer, Skilbeck, Langley, Johnson and Bell2008). The QOLI's structure and basic psychometric properties have been investigated in the Australian context in both general community and TBI rehabilitation samples (Thomas, McGrath, & Skilbeck, Reference Thomas, McGrath and Skilbeck2012; Thomas et al., Reference Thomas, Skilbeck and Slatyer2009).
The Psychometric Properties of the QOLI
The QOLI's psychometric properties have been consistently shown to be sound. The initial standardisation study, based on 798 adult participants in the US, found reasonable internal consistency (α = .79, and test–retest reliability, r = .73), as well as acceptable convergent and discriminative validity (Frisch, Reference Frisch1994). The instrument was found to be significantly correlated with the Satisfaction with Life Scale (SWLS, Diener, Emmons, Larsen, & Griffith, Reference Diener, Emmons, Larsen and Griffith1985, r = .56) and the Quality of Life Index (QLI, Ferrans & Powers, Reference Ferrans and Powers1985, r = .75). Our recent Australian check-norming study observed similar results, with good internal consistency (α = .83), and test–retest reliability (r = .84, Thomas et al., Reference Thomas, McGrath and Skilbeck2012). We also found the QOLI to be significantly correlated with the QLI and the SWLS (r = .74 and .58, respectively). In addition, we observed significant and negative correlations with the subscales of the Depression, Anxiety and Stress Scale (DASS), a widely used measure of depression (r = -.54, anxiety, r = -.23 and stress, r = −.35).
In his conceptual model explaining determinants of subjective wellbeing, Frisch (Reference Frisch1994,Reference Frisch1998) argued life satisfaction (or SQOL) has a two-way relationship with affect. When mood is positive, ratings of life satisfaction are generally increased, whereas individuals with depression report poorer life satisfaction. This relationship has been confirmed in several studies, which have found a strong negative relationship between depression and SQOL ratings. For example, an early study by Abbey and Andrews (Reference Abbey and Andrews1985) showed depression accounted for almost 50% of the variance in SQOL, in a large sample taken from the general population. A more recent study by Vickery, Gontkovsky and Caroselli (Reference Vickery, Gontkovsky and Caroselli2005) reported a strong correlation between the Beck Depression Inventory and QOLI, in a sample of adults with TBI (r = .67, p < .01). Large studies of outcome following TBI have shown that presence or absence of depressed mood following TBI was strongly related to SQOL outcome (Corrigan et al., Reference Corrigan, Bogner, Mysiw, Clinchot and Fugate2001; Kreuter et al., Reference Kreuter, Sullivan, Dahloff and Siosteen1998). The results of this research point to the likelihood that the robust relationship between depression and SQOL may be clinically useful in that poorer SQOL may indicate problems with wellbeing including significant depression.
The Problem of Missing QOLI Data
It is relatively common in clinical practice and research for respondents not to provide responses on some QOLI domains and to rate some domains as being unimportant to their happiness. Whilst this can occur on any QOLI domain, one example from our research with adults with TBI has shown that many young single males have been disinclined to rate the importance of children to their happiness, or may rate this as unimportant (Thomas et al., Reference Thomas, Skilbeck and Slatyer2009). The QOLI manual states the instrument is considered invalid if two or more domains lack a Satisfaction rating, an Importance rating, or both. An exception is made where respondents have no living relatives, in which case the response for this domain is set to zero and the respondent's QOLI total score is only considered invalid if responses are omitted for two further domains (Frisch, Reference Frisch1994, page 20–21).
Whilst clinicians who observe these guidelines may be faced with a significant number of unusable QOLI total scores, there appears to be no published empirical justification for these rules. No research has been conducted, for instance, that tests whether the systematic removal of domains from the QOLI compromises its psychometric properties. As well as selecting QOLI domains based on the amount of variance they account for in another similar SQOL measure, it would also be useful to examine the ability of QOLI scores, derived from reduced numbers of domains, in identifying clinical issues such as depression. Conceivably, if a number of QOLI domains were found to be less important in predicting overall life satisfaction, this would mean that strict observation of the original validity guidelines could be relaxed. The aims of the present study therefore were to:
-
1. identify whether a subset of QOLI domain scores could account for equivalent variance in quality of life as the full 16-domain QOLI scale;
-
2. investigate the sensitivity of this subset of QOLI domain scores in correctly identifying individuals with depression in both a non-clinical community-based sample and a sample of adults with TBI.
Method
Participants
Two samples were utilised in the current study. The first was a non-clinical sample of 259 community-dwelling adults in Australia. The data from this convenience sample were collected by undergraduate psychology students, as part of their course requirements. Fifty four percent (54%) of this sample were female. The mean age of the sample was 48.75 years (SD = 17.51), ranging from 18.04 to 91.04 years. Further details about this study and the method used to collect the data can be seen in Thomas et al. (Reference Thomas, McGrath and Skilbeck2012).
The second was a subsample taken from a larger sample of adults who had suffered a TBI 12 months prior to assessment. Data from the clinical sample were collected by the Neurotrauma Register of Tasmania (NTR), as part of the NTR's prospective outcome research programme. A further description of this population-based research project is presented elsewhere (please see Langley, Johnson, Slatyer, Skilbeck, & Thomas, Reference Langley, Johnson, Slatyer, Skilbeck and Thomas2010). The subsample utilised in the present study included 144 adults, of whom 59% were male. The mean age was 39.79 years (SD = 15.83, ranging from 18.25 to 79.33 years). Those in this sample suffered a range of severity of TBI from <1 hour to 42 days of post traumatic amnesia (PTA, Mean = 1.95 days, SD = 5.76 days), with 46.50% of the sample having suffered a mild TBI (<1 hour of PTA). The TBI sample were both younger (t = 5.09, d = .51) and more likely to be male (χ 2 = 7.93, p = .005).
Measures
The QOLI (Frisch, Reference Frisch1994) is a 16-item importance-weighted measure of quality of life. Details on the construction, administration and psychometric properties of this scale are described above.
The QLI (Ferrans & Powers, Reference Ferrans and Powers1985, Reference Ferrans and Powers1992) is a well-developed 66-item measure of SQOL. It has been translated into various languages including Spanish, Norwegian and Arabic and used with a variety of clinical populations focussing on physical and mental health issues such as diabetes, cancer, stroke, depression and anxiety disorders (e.g., Can, Durna, & Aydiner, Reference Can, Durna and Aydiner2010; Ferrans, Reference Ferrans2010; Gullberg, Hollman-Frisman, & Ek, Reference Gullberg, Hollman-Frisman and Ek2010; Halabi, Reference Halabi2006).
The QLI has two sections. The first section measures satisfaction with life whilst the second section measures the importance of each of these items to the respondent. There are 33 items in each section. Items are scored on a 6-point ordinal response scales ranging from ‘very dissatisfied’ = 1 to ‘very satisfied = 6 for the satisfaction section, and from ‘very unimportant’ = 1 to ‘very important’ = 6 for the importance section. The overall quality of life scores are calculated by weighting each satisfaction response with its paired importance response. Following the scoring guidelines, the possible range for the overall QLI score is from 0 to 30. Higher scores indicate better quality of life.
Research has demonstrated the QLI has excellent psychometric properties. Initial test development showed the QLI had very good internal consistency and temporal stability (α = .93 for a sample of undergraduates and .90 for dialysis patients, test–retest reliability r = .81, Ferrans & Powers, Reference Ferrans and Powers1985). Subsequent research has replicated these findings (e.g., Gullberg et al., Reference Gullberg, Hollman-Frisman and Ek2010). The QLI was selected as a measure of convergent validity in Frisch's QOLI standardisation study (Frisch, Reference Frisch1994). Correlations between the QLI and QOLI have been reported to be strong, r = .75 (Frisch, Reference Frisch1994; Thomas et al., Reference Thomas, McGrath and Skilbeck2012). In the present study, the total scale score of the QLI was used as a dependent variable in regression analyses which identified the key domains of the QOLI.
The DASS 21 (Antony, Bieling, Cox, Enns, & Swinson, Reference Antony, Bieling, Cox, Enns and Swinson1998; Lovibond & Lovibond, Reference Lovibond and Lovibond1993) is the 21-item short form of the DASS 42-item self-report scale. It asks participants to indicate the presence of symptoms of depression, anxiety and stress in the past week on a four-point scale from 0 = did not apply to me at all to 3 = applied very much/most of the time. Only the Depression subscale was used in the current study. The total possible range of DASS 21 depression scores is 0 to 21.
A study by Henry and Crawford (Reference Henry and Crawford2005) involving 1794 non-clinical British adults, demonstrated this scale had excellent internal consistency, α = .88, and adequate convergent validity with the Hospital Anxiety and Depression Scale, (HADS, Zigmond & Snaith, Reference Zigmond and Snaith1983) Depression subscale. The DASS 21 depression scale was used in the present study to analyse the sensitivity with which the QOLI items could distinguish people suffering from more severe depression symptoms in the general community sample.
The HADS (Snaith & Zigmond, Reference Snaith and Zigmond1994; Zigmond & Snaith, Reference Zigmond and Snaith1983) is a 14-item, symptom-based measure of depression and anxiety. Participants rate responses on a four-point scale from 0 = no problems to 3 = most severe or most frequent problems. Only the seven depression-scale items were used in the current study. The range of the HADS total score is 0 to 21. The psychometric properties of the HADS have been demonstrated to be acceptable across a large number of studies (e.g., Bjelland, Dahl, Haug, & Neckelmann, Reference Bjelland, Dahl, Haug and Neckelmann2002; Snaith & Zigmond, Reference Snaith and Zigmond1994). The HADS depression scale has been shown to have sound internal consistency, α = .67 to .90 (Bjelland et al., Reference Bjelland, Dahl, Haug and Neckelmann2002), and acceptable convergent validity (Crawford, Henry, Crombie, & Taylor, Reference Crawford, Henry, Crombie and Taylor2001; Henry & Crawford, Reference Henry and Crawford2005). The HADS depression scale was used in the present study to test the sensitivity of the QOLI in identifying participants with depression in the TBI sample.
Procedure and Analyses
Ethical approval was gained from the School of Psychology Human Research Ethics Committee at Charles Sturt University, to collect data for the non-clinical sample. Information sheets and the survey forms were then distributed to a convenience sample of community-dwelling adults. These participants returned written surveys in self-addressed envelopes, which were entered to the database for this part of the study. Approval was gained from the Southern Tasmania Health and Medical Human Research Ethics Committee to collect data for the TBI sample.
Analyses were conducted in two main stages. Our first aim was to identify whether a subset of QOLI domain scores could account for equivalent variance in quality of life as the full 16-domain QOLI scale. To this end, using the full community sample (n = 259), the 16 domains of the QOLI were regressed against the QLI total scores. Non-significant domains, using a p value of .10, were then removed from the analyses and a second model was run using the remaining domains. The variance accounted for by each model was then compared. If the resulting F statistic was non-significant, it could be concluded that the reduced model accounted for as much variance as the full model, indicating equivalence in ability to predict QLI scores.
Our second aim was to investigate the sensitivity of these QOLI domain scores in correctly identifying individuals with depression. Here, the results of the regression analyses were used to construct a number of new variables. The first was the QOLI total score derived from all 16-domain scores. Domains were then removed in order of significance, with the poorest predictor of the QLI removed first to create a 15-domain QOLI total score, and so on. We first examined Pearson product moment correlations between these new variables and the Depression categorisation from the DASS. We then tested the extent to which these scores were able to distinguish participants with depression using receiver operating characteristic (ROC) curve analyses. In these analyses, only the data from participants who returned complete responses to all QOLI domains (i.e., those without missing domain scores) were included. This was done for both the community sample (n = 146) and TBI sample (n = 144).
The ROC curve plots true-positives (i.e., those predicted to be suffering depression, who in fact met criteria by rating items above the cut-off on a depression scale), against false-positives (those predicted to be suffering from depression, who did not meet criteria), for all possible cutting values of the predictive measure. The resulting area under the curve (AUC) is a useful and often reported index of predictive accuracy (Rice & Harris, Reference Rice and Harris1995). It can be interpreted as the likelihood that a randomly selected depressed individual will score lower on the QOLI than another randomly selected non-depressed individual. The statistic takes a value between .5 and 1.0. A score greater than or equal to .9 provides ‘outstanding’ discrimination, scores between .8 and .9 provide ‘excellent’ discrimination, scores between .7 and .8 provide ‘acceptable’ discrimination and models yielding AUC scores equal to .5 predict the outcome at no better than chance (Hosmer & Lemeshow, Reference Hosmer and Lemeshow2000).
Our strategy in conducting these analyses was to first identify a minimum number of QOLI domains with equivalent ability to predict QLI scores to the full 16-domain instrument in our sample of healthy Australian adults, and second, to identify the extent to which these reduced domains could identify depression cases. We then tested whether this set of QOLI domains could identify depression cases in a different sample of adults with TBI. Our aim in using these two samples was to determine the robustness of our findings across heterogeneous samples with different measures of depression.
Results
The results are presented in four sections. First, the distributions of the QOLI domain scores and QLI total score are presented. Second, the proportion of zero-rated importance scores is examined across the QOLI domains within the community sample. Third, bivariate relationships between QOLI domain scores and the QLI Total score and the results of regression modelling, in which the QOLI domain scores which best predicted QLI total scores, are presented. Fourth, the sensitivity of 10 different QOLI scores in detecting depression are compared. These QOLI scores were derived by systematically eliminating the nine domains shown to be weakest predictors of QLI total scores.
The Distributions of the QOLI Domain Scores and QLI Total Scores
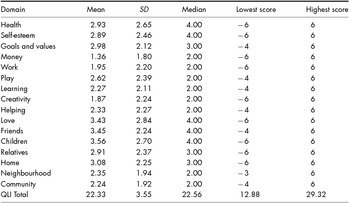
Table 1 shows means and standard deviations for each of the QOLI domain scores and the QLI total score. The QOLI domain scores ranged from a possible −6.00 to 6.00. However, many QOLI domain scores ranged from −3.00 or −4.00 to 6.00. The QLI Total score has a possible range of 0 to 30.00. Results in Table 1 showed the QLI Total scores in the current sample ranged from 12.88 to 29.33, with the median score of 22.56 close to the mean 22.33.
Distributions of QOLI Domain Scores and QLI Total Score (Community Sample, n = 259)

Frequencies of Zero Ratings for QOLI Importance Scores
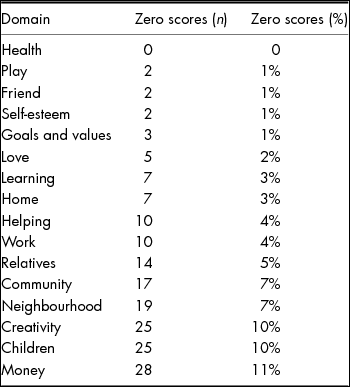
The three domains rated most important for quality of life were Health, Play and Friends, whereas the three rated least important were Creativity, Children and Money. Table 2 has full details in this regard.
Frequency of Zero-Rated Importance Scores across QOLI Domains (Community Sample, n = 259)

Predicting QLI Scores from the QOLI Domains
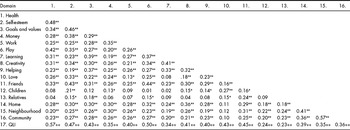
All individual QOLI domain scores were significantly correlated with the QLI Total score on a bivariate basis (r ranged from .23 to .57, see Table 3). None of the inter-correlations between domain scores were high enough to raise concerns about multi-collinearity, with VIF statistics ranging from 1.30 to 1.80.
Bivariate Intercorrelations between QOLI Domain Scores and the QLI Total Score (Community Sample, n = 259)

*p < .05, **p < .01
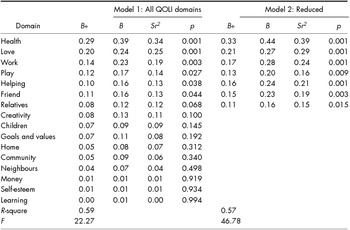
Two models were then tested using linear regression. The first regressed all 16-QOLI domain scores against the QLI total score. Subsequently, domains were systematically omitted in order of significance (with the weakest predictor removed first). A 7-domain model comprising Health, Love, Work, Play, Helping, Friends and Relatives was found to account for equivalent variance to the full 16-domain model (Incr F 7 = 95.59, p = .624). Omitting Relatives led to a significant loss of variance (Incr F 6 = 811.44, p < .001). The 7-domain model was therefore accepted as the final model predicting QLI scores. Table 4 shows the results of the two regression models.
Regression Coefficients for Individual QOLI Domains Predicting QLI Scores, (Community Sample, n = 259)

Identifying Depression using Correlational and ROC Analyses
The second aim of this study was to investigate the sensitivity of the QOLI domain scores, identified in the previous analyses, in correctly identifying individuals with depression. Analyses proceeded as follows. First, a subsample of participants with 16 non-zero domain scores were selected and compared with the larger sample. Second, the results of correlations and ROC analyses for 10 QOLI scores of participants within the community subsample and a separate sample of participants with TBI were compared.
The aim of the following analyses was to compare the sensitivity of the QOLI total score comprising all 16 domains with new QOLI variables, based on the results of the regression models reported previously. This comparison required selection of a subsample of participants who returned 16-non-zero QOLI domain scores. Using these criterion, a subsample of n = 146 was selected from the 259 participants in the community sample.
This subsample was compared with the remainder of the sample on age, gender, QOLI, QLI and depression scores. The subsample (n = 146) were older (M = 50.8, SD = 16.58) than the full sample (M = 46.1, SD = 18.38, t257 = −2.57, p = .031). However, no other differences were observed between the two groups on demographic variables. Data from this subsample were used to construct nine new QOLI scores, so that comparisons could be made between the QOLI total score comprising all 16 domains and these new QOLI variables.
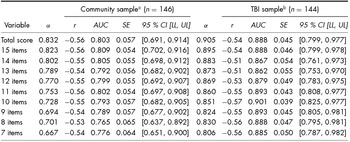
The first of the new QOLI variables comprised an additive total of the 15-QOLI domain scores that best predicted the QLI (i.e., omitting Learning, which was the poorest predictor in these analyses). The 14-domain variable omitted both Learning and Self-esteem, the 13-domain variable omitted these two and Money, the 12-domain variable omitted in addition Neighbours, the 11-domain variable omitted Community, the 10-domain variable omitted Home, the 9-domain variable omitted Goals and Values, the 8-domain model omitted Children and finally the 7-domain model omitted Creativity (see Table 5).
ROC Analyses in Two Samples Showing the QOLI's Sensitivity to Identifying Individuals with Depression

Note: a DASS 21 cut-score 97th percentile. b HADS cut-score 97th percentile.
QOLI domains were removed in the following order to create the new variables: Learning; Self-esteem; Money; Neighbours; Community; Home; Goals; Children; Creativity
All correlations and AUC are significant (p < .001).
The mean DASS21 depression score in the community subsample was 6.15 (SD = 7.03). Pearson product moment correlations between this variable and the 10 QOLI variables described above ranged from −.53 to −.56. For the ROC analyses, an individual was classified as depressed if they scored above 13 on the DASS21 depression scale, which approximates the 97th percentile (severe range) in a community sample (Henry & Crawford, Reference Henry and Crawford2005). A total of 23 individuals (15.8%) in the community subsample met this criterion. Results of these ROC analyses are reported in Table 5.
The results reported in Table 5 showed the instrument had excellent discriminative ability for depression in the community sample, with an AUC of .803 (95% CI .691, .914) for the QOLI total score and AUCs ranging between .809 (95% CI .702, .916) for the 15-domain variable, to .776 (95% CI .651, .900) for the 7-domain variable. All confidence intervals overlapped, indicating that these variables had equivalent ability to discriminate between individuals with and without depression. In effect, we interpret these findings to show the values are unable to be distinguished statistically.
The TBI sample comprised 144 participants who returned 16-non-zero QOLI domain scores. The mean depression score on the HADS in the TBI sample was 3.22 (SD = 3.85). Table 5 shows Pearson product moment correlations between this score and the QOLI total score and reduced QOLI scores ranged from -.57 for the 10-domain score to -.51 for the 14-domain score.
In relation to cut-off scores for depression in the TBI sample, Bjelland et al. (Reference Bjelland, Dahl, Haug and Neckelmann2002) reported most studies had found a good balance of sensitivity and specificity for identifying those with depression .80, with a cut-off score of 8 or more on the HADS depression scale. However, Crawford et al. (Reference Crawford, Henry, Crombie and Taylor2001) recommended a higher cut-off score of 11 or more, because the proportion of people in normative studies rating depression symptoms above a score of 8 is much greater than the prevalence of depression in the general community (11.4%, Horwath & Weissman, Reference Horwath, Weissman, Kessler, Tsuang, Tohen and Zahner1995). In the present study, the cut-off score for determining whether an individual was grouped as depressed was set at a score of 11 or more. This approximated the 97th percentile in a community sample (Crawford et al., Reference Corrigan, Bogner, Mysiw, Clinchot and Fugate2001). A total of 26 individuals (18.1%) were classified as depressed using this criterion.
Table 5 shows the QOLI has good ability to identify people with depression in this sample. AUCs ranged from .901 for the 10-domain variable to .862 for the 13-domain variable, but were essentially identical for all 10 QOLI total scores, as all confidence intervals overlapped. In addition, the internal consistency of the instrument remained sound when domains were removed in both the community and TBI sample (community sample from α =.67 to .83 and TBI sample from α = .81 to .91).
Discussion
The aims of the present study were first, to identify whether a subset of QOLI domain scores could account for equivalent variance in quality of life as the full 16-domain QOLI scale. Second, we aimed to investigate the sensitivity of this subset of QOLI domain scores in correctly identifying individuals with depression. Overall, the results of the analyses suggested that the QOLI appeared considerably more robust than the validity guidelines provided in the QOLI manual suggested (Frisch, Reference Frisch1994). The present study sought to address the apparent lack of empirical evidence for the guidelines in the scale's manual. These results will be relevant to clinicians and clinical researchers who are faced with problems concerning management of missing QOLI data.
In relation to the first aim, correlations between QOLI items showed a large proportion of moderate to strong inter-relationships. This suggested that whilst no particular items appeared redundant, there was a reasonable amount of shared variance between items. Not surprisingly then, regression analyses identified a group of 7-QOLI domains which accounted for similar amounts of variance in QLI total scores as the full 16-QOLI domains. Within our sample, the following domains were found to be the most important determinants of quality of life: Health, Love, Work, Play, Helping, Friends and Relatives. This suggested there may be some domains of the QOLI which are more important than others in determining overall quality of life. We found the Health, Love and Work domains of the QOLI to be the strongest predictors of overall SQOL as measured by the QLI in our sample of community-dwelling adults. These findings are consistent with previous research, which also found these to be key domains (see Diener, Reference Diener2000; Fayers & Machin, Reference Fayers and Machin2013).
It seems likely that there may be differences in circumstances and values of people within particular sections of the community, which would result in different combinations of QOLI domains explaining quality of life. For example, adolescents, people from particular cultural backgrounds and people within various clinical groups may be likely to value aspects of some domains more than others and in different ways to other groups. Due to small sample sizes, the results of the present study could not be generalised to provide a definitive list of the most important QOLI domains. However, these results raise the interesting prospect of the relative importance of some domains over others in particular sections of the community and the need for further research to understand these differences.
A particular strength of our approach to determining whether the psychometric properties of the QOLI were compromised with the removal of domains was in the procedure adopted to address our second aim. This included examining correlations between QOLI and depression scores in both a community sample and again in a TBI sample. We found a consistently strong relationship between depression and the QOLI variables, regardless how many domain scores were present. We then compared the sensitivity of the QOLI scores, which had domains systematically removed, in identifying people suffering from depression in each of the two samples. Whilst different measures of depression were used in each sample, the cut-off scores we selected to identify participants with depression were shown to approximate the same point in the measures’ normative distributions (Crawford et al., Reference Crawford, Henry, Crombie and Taylor2001; Henry & Crawford, Reference Henry and Crawford2005). The results showed that with as few as seven of the 16 domains, the QOLI score was able to discriminate those with and without depression, with sensitivity equivalent to the full 16-domain QOLI total score. This indicated that as few as 7-QOLI domains appeared to capture sufficient information to represent quality of life and sensitively discriminate depression within both our community and TBI subsamples. The consistent results observed between heterogeneous samples and even with the use of different measures of depression suggests the QOLI is likely to be more robust to missing data than previously assumed.
Limitations and Directions for Future Research
It is acknowledged that these results may not be easily generalised beyond these relatively small subsamples, which were selected to allow the systematic removal of domain scores. Additionally, depression was measured in the community and TBI samples with two different scales (HADS and DASS 21), which were normed with different samples. Although this was not optimal, in that it prevents direct comparison of the results of the two ROC analyses, we selected a cut point for identifying participants with depression at equivalent points in the scales’ normative samples (at the 97th percentile).
Rather than directly comparing the results of the ROC analyses between the two groups, this study aimed to replicate the ROC analyses with a second independent sample. Given we were limited in not having access to data for the two groups which utilised the same depression scale, this is a particular strength of the design of the current study. The results provide some confidence that QOLI scores are likely to remain valid reflections of respondent's quality of life with more than two or three domain scores missing. As such, the results of the current study provide preliminary evidence suggesting the validity guidelines presented in the QOLI manual (Frisch, Reference Frisch1994) may be too conservative.
Some characteristics of the sample of community-dwelling adults may have influenced the findings. For example, a large proportion of participants in the community-dwelling sample were well educated and from higher socioeconomic backgrounds. This might have contributed to the finding that the domain Money was unrelated to life satisfaction. Further, some demographic differences were observed between the community and TBI samples. As might be expected, the TBI sample was younger and had more males (Hillier, Hiller, & Metzer, Reference Hillier, Hiller and Metzer1997; Tate, McDonald, & Lulham, Reference Tate, McDonald and Lulham1998).
On the basis of the results of the present study, future research with large representative samples of adults and adolescents within the general community and specific clinical groups seems warranted. This could lead to empirically based guidelines for managing missing QOLI domains. More broadly, an interesting and important direction for future research could lead to a comprehensive mapping of aspects of quality of life across various groups in the community. This may assist in developing new scales and interventions.
In conclusion, the current study identified 7-QOLI domains that were equally effective in explaining quality of life as the full 16-domain QOLI total score and were also sensitive in determining depression status in two separate samples. These findings suggested that strict observation of the validity guidelines as stated in the QOLI manual is unnecessary, and might in fact result in the loss of usable data. This study demonstrated that the instrument is more robust to missing domain scores than was previously assumed. Future research could identify and map core domains of quality of life in larger representative samples of people with TBI and other neuropathology.
Financial Support
This research received no specific grant from any funding agency, commercial or not-for-profit sectors.
Conflict of Interest
None.
Ethical Standards
The authors assert that all procedures contributing to this work comply with the ethical standards of the relevant national and institutional committees on human experimentation and with the Helsinki Declaration of 1975, as revised in 2008.
Acknowledgements
We would like to thank Fiona Boyle, Rita Jenkins, John Kearney, Steve Mollet and Sean Rayner for their contributions to data collection, as part of their fourth year Psychology research projects. We are also most grateful to the participants in this project and for the ongoing collaboration with the Neurotrauma Register of Tasmania.