




No CrossRef data available.
Article contents
Hope in the general Norwegian population, measured using the Herth Hope Index
Published online by Cambridge University Press: 01 December 2003
Abstract
Objective: The aims of this study were to describe hope in a large sample that was drawn from the general Norwegian population and to examine how sociodemographic and health-related variables were related to hope.
Methods: Of 4,000 adult citizens, randomly drawn from the National Register, 1,912 (49%) returned the Norwegian version of the Herth Hope Index (HHI).
Results: When demographic and health-related variables were controlled for, age, gender, marital status, and employment status were significantly related to hope. The most important health-related variable was self-assessed health status, with participants who were satisfied with their health reporting significantly higher levels of hope. Participants who indicated that they had a chronic disease reported significantly higher hope scores compared to those without a chronic disease. Older men, individuals who were receiving a pension or were unemployed, and individuals who were widowed or unmarried reported the lowest levels of hope. In this study, an individual's subjective evaluation of his/her health was the most important health-related predictor of hope.
Significance of the research: The most important health-related variable that predicted hope was self-assessed health in that participants who were satisfied with their health reported higher levels of hope. This finding suggests that an individual's subjective assessment of health is a better predictor of hope than the presence a chronic disease. Knowledge about levels of hope in the general population can be used as reference values against which an individual score or a group mean may be compared.
Information
- Type
- Research Article
- Information
- Copyright
- © 2003 Cambridge University Press
INTRODUCTION
Knowledge about levels of hope in the general population can be used as reference values against which an individual score or a group mean may be compared. A description of levels of hope in general populations is important for a number of reasons. First, these reference values can be used to interpret the findings from descriptive, correlational studies as well as to interpret the clinical significance of observed changes in hope in prospective studies. For example, in order to compare the findings from studies on hope in a variety of patient populations, normative values from the general population are needed to provide a context (Fayers, 2001). In addition, because a sample from a population-based study is randomly selected, it allows for an examination of differences in hopes that are associated with demographic or health-related variables. To our knowledge, levels of hope in the general population have not been described previously. Most of the studies on hope in healthy samples were done with students (Miller & Powers, 1988; Snyder et al., 1991; Jakobsson et al., 1993).
Hope is a general phenomenon important for all humans throughout life (Fromm, 1970). Hope is defined as a multidimensional dynamic life force that is characterized by a confident yet uncertain expectation of achieving good, which is realistically possible and personally significant (Dufault & Martocchio, 1985). According to Dufault and Martocchio, hope is made up of six different dimensions (i.e., contextual, affective, temporal, affiliative, behavioral, and cognitive).
A meta-analysis of the research on hope (Kylma & Vehvilainen-Julkunen, 1997) noted that hope was described by study participants as a powerful resource, a belief in opportunities, and a way out of difficulties. The concept of hope is by its nature future oriented, and the presence of hope is an important factor in not giving up (Travelbee, 1966). Hope is described as enabling people to deal with situations when needs and goals are not met (Lynch, 1974). In addition, hope is viewed as a common element of a process used to varying degrees by most people to cope with daily life (Snyder et al., 1999).
In two studies that evaluated hope in healthy adults (Miller & Powers, 1988; Jakobsson et al., 1993), a high level of hope was described. One limitation of both of these studies was that ratings of hope from healthy individuals were not compared with individuals who reported ill health. Therefore, it is difficult to place the high level of hope within a larger context. Studies that compared levels of hope in college students with individuals in psychological treatment found that those in psychological treatment reported lower levels of hope than college students (Snyder et al., 1991; Snyder, 1995).
How levels of hope vary in individuals with chronic illnesses is unclear. However, Nowotny (1989) suggested that a person's level of hope changes over time or as situations change. For example, a chronic or serious illness may increase or decrease an individual's level of hope. Poor health or an acute or chronic illness may serve as a threat to hope because a serious illness may make the future uncertain or may change an individual's way of life.
On the other hand, the presence of an acute or chronic illness may not change an individual's level of hope. For example, no statistically significant differences were found in ratings of hope between patients with cancer and patients with other chronic illnesses (Raleigh, 1992). The majority of patients, in both groups, reported positive attitudes about their illnesses, but did describe transient periods of lowered hope related to their illness. In another study (Ballard et al., 1997), no differences in levels of hope were found between patients with newly diagnosed or recurrent cancer. These findings challenge our understanding of the meaning of hope and how hope may be affected by the presence of acute and chronic illness. Given the limited amount of information on the impact of chronic illness on hope, this area warrants further investigation.
Another important way to characterize hope in the general population is to evaluate the impact of different demographic variables on hope. The relationships between various sociodemographic characteristics and hope have not been described in great detail. Two large, population-based studies (Snyder et al., 1991; Snyder, 1995) found no gender differences in levels of hope using the hope scale developed by Snyder et al. (1991). Findings from studies in a student population (Brackney & Westman, 1992), a community sample (Tanaka, 1998), and the general population (Greene, 1981) confirm a lack of gender differences in ratings of hope. In addition, Herth (1992) found, using the Herth Hope Index, that hope scores were not related to gender, educational level, race, or age. However, marital status, diagnosis, duration of illness, and income were associated with different levels of hope (Herth, 1992). Married individuals had higher levels of hope and individuals with lower incomes reported higher levels of hope. With respect to diagnosis, patients with AIDS had lower levels of hope than patients with other diseases. Finally, patients who reported an illness of greater than one year's duration had lower levels of hope compared to those with illnesses of shorter duration (Herth, 1992).
In a study that measured hope in newly diagnosed cancer patients, using the Nowotny Hope Scale (Rustøen & Wiklund, 2000), the most significant variable that was related to hope was whether or not the patient lived alone. Younger people in particular, who lived alone, reported lower levels of hope. Gender, length of time since diagnosis, and type of cancer treatment were not related to the global hope score.
To capture the dynamic nature of hope, a number of instruments have been developed to measure this concept (Kylma & Vehvilainen-Julkunen, 1997). In this study, the Herth Hope Index (Herth, 1992) was selected for use because the items are more general and more applicable to healthy populations.
The majority of the studies, done to date, that measured hope either used small samples of patients or were done in large samples of college students. As a result, very little information is available on levels of hope in the general population. Therefore, the purposes of this study were to describe hope in a large sample that was drawn from the Norwegian general population and to examine the associations between various sociodemographic and health-related variables and the participants' level of hope.
The following research questions were addressed in this investigation:
- What level of hope does the general Norwegian population report?
- Are the variables of age, gender, education, marital status, employment status, and coresidence related to hope in the general population?
- Are health-related variables such as chronic disease, frequency of illness or self-assessed health related to hope in the general population?
METHODS
Sample and Methods of Data Collection
A total of 4,000 Norwegian citizens, aged 19 to 81 years, were randomly drawn from the National Register by Statistics Norway. This National Register, established by the government in 1878, provides data for survey research that is representative of the entire Norwegian population. The participants were sent a questionnaire in November 2000. Individuals who did not respond within four weeks received one written reminder. Statistics Norway sent out the questionnaires (also the reminder) with an identification number and an envelope with the researchers' name and address for returning the completed questionnaires. In that way the questionnaires were anonymous to the researchers.
Instruments and Scoring Procedures
The questionnaires that were sent to study participants measured sociodemographic data, health indices, quality of life, fatigue, stress, pain, and hope. Only the sociodemographic data, health indices, and hope measure are presented in this article.
Sociodemographic Characteristics
This questionnaire obtained information on age, sex, marital status, education, coresidence, and employment status/source of income. The age variable was divided into three groups to separate younger adults (18 to 39 years) from middle-aged (40 to 64 years) and older (65 to 81 years) participants. The coresidence variable was grouped into living with a spouse, living with children without a spouse, living with siblings and/or other family members (not a spouse and/or children), living alone, or living with others. Statistics Norway supplied information about age, gender, marital status, and educational status for the eligible respondents who failed to return the questionnaires.
Health Indices
Questions in this section ascertained whether or not the person suffered from a chronic disease or frequently felt ill (yes or no). In addition, the questionnaire obtained information about past and current diseases, including myocardial infarction, angina pectoris, stroke, diabetes, cancer, osteoporosis, fibromyalgia, chronic pain disorder, rheumatoid arthritis, osteoarthritis, ankylosing spondylitis, musculoskeletal complaints, psychiatric disorders, gastrointestinal disorders, and asthma.
Self-assessed health was measured using one item from the 26-item World Health Organization Quality of Life instrument (the WHOQOL-BREF). The single item asked the individual to respond to the following question “How satisfied are you with your health?” using a 1 (very dissatisfied) to 5 (very satisfied) scale (WHOQOL Group, 1996, 1998).
Hope
Hope was measured using the Norwegian version of the Herth Hope Index (HHI-N). The HHI was selected for this study because it is short and easy to use (Herth, 1992) and is applicable to healthy populations.
The HHI is a shortened version of the Herth Hope Scale (Herth, 1992) and is based on the definition of hope developed by Dufault and Martocchio (1985). The HHI contains 12 items that measure various dimensions of hope using a 4-point Likert scale that ranges from strongly agree to strongly disagree. The scale gives one global score that ranges from 12 to 48, as well as single-item scores that range from 1 to 4 (Herth, 1992). The scale has been used widely in international studies. Construct validity (Herth, 1992), divergent validity (Gibson, 1999; Beckie et al., 2001), internal consistency (Lin et al., 2003) and test–retest correlations (Herth, 1992) were previously reported to be satisfactory in different samples.
The HHI was translated from English into Norwegian using internationally accepted guidelines (Guillemin et al., 1993). First, two independent translators translated the questionnaire from English into Norwegian. These versions were compared and then translated back into English by another translator. Finally, all of the versions were discussed with all the translators. Agreement was reached among the translators, and no modifications were made to the instrument before it was used in Norway. The HHI-N showed satisfactory reliability (Cronbach's alpha 0.81) and discriminated between different subgroups of participants (Rustøen et al., 2003).
Statistical Analysis
Data were analyzed using the SPSS for Windows (version 10.0) software (SPDD, Inc). Parametric statistics were used because of the continuous distribution of scores from the HHI-N and the large sample. Missing values in the HHI-N were replaced with the item's mean value if 20% or less of the items were missing for an individual's response.
One-way analyses of variance (ANOVA) were used to evaluate for differences in levels of hope among individuals with self-reported chronic diseases. The relationship between hope and various sociodemographic and disease-related variables was assessed by least-squares methods using linear (Pearson's r) and nonlinear (eta) measures of association. Then the General Linear Model (GLM) procedure in SPSS (UNIVARIATE) was used to estimate the multivariate, controlled association between hope and several demographic characteristics (i.e., sex, age groups, educational level, marital status, and employment status) and health-related variables (i.e., the presence of a chronic disease, frequently feeling ill, and self-assessed health). The multivariate analyses were performed in a hierarchical fashion, with sociodemographic variables entered first (block 1), followed by health-related variables (block 2). For categorical variables with more than two levels (i.e., marital status and employment status), dummy coding was performed. Linear, standardized regression coefficients could not be estimated for categorical variables, but sets of dummy variables were included in the regression equations. A systematic search for statistical interactions between independent variables in their association with hope was performed, but only minor deviations from additivity were detected; hence, no interaction effects will be reported. A p value of less than 0.05 was considered statistically significant.
RESULTS
Response Rate
Out of the 4,000 questionnaires sent out, 56 participants could not be contacted because of an unknown address or recent death (n = 41) or not being able to fill in questionnaires (n = 15). A total of 1,912 questionnaires were returned after the two mailings, which gave a response rate of 49% (1,912/3,944). Eighty-five percent of the 1,912 responses were returned prior to the second mailing. More females (52%) than males (48%) responded (Table 1). The lowest age-related response rates were found in men between 18 and 29 years of age (57%) and in women 70 years of age or older (56%).
Demographic characteristics of the sample and comparisons of the demographic characteristics of the responders (n = 1,912) and nonresponders (n = 2,047)

Based on the demographic data provided from the National Register by Statistics Norway, a comparison was done between responders and nonresponders. Differences between the responders and nonresponders are listed Table 1. Lower response rates were obtained from younger men, participants with less education, and participants who were unmarried.
Sample Characteristics
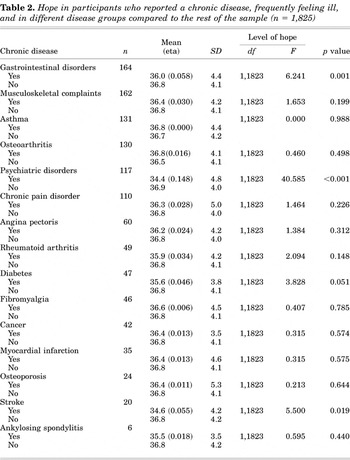
The majority of the sample were women (52%), married, and working for pay (Table 1). The mean age of the participants was 45.2 years (SD 16.0) with a range of age from 18 to 81 years. A total of 501 (27.9%) participants reported suffering from chronic diseases or having long-term health problems and 182 (10%) reported that they frequently felt ill (Table 2). The most common diseases reported by the participants (Table 2) were gastrointestinal diseases (8.9%), musculoskeletal problems (8.8%), osteoarthritis (7.5%), asthma (7.1%), psychiatric disorder (6.4%), and chronic pain disorder (5.9%).
Hope in participants who reported a chronic disease, frequently feeling ill, and in different disease groups compared to the rest of the sample (n = 1,825)

With respect to self-assessed health, 36 (1.9%) were very dissatisfied with their health, 205 (10.9%) were dissatisfied, 304 (16.1%) were neither satisfied nor dissatisfied, 936 (49.7%) were satisfied, and 405 (21.5%) were very satisfied.
Level of Hope
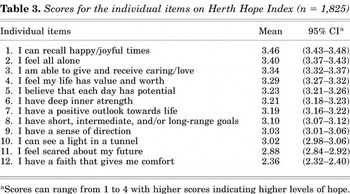
A total of 1,825 participants completed more than 80% of the items on the HHI-N. The mean global score on the HHI-N was 36.7 (SD 4.1, range 18–47). Scores on the individual items of the HHI-N are listed in Table 3.
Scores for the individual items on Herth Hope Index (n = 1,825)

Differences in Level of Hope and Various Chronic Diseases
An ANOVA demonstrated that individuals who reported a psychiatric disorder, a gastrointestinal disorder, and stroke had significantly lower global hope scores than those individuals with other chronic diseases (Table 2).
Relationships between Level of Hope and Various Sociodemographic Characteristics and Health-Related Variables
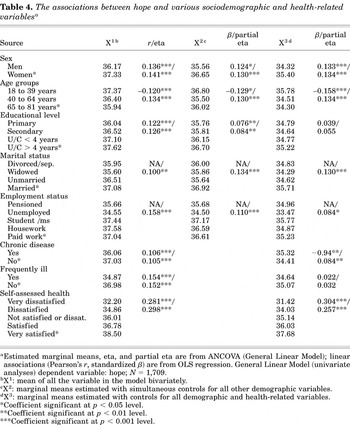
The correlational analyses and the GLM for each of the variables separately demonstrated that all the variables (i.e., sex, gender, educational level, marital status, educational level, employment status, chronic disease, frequent illness, and self-assessed health) were significantly related to hope. When all of the sociodemographic characteristics were included as independent variables in the GLM (block 1), age, gender, level of education, marital status, and employment status retained significant, controlled associations with hope (Table 4). Women reported significantly higher levels of hope than men, and higher levels of hope were associated with younger age and with higher levels of education. The participants who were widowed or who were divorced/separated and those who were unemployed or pensioned reported the lowest levels of hope.
The associations between hope and various sociodemographic and health-related variablesa

In the next block of the GLM analyses, health-related variables (i.e., having a chronic disease, frequently feeling ill, and self-assessed health) were entered into the model (Table 4). Age, gender, marital status, and employment status remained significantly related to level of hope, whereas educational level and frequent illness were no longer significantly related to hope. Although the presence of a chronic disease remained related to hope, participants who indicated that they had a chronic disease reported significantly higher levels of hope compared to those individuals without a chronic disease. Self-assessed health continued to have a strong positive relationship with hope (almost linear) in that individuals who were satisfied with their health reported higher levels of hope than those who were dissatisfied.
DISCUSSION
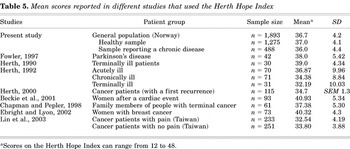
This study is one of the few large-scale investigations that evaluated levels of hope in a general population. It is interesting to note that the level of hope reported by the general population in this study was comparable to the level reported by different patient populations who were evaluated using the HHI (Table 5). The mean global scores on the HHI ranged from 32.19 in terminally ill patients to 40.32 in women with breast cancer. Participants in this study, with and without a chronic illness, reported levels of hope between these two patient samples. Although direct comparisons among the various samples were not tested, and possible cultural differences may influence the study findings, this variation in levels of hope challenges our understanding of the concept of hope. The fact that women with breast cancer reported higher levels of hope than our participants who were drawn from the general population warrants further investigation. Factors that influence individuals to think about and to evaluate changes in their level of hope need to be investigated in more detail.
Mean scores reported in different studies that used the Herth Hope Index

In line with the results described above, one of the most significant findings from this study is that the most important health-related variable that predicted levels of hope was self-assessed health. In addition, when all of the health-related variables were controlled for, individuals who indicated that they had a chronic illness reported higher levels of hope than those who did not have a chronic disease. These findings suggest that how an individual judges his/her health status may be more important to ratings of hope than the objective presence of a chronic illness.
Previous research (Rustøen & Wiklund, 2000) demonstrated a high level of hope in seriously ill patients. Although having a serious illness or being faced with a significant threat can undermine hope, the change that can occur in an individual's life, with a redefining of priorities, may result in higher levels of hope and awareness of hope despite the negative circumstances. On the other hand, many of the studies of chronically ill patients, listed in Table 5, had small samples (Herth, 1990; Fowler, 1997; Chapman & Pepler, 1998), and the results may not be generalizable and need to be interpreted with caution.
Of note, the lowest levels of hope in the present sample were found in the participants with a psychiatric disease. Although the term psychiatric disease covers a variety of conditions, depression is a highly prevalent condition in Europe today (Ayuso-Mateos et al., 2001) and may be associated with lower levels of hope. In addition, it should be noted that hope has an affective dimension. Because many psychiatric disorders are treated with drugs that alter affect, this may explain the lower levels of hope in this group of participants. In future studies, it would be important to obtain information on medications to confirm or refute this suggestion.
The scores for the individual items on the HHI-N indicate in what areas ratings of hope are highest and lowest. Participants reported the lowest score for the item “faith that comforts” (Table 3). This finding is consistent with earlier research on hope in Norway that showed that items connected with faith were given the lowest score (Rustøen & Wiklund, 2000). In contrast, the participants reported the highest scores on the item “recalling happy/joyful times” (Table 3). Snyder (1995) emphasized that “recalling past success” was one way to nurture hope in persons with high levels of hope. A higher score was also reported for the items “feel all alone” (reverse scored) and “give and receive caring/love” in the present sample. These items reflect high levels of social support.
One interesting finding from this study was that women reported higher levels of hope than men. This finding is contradictory to comments by Snyder et al. (1991), who noted that they were surprised to find that men did not have higher levels of hope than women, given the traditional gender roles in America. One possible explanation for the gender difference in hope, seen in this study, is that the questions on the HHI-N have an affective focus. Research findings demonstrate that women show greater affect intensity than men (Fujita et al., 1991; Seidlitz & Diener, 1998). Although this hypothesis warrants further testing, it should be noted that Snyder (Snyder et al., 1991; Snyder, 1995), who did not find any gender differences in hope scores, stated that the scale he used was based on a cognitive-focused definition of hope.
Many studies have reported higher prevalence rates of depression in women, although this gender difference was not found in a population study of 92,100 Norwegians (Stordal et al., 2001). The gender differences in hope in this study cannot be attributed to gender differences in depression because no significant gender difference was found in the number of participants who reported a psychiatric disease. However, women may experience more depression whereas men may have other psychiatric disorders.
Age-related differences in hope scores were also found in this study. Higher levels of hope were found in younger individuals. This finding warrants further investigation because previous studies on age differences in levels of hope have produced inconsistent results (Herth, 1992; Rustøen & Wiklund, 2000). Finally, levels of hope varied in relationship to marital status and employment status. These data may be useful in clinical practice to identify groups of individuals who are particularly vulnerable to loss of or threats to hope.
To generalize the study's findings about hope to the general Norwegian population one needs to consider whether this sample is representative. Comparisons with studies that reported on normal population data found similar response rates to mailed surveys (Ihlebaek et al., 2002; Ng et al., 2002). In addition, the age, sex, educational level, and marital status of the responders and nonresponders are similar to previously published reports. Therefore, it is reasonable to conclude that this sample is representative of the general Norwegian population.
Although the findings are limited to one nation, we believe that these results are of value to clinical settings outside Norway because data on hope in the general population are extremely limited. In addition, the findings on the relationships between hope and various demographic and disease-related variables increase our knowledge of the construct of hope and can form the basis for future research studies. Because hope is a universal phenomenon, these results can be compared to populations outside Norway.
CONCLUSIONS
This study describes hope in the general Norwegian population using the Norwegian version of the HHI. In addition, the study sheds light on the relationships between various sociodemographic and health-related variables and hope. Among the sociodemographic variables, women reported significantly higher levels of hope than men, and the younger participants reported higher levels of hope than older participants. Educational level, employment status, and marital status were also significantly related to hope when only demographic variables were included in the model. Age, gender, marital status, and employment status remained significant predictors of hope when additional health-related variables were included in the model. The most important health-related variable that predicted hope was self-assessed health in that participants who were satisfied with their health reported higher levels of hope. This finding suggests that an individual's subjective assessment of health is a better predictor of hope than the presence a chronic disease.
ACKNOWLEDGMENTS
Oslo University College, Buskerud University College, and University of Bergen, Department of Public Health and Primary Health Care financed the study.
References
REFERENCES
Ayuso-Mateos, J.L.,
Vazquez-Barquero, J.L.,
Dowrick, & C.,
et al.
(2001).
Depressive disorders in Europe: Prevalence figures from the
ODIN study.
British Journal of Psychiatry,
179,
308–316.Google Scholar
Ballard, A.,
Green, T.,
McCaa, & A.,
et al.
(1997).
A comparison of the level of hope in patients with newly diagnosed
and recurrent cancer.
Oncology of Nursing Forum,
24,
899–904.Google Scholar
Beckie, T.M.,
Beckstead, J.W., &
Webb, M.S.
(2001).
Modeling women's quality of life after cardiac events.
Western Journal of Nursing Research,
23,
179–194.Google Scholar
Brackney, B.E. &
Westman, A.S.
(1992).
Relationships among hope, psychosocial development, and locus of
control.
Psychological Reports,
70(3 Pt. 1),
864–866.Google Scholar
Chapman, K.J. &
Pepler, C.
(1998).
Coping, hope, and anticipatory grief in family members in
palliative home care.
Cancer Nursing,
21,
226–234.Google Scholar
Dufault, K. &
Martocchio, B.C.
(1985).
Symposium on compassionate care and the dying experience. Hope: Its
spheres and dimensions.
The Nursing Clinics of North America,
20,
379–391.Google Scholar
Ebright, P.R. &
Lyon, B.
(2002).
Understanding hope and factors that enhance hope in women with
breast cancer.
Oncology of Nursing Forum,
29,
561–568.Google Scholar
Fayers, P.M.
(2001).
Interpreting quality of life data: Population-based reference data
for the EORTC QLQ-C30.
European Journal of Cancer,
37,
1331–1334.Google Scholar
Fowler, S.B.
(1997).
Hope and a health-promoting lifestyle in persons with
Parkinson's disease.
The Journal of Neuroscience Nursing,
29,
111–116.Google Scholar
Fromm, E.
(1970).
The revolution of hope: Toward a humanized technology.
New York:
Harper Colophon Books.
Fujita, F.,
Diener, E., &
Sandvik, E.
(1991).
Gender differences in negative affect and well-being: The case for
emotional intensity.
Journal of Personality and Social Psychology,
61,
427–434.Google Scholar
Gibson, P.R.
(1999).
Hope in multiple chemical sensitivity: Social support and attitude
towards healthcare delivery as predictors of hope.
Journal of Clinical Nursing,
8,
275–283.Google Scholar
Greene, S.M.
(1981).
Levels of measured hopelessness in the general population.
British Journal of Clinical Psychology,
20,
11–14.Google Scholar
Guillemin, F.,
Bombardier, C., &
Beaton, D.
(1993).
Cross-cultural adaptation of health-related quality of life
measures: Literature review and proposed guidelines.
Journal of Clinical Epidemiology,
46,
1417–1432.Google Scholar
Herth, K.
(1990).
Fostering hope in terminally-ill people.
Journal of Advanced Nursing,
15,
1250–1259.Google Scholar
Herth, K.
(1992).
Abbreviated instrument to measure hope: Development and
psychometric evaluation.
Journal of Advanced Nursing,
17,
1251–1259.Google Scholar
Ihlebaek, C.,
Eriksen, H.R., &
Ursin, H.
(2002).
Prevalence of subjective health complaints (SHC) in Norway.
Scandinavian Journal of Public Health,
30,
20–29.Google Scholar
Jakobsson, A.,
Segesten, K.,
Nordholm, & L.,
et al.
(1993).
Establishing a Swedish instrument measuring hope.
Scandinavian Journal of Caring Sciences,
7,
135–139.Google Scholar
Kylma, J. &
Vehvilainen-Julkunen, K.
(1997).
Hope in nursing research: A meta-analysis of the ontological and
epistemological foundations of research on hope.
Journal of Advanced Nursing,
25,
364–371.Google Scholar
Lin, C.C.,
Lai, Y.L., &
Ward, S.E.
(2003).
Effect of cancer pain on performance status, mood states, and level
of hope among Taiwanese cancer patients.
Journal of Pain and Symptom Management,
25,
29–37.Google Scholar
Lynch, W.F.
(1974).
Images of hope.
London:
University of Notre Dame Press.
Miller, J.F. &
Powers, M.J.
(1988).
Development of an instrument to measure hope.
Nursing Research,
37,
6–10.Google Scholar
Ng, K.F.,
Tsui, S.L., &
Chan, W.S.
(2002).
Prevalence of common chronic pain in Hong Kong adults.
Clinical Journal of Pain,
18,
275–281.Google Scholar
Nowotny, M.L.
(1989).
Assessment of hope in patients with cancer: Development of an
instrument.
Oncology of Nursing Forum,
16,
57–61.Google Scholar
Raleigh, E.D.
(1992).
Sources of hope in chronic illness.
Oncology of Nursing Forum,
19,
443–448.Google Scholar
Rustøen, T.,
Wahl, A.K.,
Hanestad, & B.R.,
et al.
(2003).
Hope in the general Norwegian population, measured using the Herth
Hope Index.
Palliative & Supportive Care,
1,
309–318.Google Scholar
Rustøen, T. &
Wiklund, I.
(2000).
Hope in newly diagnosed patients with cancer.
Cancer Nursing,
23,
214–219.Google Scholar
Seidlitz, L. &
Diener, E.
(1998).
Sex differences in the recall of affective experiences.
Journal of Personality and Social Psychology,
74,
262–271.Google Scholar
Snyder, C.R.
(1995).
Conceptualizing, measuring, and nurturing hope.
Journal of Counseling & Development,
73,
355–360.Google Scholar
Snyder, C.R.,
Cheavens, J., &
Michael, S.T.
(1999).
Hoping. In
Coping: The psychology of what works,
Snyder, C.R. (ed.), pp.
205–251.
New York:
Oxford University Press.
Snyder, C.R.,
Harris, C.,
Anderson, & J.R.,
et al.
(1991).
The will and the ways: Development and validation of an
individual-differences measure of hope.
Journal of Personality and Social Psychology,
60,
570–585.Google Scholar
Stordal, E.,
Bjartveit Kruger, M.,
Dahl, & N.H.,
et al.
(2001).
Depression in relation to age and gender in the general population:
The Nord-Trondelag Health Study (HUNT).
Acta Psychiatrica Scandinavia,
104,
210–216.Google Scholar
Tanaka, E.
(1998).
Hopelessness in a community population: Factorial structure and
psychosocial correlates.
Journal of Social Psychology,
138,
581–590.Google Scholar
Travelbee, J.
(1966).
Interpersonal aspects of nursing.
Philadelphia:
F.A. Davis Co.
WHOQOL Group.
(1996).
What quality of life? The WHOQOL Group. World Health Organization
Quality of Life Assessment.
World Health Forum,
17,
354–356.Google Scholar
WHOQOL Group.
(1998).
Development of the World Health Organization WHOQOL-BREF quality of
life assessment. The WHOQOL Group.
Psychological Medicine,
28,
551–558.Google Scholar

Demographic characteristics of the sample and comparisons of the demographic characteristics of the responders (n = 1,912) and nonresponders (n = 2,047)
Hope in participants who reported a chronic disease, frequently feeling ill, and in different disease groups compared to the rest of the sample (n = 1,825)
Scores for the individual items on Herth Hope Index (n = 1,825)
The associations between hope and various sociodemographic and health-related variablesa
Mean scores reported in different studies that used the Herth Hope Index
 You have
Access
- 32
- Cited by