Management Implications
Our results show that treatment by manual removal with a spade or directed spray-to-wet foliar application of glyphosate to individual plants using backpack sprayers consistently reduced the density of Gypsophila paniculata (baby’s breath) but did not extirpate it. Overall, the optimal time to treat with both removal methods is when plants are flowering. Herbicide application is more effective than manual removal in preventing resprouting and should be used preferentially when possible. However, manual removal remains a useful alternative to herbicide, with lower potential for damaging the surrounding plant community, lower cost, and no requirement for certification of field personnel. Although this study was conducted in northwest Michigan, the results likely provide useful guidance for management of G. paniculata in other areas with similar climate and soil composition.
Introduction
Baby’s breath (also perennial baby’s breath, Gypsophila paniculata L.) is a herbaceous perennial plant in the family Caryophyllaceae that has become a problematic invader in large parts of North America. It is native to central and eastern Europe, the Black Sea region, and western portions of Russia, China, and Mongolia, where it is associated with dry steppe biomes, mainly between 30°N and 60°N latitude (Barkoudah Reference Barkoudah1962). It occurs primarily in areas with sandy soils and with climate types characterized by hot dry summers and cold winters (Barkoudah Reference Barkoudah1962; Darwent Reference Darwent1975). Gypsophila paniculata was introduced into North America at least as early as the 1880s (Darwent Reference Darwent1975) and since then has established adventive populations across the continent in areas with appropriate climate and soil conditions, especially in southern and southwestern Canada and in northern and northwestern parts of the United States (Darwent Reference Darwent1975; EDDMapS 2020). It has been documented in 29 U.S. states (EDDMapS 2020) and is considered a noxious weed in Washington and California and a priority invasive species in Michigan (Emery and Doran Reference Emery and Doran2013; Lamar and Partridge Reference Lamar and Partridge2019; Michigan DNR 2015).
Barkoudah (Reference Barkoudah1962), Darwent (Reference Darwent1975), and Rice et al. (Reference Rice, Martínez-Oquendo and McNair2019) summarize basic biological information about G. paniculata. It has a long woody taproot (up to 4-m long) that provides access to water and nutrients deep in the soil during dry summer conditions. The taproot and caudex (rootstock) are the plant’s perennation organ. In late summer, aboveground portions of the plant dry and break off from the caudex, becoming tumbleweeds. Sexual reproduction by seed is thought to be the only mode of reproduction in wild populations of G. paniculata. In Michigan, plants resprout from buds on the caudex in spring, flowers begin to open in late June, and fruits form in mid-July. Seeds that have not fallen from plants by late July and August are often wind-dispersed by tumbleweeds, facilitating spatial expansion of populations. On managed lands, tumbleweeds can reseed previously treated areas. Seeds germinate mainly in mid-spring. Juveniles are thought to mature and begin flowering in their third year of growth but may do so earlier in areas with warm winters (Darwent Reference Darwent1975). We know of no studies that demonstrate how long G. paniculata seeds remain viable in the soil seedbank. However, their thin seed coat and easily broken non–deep physiological dormancy (Geneve Reference Geneve1998) suggest they are unlikely to form a persistent seedbank (sensu Thompson and Grime Reference Thompson and Grime1979).
Management methods for controlling G. paniculata are summarized by Darwent (Reference Darwent1975), DiTomaso et al. (Reference DiTomaso, Kyser, Oneto, Wilson, Orloff, Anderson, Wright, Roncoroni, Miller, Prather and Ransom2013), and Rice et al. (Reference Rice, Martínez-Oquendo and McNair2019). In nonagricultural areas, the most commonly used methods are mechanical control and chemical control with herbicides. In the Great Lakes region, the most common form of mechanical control is manual removal by cutting the taproot with a spade, just below the caudex. Herbicides that have been used include 2,4-D, aminopyralid plus metsulfuron-methyl, chlorsulfuron, dicamba, glyphosate, imazapic, mecoprop, metsulfuron-methyl, and picloram, with glyphosate being the most common in the Great Lakes region. Regardless of the control method, G. paniculata infestations often are difficult to extirpate and may require multiple years of treatment (Emery et al. Reference Emery, Doran, Legge, Kleitch and Howard2013; TNC 2013).
Sleeping Bear Dunes National Lakeshore (SBDNL), on the northwest coast of Michigan’s lower peninsula, is part of the largest freshwater dune system in the world and is an important ecological and economic resource for Michigan (Albert Reference Albert2000). The dune system is characterized by well-drained sandy soils and a warm-summer, cold-winter, continental climate (Köppen-Geiger climate type Dfb), which matches the predominant climate type in eastern and central European portions of G. paniculata’s native range (Barkoudah Reference Barkoudah1962; Beck et al. Reference Beck, Zimmermann, McVicar, Vergopolan, Berg and Wood2018; Jalas and Suominen Reference Jalas and Suominen1986). SBDNL is home to several threatened, endangered, and endemic species, including the piping plover (Charadrius melodus Ord), Lake Huron locust (Trimerotropis huroniana E.M. Walker), and Pitcher’s thistle [Cirsium pitcheri (Torr. ex Eaton) Torr. & A. Gray]. Dunes are naturally disturbed environments that are highly susceptible to colonization by invasive plants (Albert Reference Albert2000). Gypsophila paniculata currently infests roughly 25% of the natural lands at SBDNL and in some areas constitutes more than 80% of the vegetative cover (Vandermeulen Reference Vandermeulen2006). The foredune and secondary dunes at SBDNL have the highest concentration of threatened and endemic species (Albert Reference Albert2000), and this is also where the invasive G. paniculata is most prevalent, underscoring its threat to these species and the importance of effective management (Michigan DNR 2015).
Gypsophila paniculata is a priority invasive species for detection and control in Michigan’s northern lower peninsula (Michigan DNR 2015). It has been actively managed in northwest Michigan since the 1990s and in SBDNL since 2006. Taken together, previous projects conducted by The Nature Conservancy (TNC), the National Park Service (NPS), and the Grand Traverse Regional Land Conservancy have treated more than 600 ha with a combination of manual removal and directed spray-to-wet foliar application of glyphosate to individual plants using backpack sprayers, with glyphosate being the preferred treatment, except when field conditions prevent its use.
An important problem in managing G. paniculata infestations is that the species commonly regrows in treated areas (S Howard, personal communication). Likely sources of this regrowth include resprouting of missed or partially treated plants and germination of seeds from the soil seedbank, but the relative importance of these sources is unknown. Emery et al. (Reference Emery, Doran, Legge, Kleitch and Howard2013) found that manual removal of G. paniculata from 20 by 50 m marked plots at SBDNL reduced its cover from 50% to less than 10% after three successive years of treatment but did not extirpate the plant. We know of no comparable assessment of herbicide effectiveness. About 750 ha remain infested in SBDNL, and more than 2,000 ha are ideal G. paniculata habitat (GLEPMT 2006; TNC 2013).
The goal of the present study was to assist managers involved in the restoration of dune habitats of northwest Michigan, and of similar habitats elsewhere, by providing new information on the effectiveness of methods currently being used to control G. paniculata infestations. Before the study was designed, meetings were held with TNC and SBDNL staff to identify the most important research needs, based on their on-the-ground experience in previous years. The following three questions emerged from these meetings, and the present study was designed to address them:
1. How effective are manual removal and glyphosate treatment in preventing resprouting of treated G. paniculata plants?
2. When is the best time during the growing season to employ each control method?
3. How effective are manual removal and foliar application of glyphosate (directed spray-to-wet application to individual plants using backpack sprayers) in reducing G. paniculata abundance in treated areas?
A novel feature of our approach to answering the third question is that we employed point-intercept sampling in large unmarked portions of the areas treated by field crews during routine management at the site. As a result, field crews did not know when they were treating areas where effectiveness would be assessed and therefore could not consciously or unconsciously alter their level of effort to increase treatment efficacy in assessment areas. To the best of our knowledge, our study is also the first to rigorously address the first and second questions for an invasive population of G. paniculata.
Materials and Methods
Study Site
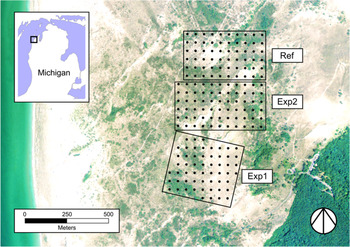
This study was conducted in Sleeping Bear Dunes National Lakeshore in northwest Michigan, USA, as part of a larger collaborative project between the Robert B. Annis Water Resources Institute and The Nature Conservancy (Figure 1). Other components of the overall project included large-scale restoration of infested areas within the plateau region of SBDNL, characterization of the phenology of seed maturation, and development and application of methods for characterizing the genetic structure of G. paniculata populations in and near SBDNL.
Study site in Sleeping Bear Dunes National Lakeshore (Leelanau County, MI), including Experimental Area 1 (Exp1), Experimental Area 2 (Exp2), and reference area (Ref). All three areas had similar initial Gypsophila paniculata densities of approximately 2 plants m−2. Black dots indicate sampling points for point-intercept surveys. Orthophoto was taken July 21, 2014, National Agriculture Imagery Program, U.S. Department of Agriculture.

The study site is a 46-ha area in the plateau region of SBDNL in Leelanau County, MI (44.872°N, 86.057°W). This area has G. paniculata cover ranging from 25% to 50%, an overall density of 2 plants m−2 (Rice Reference Rice2018), and no history of prior management. Average annual temperature (2016: 10 C; 2017: 9 C; historical: 9 C) and average annual precipitation (2016: 81 cm; 2017: 84 cm; historical: 81 cm) during the study period were consistent across treatment years and fell within the 20-yr historical ranges for 1998 to 2017 (MRCC 2018). The dune environment is characterized by warm summer and cold winter temperatures with high wind speeds (July to September 2016 to 2017: average hourly wind speed 3.2 m s−1 [7.2 mph]; maximum hourly wind speed 10.7 m s−1 [24.0 mph]) (MRCC 2020). The entire study area consists of shifting sand dunes with well-drained alkaline soil of Entisol Psamment type and minimal nutrient availability (Albert Reference Albert2000; NRCS 2019). The management assessment study by Emery et al. (Reference Emery, Doran, Legge, Kleitch and Howard2013) was conducted at different sites in the same general area.
Management treatments in the present study were applied in 2016 and 2017. In both years, the experimental areas were a subset of the total area targeted for restoration in the overall project but received study-specific treatments. Specifically, a 14.0-ha area was established as an experimental area (Exp1) within the larger area targeted for restoration in 2016, and a 16.5-ha area was established as a second experimental area (Exp2) within the larger area targeted for restoration in 2017, immediately north of the area restored in 2016 (Figure 1). Additionally, a 15.0-ha area was established just north of the area targeted for restoration in 2017 as an untreated reference area (Ref). All three of these areas had similar topography and similar densities of G. paniculata and other vegetation.
Treatment Methods
A key goal of the present project was to assess the efficacy of treatment methods routinely employed by restoration crews during normal management activities at SBDNL. Crews consist of 7 to 15 members, and current treatment methods include manual removal with a spade and directed spray-to-wet foliar application of glyphosate (23.4 g ae L−1 aqueous solution; Roundup ProMax®, Monsanto, St. Louis, MO) to individual plants using backpack sprayers. Glyphosate is a nonselective systemic herbicide and is the preferred treatment option. Manual removal consists of using a spade to sever the taproot below the caudex. The standard treatment protocol used by TNC requires manual removal to be used during rain, when plant leaves are still wet from recent rain, during windy conditions (based on professional judgment), when treating plants in close proximity to threatened C. pitcheri, or in remote areas to which it is not feasible to carry the water required for diluting the herbicide (vehicles are not permitted on the dunes) (TNC 2013). Cut plants are removed from the soil but left on site. Treatment at SBDNL typically begins in early June and continues until early August, by which time plants have seeded (Rice Reference Rice2018). Treatment for the present study concluded in late July each year.
Resprout following Treatment
In early June 2017, before application of any study treatments, we located 125 plants (100 in the Exp2 area, 25 in the Ref area) that had a minimum of three stems and marked their locations with small aluminum tags affixed to 61-cm rebar stakes driven into the soil near the base of each plant. The minimum stem number served as an operational criterion for mature plants, which we felt were the ones most likely to resprout following treatment and therefore the most sensitive indicator for this potential source of treatment ineffectiveness. Plants were checked for health at 1 wk after marking to be sure that the rebar did not damage the taproot. Any plant that showed signs of declining health (5 individuals) was dropped from the experiment, its marker was removed, and a replacement plant located within 1 m was marked. Of these 125 plants, 50 were removed manually and 50 were treated with herbicide in the Exp2 area, and an additional 25 located in the Ref area were left untreated. Treatment type was assigned randomly to plants in the Exp2 area. All treated plants were sprayed or manually removed during 1 wk in early June 2017 to maximize the potential for resprouting during the growing season. Marked plants were separated by a minimum of 4 m, and those that were to be manually removed were placed under a protective dome, while nearby plants were treated with herbicide. The condition of the root crown or upper taproot of the treated plants was checked in late fall 2017 and spring of 2018 to determine whether any resprouting had occurred. Plants were located using a Trimble Geo 7x GPS receiver (Trimble, Inc., Sunnyvale, CA) and a metal detector (Bounty Hunter Metal Detectors, El Paso, TX), and the number of plants that did and did not resprout in each treatment group was determined. The data were analyzed using a large-sample test for the difference between two proportions (Hollander et al. Reference Hollander, Wolfe and Chicken2014) to compare the two removal methods and to compare each removal method with the untreated control. Confidence intervals for the difference between proportions were estimated by the Newcombe hybrid score method (Fagerland et al. Reference Fagerland, Lydersen and Laake2013), while confidence intervals for individual proportions were estimated by the Wilson score method (Agresti Reference Agresti2013; Brown et al. Reference Brown, Cai and DasGupta2001).
Type and Timing of Treatment
To assess the effect of the type and timing of treatment, we established 24 pairs of 32 by 32 m treatment plots (total plots = 48) within the Exp1 area in 2016, before application of any study treatments in the area. Each pair included one manual removal plot and one herbicide plot with similar densities of G. paniculata. Treatment types were randomly assigned to the two plots in each pair. Each plot pair was separated from others by a minimum of approximately 30 m. Between 0 and 14 d before treatment, an unmarked 4 by 4 m survey quadrat was established in each plot by haphazardly tossing a survey pole into the plot. GPS coordinates of each quadrat were recorded, and the density of G. paniculata was determined by counting the number of plants (excluding seedlings) and dividing by the quadrat area (16 m2).
Treatment was administered to each large plot during June and July 2016. Plants were bright green during the early-season treatment period, began to flower during the midseason period, and transitioned from flowering to fruiting and development of seeds during the late-season period. Plot treatments were separated into three temporal periods: preflowering (treatment between June 13 and June 23, 2016), flowering (treatment between June 27 and July 7), and fruiting (treatment between July 11 and July 27; this time period also includes early seed development, but for simplicity we are referring to it as fruiting). Plants other than seedlings were similar in size throughout this time but at different stages in their phenology. Our goal was to assign eight manual removal plots and eight herbicide treatment plots to each group, but several weeks of high afternoon winds in June prevented some of the herbicide plots from being treated until July. As a result, the preflowering treatment consisted of 10 manual removal and 6 herbicide plots, flowering of 10 manual removal and 6 herbicide plots, and fruiting of 4 manual removal and 11 herbicide plots. Survey quadrats were located again with GPS receivers to resurvey and assess treatment efficacy in June 2017.
In addition to the survey quadrats in treatment plots, we also established ten 4 by 4 m quadrats scattered throughout the Ref area and surveyed them in August 2016 and June of 2017. Density decreases (if any) in treated quadrats are not attributable to treatment if similar or greater decreases also occur in the Ref quadrats.
Data from this experiment consisted of the change in G. paniculata density (posttreatment survey minus pretreatment survey) in each treated and Ref quadrat and were analyzed statistically to determine whether density changed in manual removal plots, herbicide removal plots, or the reference plots during preflowering, flowering, or fruiting treatment periods. A box plot of data for the various treatment types and times revealed pronounced heterogeneity of variance among groups, so ANOVA was not appropriate. We assessed the groups for normality using quantile–quantile plots supplemented with a Shapiro-Wilk test and found that only one (preflowering herbicide treatment) showed strong evidence of nonnormality (P = 0.002). A Dixon outlier test identified an unusually low density for this group as a clear outlier (P < 0.001). After removing the outlier and repeating the Shapiro-Wilk test, no evidence of non-normality was found. We then employed matched-pair (one-sample) t-tests to determine whether there was evidence that herbicide or manual removal reduced G. paniculata density for any treatment period, or that density in Ref decreased. In both cases, the null hypothesis of no change in density was tested against the one-sided alternative of a decrease. We used two-sample Welch’s t-tests with Holm adjustment of P-values for multiple comparisons to determine whether there was evidence that herbicide efficacy differed between treatment periods, whether manual removal efficacy differed between treatment periods, or whether herbicide and manual removal efficacies differed from each other for any treatment period. In all three cases, the null hypothesis of no difference in efficacy was tested against the two-sided alternative hypothesis that efficacy differed.
Point-Intercept Surveys
Pre- and posttreatment point-intercept surveys were conducted during late May of 2017 and 2018, before application of any study treatments during the respective year, in unmarked portions of the Exp1, Exp2, and Ref areas. Treatment was applied to the Exp1 and Exp2 areas during June and July 2017. Treatment in Exp1 was applied after the posttreatment survey of the type and timing of treatment experiment had been completed. Treatment in Exp2 was applied after experimental plants from the resprouting experiment had been removed or sprayed; locations of these plants were conspicuously marked during treatment, and field crews avoided them. Consistent with standard management practice in the northwest Michigan dune system, plants were located, identified, and treated individually, and either herbicide or manual removal was employed, as dictated by field conditions during treatment.
Use of point-intercept sampling to assess treatment efficacy has long been a common practice in studies of aquatic invasive plants (e.g., Conklin and Smith Reference Conklin and Smith2005; Madsen Reference Madsen1999; Madsen and Wersal Reference Madsen and Wersal2017; Mikulyuk et al. Reference Mikulyuk, Hauxwell, Rasmussen, Knight, Wagner, Nault and Ridgely2010; Parks et al. Reference Parks, McNair, Hausler, Tyning and Thum2016), but few investigators assessing treatment efficacy in studies of invasive terrestrial plants appear to use this method. It is an advantageous method for assessing the efficacy of treatment methods as actually applied by field crews, because crews administer treatment on a spatial scale much larger than the survey areas and do not know when they are working in these areas. Because only a representative subset of treated plants is assessed before and after treatment, the point-intercept method permits very large numbers of plants to be treated without compromising feasibility of rigorous assessment of response.
We used ArcGIS software (ESRITM 10.2; ESRI 2012) to generate sampling grids (50-m mesh) for areas Exp1 (56 sampling points), Exp2 (66 sampling points), and Ref (60 sampling points) (Figure 1). Each survey point lies at the center of a unique 50 by 50 m square of habitat. Summing these squares yields estimates of 14.0, 16.5, and 15.0 ha as the areas of Exp1, Exp2, and Ref (as previously mentioned), with the minor differences being necessary to ensure that habitat was homogeneous. The grids were transferred to handheld GPS receivers (Magellan ProMark3, Magellan Navigation, San Dimas, CA), which field personnel used to navigate to the unmarked sampling points. The untreated Ref area enabled comparison with the treated areas; posttreatment decreases in abundance (if any) detected in treated areas are not attributable to treatment if similar or greater decreases also occur in the Ref area. We sampled a total of 182 points, of which 122 were treated and 60 were reference points. The number of G. paniculata plants within a 2-m radius around each sampling point was counted and divided by the area of the sampling disk (4π ≈ 12.57 m2) to yield an estimate of local density (number of plants per square meter). In addition, G. paniculata was scored as present at a given sampling point if the number of plants counted was greater than zero and absent otherwise, yielding binary estimates of local presence–absence. The 2017 and 2018 surveys were completed in 4 d at the end of May.
Efficacy of the treatment methods was assessed using a nonparametric bootstrap one-sample t-test programmed in R (Efron and Tibshirani Reference Efron and Tibshirani1993; R Core Team 2017) for matched-pairs density data and a nonparametric mid-P McNemar test (Fagerland et al. Reference Fagerland, Lydersen and Laake2013; R Core Team 2017) for matched-pairs presence–absence data. Density data were transformed (log(density + 1)) before analysis to reduce skew due to a small proportion of sampling locations with unusually high local density. For both density and presence–absence data, the null hypothesis of no change was tested against the one-sided alternative hypothesis of a decrease.
The bootstrap t-test and McNemar test assume that posttreatment changes in local density or presence–absence at different survey points are independent. If there is strong positive spatial autocorrelation, the tests will produce P-values that are somewhat smaller than they would be if the tests were able to account for the autocorrelation (intuitively, this is because strong positive autocorrelation reduces the effective sample size and therefore increases the true P-value). We assessed this assumption with a spatial autocorrelogram based on Moran’s I, with Holm adjustment of P-values, using the correlog function in R package ncf (Bjørnstad and Falck Reference Bjørnstad and Falck2001).
Results and Discussion
Resprout following Treatment
We found resprouting occurred both in manually removed plants and, less frequently, in herbicide-treated plants. Resprouting of marked plants by the end of the growing season in which they were treated occurred in 10% (4% to 21%, 95% confidence interval [CI]) of the manually removed plants and 0% of the herbicide-treated plants (Figure 2). A similar trend emerged when the plants were rechecked in 2018, at 1 yr following treatment, with 14% (7% to 26%, 95% CI) manually removed plants and 2% (0% to 12%, 95% CI) herbicide-treated plants resprouting. After digging down to the caudex and taproot of the manually removed plants that resprouted, we found that resprouting occurred both from the severed taproot and portions of the remaining caudex. By contrast, all marked plants in the Ref area survived the growing season in 2017, overwintered, and resprouted in 2018.
Probability of resprouting for plants treated with herbicide or manual removal and for untreated plants in the Ref area. Bars represent 95% confidence intervals.

Analysis of the 2018 results revealed a difference between the resprouting probabilities for manual removal and herbicide treatment (P = 0.027; 0.01 to 0.24, 95% CI for the resprout proportion for manual removal minus the proportion for herbicide). Normal resprouting by untreated plants in the Ref area had a higher chance of occurring than did resprouting by plants that received either type of treatment (P < 0.001 for both comparisons; 95% CI for Ref area: 0.78 to 1.0, Ref vs. manual; 0.95 to 1.0, Ref vs. herbicide).
Many common invasive plants from a variety of families are known to resprout from stumps, stems, roots, root crowns, or rhizomes following manual removal of aboveground portions of the plant, and some species (e.g., Japanese knotweed [Fallopia japonica (Houtt.) Ronse Decr.]) also resprout following herbicide treatment (Supplemental Table S1). Before the present study, the effectiveness of manual removal and glyphosate treatments for preventing resprouting of G. paniculata had not been quantified. Previous authors have suggested that G. paniculata is not able to regenerate stem tissue from the taproot (Emery et al. Reference Emery, Doran, Legge, Kleitch and Howard2013; Loope and Siterlet Reference Loope and Siterlet2000), and they therefore attribute resprouting of manually removed plants solely to incomplete removal of the caudex. However, horticulturalists commonly propagate G. paniculata and other Gypsophila perennials from root cuttings (GPPD accessed June 7, 2018; PFAF accessed June 7, 2018). This area warrants further study into the basic biology of G. paniculata taproot and caudex to better understand its regrowth following management. Our results show that at 1 yr after treatment, glyphosate treatment was more effective at preventing resprouts than manual removal, suggesting it should be used preferentially when treating a large infestation.
Type and Timing of Treatment
Only herbicide treatment during flowering (P = 0.009) and manual removal during flowering (P = 0.003) were found to reduce G. paniculata density (Figure 3). However, the sample medians for both herbicide treatment and manual removal during fruiting were well below zero, and all four observed changes in density for manual removal during fruiting were negative. One intriguing outcome was the high variability in response of fruiting stage G. paniculata to herbicide. In view of these suggestive results during the fruiting period, it would be worthwhile to repeat this assessment with larger sample sizes.
Box plot with strip chart overlay showing change in Gypsophila paniculata density (plants m−2) between 2016 and 2017 in the treatment type and timing experiment. Pre-Flower, early-season treatment before most plants flowered, June 13 to June 23, 2016; Flower, midseason treatment when most plants were flowering, June 27 to July 7; Fruit, late-season treatment when most plants bore fruits, July 11 to July 27. The dashed horizontal line represents a density change of zero. The red arrow identifies an outlier. Asterisks indicate statistically significant decreases (P < 0.01 in both cases).

Efficacy of herbicide treatment during flowering differed from that of both the preflowering (P = 0.011) and fruiting (P = 0.047) herbicide treatment, with treatment during flowering being most effective in both cases. We found no evidence that preflowering and fruiting treatments differed from one another (P = 0.102).
No differences were detected between any of the three manual removal treatment periods (preflowering vs. flowering: P = 0.145; flowering vs. fruiting: P = 0.665; preflowering vs. fruiting: P = 0.285). We also detected no differences between treatment types for any of the three treatment periods (preflowering: P = 1.000; flowering: P = 0.340; fruiting: P = 1.000). Finally, we found no evidence that density decreased in the Ref area (P > 0.626). It is therefore reasonable to attribute the decreases detected in flowering and fruiting treatments to the treatments applied.
Overall, these results indicate that treatment was most effective during midseason, when plants were flowering, and least effective at the beginning of the management period, before plants flowered. The high efficacy of glyphosate during flowering is partially consistent with recommendations for G. paniculata control that this herbicide be applied to spring growth or bolting plants (DiTomaso et al. Reference DiTomaso, Kyser, Oneto, Wilson, Orloff, Anderson, Wright, Roncoroni, Miller, Prather and Ransom2013), though we saw no evidence of efficacy with late spring application. We do not think resprouting occurred more frequently among individual plants that were treated early in the season, because the resprouting study showed that both types of treatment applied to individual plants at this time were highly effective. One potential explanation for low preflowering treatment efficacy is that a higher proportion G. paniculata plants may have been missed by treatment crews during this period. At this stage in their phenology, immature G. paniculata plants up to 2 yr of age easily blend in with other vegetation, particularly with immature confamilial bladder campion [Silene vulgaris (Moench) Garcke], which looks nearly identical to G. paniculata at this time of year. Also, seedlings (around 6-cm tall by mid-June) and immature plants (around 12 cm at 1 yr) may be overlooked at this time due to their small aboveground growth (Darwent and Coupland Reference Darwent and Coupland1966). To reduce the likelihood of crews missing small G. paniculata plants during early-season treatment, we suggest that managers take additional time to train removal crews to correctly identify these preflowering plants or delay treatment until plants are budding and G. paniculata can be identified more rapidly and reliably. From this stage through the end of the treatment season, G. paniculata plants are easy to quickly and correctly identify.
Point-Intercept Survey
The Exp1 area showed decreased local density of G. paniculata (P < 0.001; Figure 4), with a mean reduction in local density of 58%.However, we detected no decrease in local presence–absence in Exp1 (P > 0.05). Based on visual inspection, it appears that regrowth in the Exp1 area occurred mainly from immature plants that were missed by treatment crews and from new seedlings that emerged after treatment, with most large mature G. paniculata plants having been successfully eliminated.
Box plots of local density change between 2017 and 2018 as determined by point-intercept sampling in the three study locations before and after treatment. Experimental Area 1 (Exp1) and Experimental Area 2 (Exp2) were treated in July 2017; pretreatment sampling was conducted in all three areas in May 2017, posttreatment sampling in May 2018. Density data were transformed as log(density + 1). Boxes span the interquartile range of data; horizontal bars indicate the median. The single asterisk for the reference area (Ref) indicates a statistically significant decrease (P < 0.001). Double asterisks for the Exp1 and Exp2 areas indicate decreases that were statistically significant and also significantly greater than the decrease detected in Ref (P < 0.003 in both cases). The dashed horizontal line indicates a density change of zero.

The Exp2 area also showed a statistically significant decrease in local density (P < 0.001), with a mean reduction of 82%. As in the Exp1 area, we detected no decrease in local presence–absence (P > 0.05).
For unknown reasons, the Ref area showed a statistically significant decrease in density (P < 0.01). To determine whether there was still compelling evidence of a treatment effect in the experimental areas during this period, we used a bootstrap two-sample t-test to test the null hypothesis that the density decrease detected in Exp1 was the same as the decrease in Ref versus the alternative hypothesis that the density decrease in Exp1 was greater (more pronounced) than in Ref, and similarly for Exp2. The null hypothesis was rejected (P < 0.003 after Holm adjustment) for both Exp1 and Exp2, providing strong evidence of a treatment effect in both experimental areas during the 2017 to 2018 period.
The spatial distributions of density changes during 2017 to 2018 are illustrated in Figure 5. Overall, Figure 5 shows a decrease in G. paniculata density following treatment across sites, but it highlights the variability in response and the fact that G. paniculata is rarely extirpated locally. The few spots that do show eradication are often less suitable habitat conditions for G. paniculata. In those situations, treatment was able to remove the few individuals present with a reduced chance of reinvasion. The figure also suggests a more pronounced density reduction in Exp2 than Exp1. Comparison of responses in Exp1 and Exp2 was not an a priori goal of the study, so statistical assessment of the hypothesis that the responses differ after examining Figure 5 would be improper. We note, however, that Exp2 received its first year of treatment in 2017, while Exp1 had been treated during 2016 in the type and timing of treatment study, which reduced G. paniculata density somewhat. Analysis of the point-intercept data revealed no significant spatial autocorrelation in any of the years or areas (P > 0.05 at all radii). Therefore, the independence assumption of the above statistical tests for treatment effects is tenable for all comparisons.
Spatial distribution of local density change as determined by point-intercept sampling in the three study areas before and after treatment. Plot symbols are centered on the sampling locations. Green and magenta disks indicate that local density changed between surveys; green indicates decrease in density, and magenta indicates increase; disk size is proportional to the absolute value of the change in log(density + 1). “x” indicates that no Gypsophila paniculata plants were found in either survey; “o” indicates that G. paniculata was present, but the local density did not change.

Density was reduced in both experimental sites, but G. paniculata was not extirpated at most survey points, even in Exp1, which had been treated previously in 2016. These results reinforce the conclusion reached in previous studies that managers of G. paniculata must re-treat areas for several consecutive years to achieve substantial reductions in abundance (Emery et al. Reference Emery, Doran, Legge, Kleitch and Howard2013; Loope and Siterlet Reference Loope and Siterlet2000). Our study expanded upon this earlier work by assessing the effectiveness of updated treatment methods currently used by TNC and NPS, which employ a combination of herbicide and manual removal, and by conducting the assessment using point-intercept surveys on an unmarked grid covering a subset of the area being treated, so that treatment crews did not know when they were working in areas where treatment efficacy would be assessed. We argue this approach provides a more realistic assessment of the effectiveness of treatment methods as actually applied during routine management activities than does the approach of employing small marked plots that treatment crews know will be assessed. Though we are aware of no rigorous demonstration of the phenomenon, our previous experience with groups of volunteers and summer interns performing large-scale removal of invasive plants from parks suggests that such crews are more careful and thorough when treating small marked plots that they can complete in a short time than when treating large areas that require a month or more to complete.
In summary, our results show that treatment reduced G. paniculata density but did not eradicate the plant, that herbicide was more effective than manual removal in preventing resprouting, and that treatment via manual removal or herbicide was least effective in reducing density when applied early in the season when plants had not yet flowered and most effective when applied midseason when plants were flowering. Treating before plants transition to production of mature seeds is also consistent with recommendations of Rice et al. (Reference Rice, Martínez-Oquendo and McNair2019) based on the phenology of seed maturation. We advise managers in this geographic region to either train crew members extensively in local plant identification, if treating during the preflowering stage, or delay treatment until plants are flowering and more easily identifiable. We also recommend treating for consecutive years and preferentially treating with herbicide when possible, due to improved reductions in resprouting.
The G. paniculata infestation in northwest Michigan is well established, and short-term reductions in density are unlikely to make a lasting impact in the areas it currently occupies. Management efforts would be best applied to preventing further spread of the existing populations. Gypsophila paniculata is still restricted to a relatively small portion of Michigan’s extensive coastal dune system. If the small satellite populations are treated quickly and effectively, the result should be a more manageable infestation and prevention of further spread, protecting the unique Great Lakes native dune plant community. With that being said, SBDNL is an exceptional area due to its unique geologic history and presents an opportunity to educate the public on the importance of invasive species management. While many managers in northwest Michigan believe that eradication of G. paniculata is not a realistic goal with currently available treatment methods and funding levels, we do think it is worthwhile to continue to thin the species on this plateau so the public can see what the native dune plant community looks like with manageably low G. paniculata densities.
Supplementary Material
To view supplementary material for this article, please visit https://doi.org/10.1017/inp.2020.10
Acknowledgments
We thank the associate editor and two anonymous reviewers for thoughtful comments that improved this paper. This study was funded by a U.S. Environmental Protection Agency Great Lakes Restoration Initiative grant to CP, JNM, and Kevin Strychar and a GVSU Presidential Grant to EKR. Thanks to Matt Kienitz, Emily Dusicska, and Alexis Hoskins for assistance with data collection and Kurt Thompson and Kim Oldenborg for GIS help. Thanks also to TNC (particularly Shaun Howard and Kaldis Grant) and NPS staff (particularly Julie Christian) and crews for their incredible work in managing G. paniculata and willingness to coordinate treatment timing and location. No conflicts of interest have been declared.