Introduction
Intuitively, the shape of a molecule is seen to determine the structure of its crystal—we expect spheres to form close-packed face-centered-cubic or hexagonal close-packed lattices and cubes to adopt a cubic arrangement. Nevertheless, in some cases, the flow of causality is reversed, and the crystal lattice imposes a change in the molecular shape.
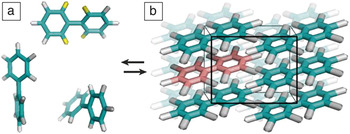
A classic example of conformation change in crystallization is biphenyl [(C6H5)2] (see Figure 1).Reference Trotter1 To accommodate the electron density around the four hydrogen atoms in ortho positions, the tethered benzene rings twist to a torsional angle of about 45° in the gas phase.Reference Almenningen, Bastiansen, Fernholt, Cyvin, Cyvin and Samdal2 In the crystal, biphenyl attains a planar structure, which offers the advantage of denser plane-to-plane packing of the individual benzene rings. To avoid overlap, the ortho hydrogens fold away from the inter-ring bond and adopt a nontypical configuration associated with increased energy.Reference Trotter1 Thus, while the planar configuration lowers the free energy of the crystal by facilitating attractive intermolecular contacts, it increases the free energy of individual molecules.
The gas–crystal equilibrium of biphenyl. (a) The four hydrogen atoms in ortho positions of a gas molecule are highlighted in yellow, the other hydrogen atoms are gray, and the carbon atoms, green. In the gas phase, the two phenyl rings twist to accommodate the electron density of the ortho hydrogens. (b) Molecules in the crystal (black box highlights unit cell), one of which is highlighted in red, acquire planar conformation.

The example of biphenyl highlights the critical condition for shape change in crystallization—the gain in crystallization free energy in the modified shape should be greater than its loss due to the selection of a less favorable molecular conformation. Biphenyl also illustrates a primary question regarding shape change in crystallization: Does crystallization select one of many configurations present in the free phase, gas, or solution, or does it enforce shape change during molecular aggregation?
In this article, we discuss several scenarios in which shape change accompanies and facilitates crystallization. We focus on the realm of biological macromolecules in which the large molecular sizes ensure conformational flexibility. Proteins are emphasized, since they crystallize more readilyReference Chayen, Helliwell and Snell3–Reference Ng, Kuznetsov, Malkin, Keith, Giege and McPherson5 than nucleic acids and polysaccharides, and the physical mechanisms involved in proteins are also better understood.Reference McPherson6–Reference Vekilov and Nishinaga8
Protein conformation in solution and in crystals
Shape change in crystallization is a fundamental problem in biological crystallography. Biological macromolecules are large.Reference Nelson and Cox9 They have hierarchical structures in which certain superatomic elements, such as α-helices and β-sheets in proteins, are relatively rigid, while the loops connecting them are flexible and permit significant conformational freedom. These molecules scatter x-rays, neutrons, and electrons weakly, and determination of their atomic structure is only possible after signal amplification by similarly aligned molecules in a regular array, such as a crystal. Therefore, the molecular structure emerging from these determinations is the one in the crystalline state. Conversely, the molecules perform their functions either in a solution or embedded in the soft matrix of a biological membrane. An in-depth understanding of biological function (i.e., enzyme catalysis, transport and storage, gene replication and repair) requires data on the atomic structure of a molecule in its active state, and potential shape change during crystallization could significantly bias important molecular insights derived from the structure.
In the early days of x-ray crystallography of biological macromolecules, the correspondence between the crystal and solution structures was ascertained by indirect, compound-specific methods, such as comparisons of the activity and selectivity of enzymes in both states.Reference Ducruix and Giege10 The belief was that since crystalline enzymes retain a significant fraction of their catalytic activity, the structure of the active center must be preserved. It was generally accepted that molecular segments away from the active center and, in particular, those involved in crystal contacts may be modified, but the impact of the these modifications on protein function was discounted.Reference Devedjiev11
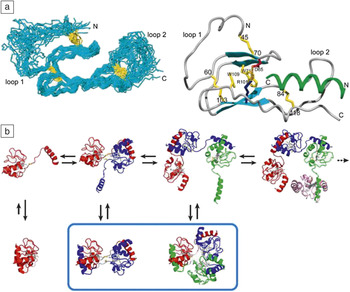
The advent of nuclear magnetic resonance (NMR) techniquesReference Wütrich12,Reference Yee, Savchenko, Ignachenko, Lukin, Xu, Skarina, Evdokimova, Liu, Semesi, Guido, Edwards and Arrowsmith13 provided data on the solution structure of proteins and nucleic acid and revealed their significant inherent conformational flexibility, as illustrated in Figure 2a.Reference Grace, Perrin, Gulyas, DiGruccio, Cantle, Rivier, Vale and Riek14,Reference Berman, Westbrook, Feng, Gilliland, Bhat, Weissig, Shindyalov and Bourne15 At the extreme, intrinsically disordered proteins, which have recently come into focus, do not adopt unique conformations, but rather exist as conformational ensembles.Reference Fisher and Stultz16 Comparisons between x-ray and NMR structures reveal that in most proteins studied, the solution structures vary from those in a crystal to a certain degree.Reference Garbuzynskiy, Melnik, Lobanov, Finkelstein and Galzitskaya17 Strikingly, in 20% of the samples, the differences were so significant as to suggest a conformational change upon crystallization.Reference Garbuzynskiy, Melnik, Lobanov, Finkelstein and Galzitskaya17
Shape changes in protein crystallization. (a) 3D nuclear magnetic resonance (NMR) structure of the protein ECD1–CRF-R2β in complex with astressin, a peptide antagonist. NMR data, on the left, reveal limited conformation flexibility of α-helices and β-sheets, and significant conformation freedom of the two loops. N and C termini are labeled; the residues of the disulfide bridges are highlighted in yellow. A simulated rigid structure is shown on the right. Numbers designate amino acid residues. Adapted with permission from Reference Reference Grace, Perrin, Gulyas, DiGruccio, Cantle, Rivier, Vale and Riek14. © 2007 National Academy of Sciences. (b) Solution equilibrium among native monomer (lower left), partially unfolded monomer (upper left), and domain-swapped dimer, trimer, and tetramer (sequentially in the top row) of cytochrome c, a protein found in mitochondria. Colors designate different protein molecules. Blue contour in bottom row highlights the structures of the dimer and trimer in their respective crystals. Adapted with permission from Reference Reference Hirota, Hattori, Nagao, Taketa, Komori, Kamikubo, Wang, Takahashi, Negi, Sugiura, Kataoka and Higuchi26. © 2010 National Library of Medicine. Note: ECD1, first extracellular domain; CRF, corticotropin releasing factor.

Simulation of ligand docking, substrate attachment, DNA binding, and other vital protein functions have enforced the notion of the relative inadequacy of x-ray protein structural data.Reference Bissantz, Bernard, Hibert and Rognan18 As a rule, models based on static protein crystal structures provide limited predictive power.Reference Kontoyianni, McClellan and Sokol19 To alleviate this deficiency, modeling of protein structure dynamics in solution has emerged as a better approach to predict specific protein function.Reference Meagher and Carlson20,Reference Cerqueira, Bras, Fernandes and Ramos21
One of the complex examples of shape change is the crystallization of domain-swapped oligomers,Reference Schlunegger, Bennett and Eisenberg22 illustrated in Figure 2b. Domain swapping is a mechanism of assembly, whereby one domain of a monomeric protein is replaced by the same domain from an identical protein chain, resulting in an intertwined dimer or higher oligomer. The swapped domain can range in complexity from a small α-helix or β-sheet strand to entire tertiary domains.Reference Bennett, Schlunegger and Eisenberg23 As Figure 2b demonstrates, the crystallization of domain-swapped oligomersReference Zegers, Deswarte and Wyns24–Reference Hirota, Hattori, Nagao, Taketa, Komori, Kamikubo, Wang, Takahashi, Negi, Sugiura, Kataoka and Higuchi26 combines both mechanisms of shape change in crystallization: The selection of a molecular structure compatible with a crystal lattice from several structures coexisting in solution and the forced imposition by the crystal lattice of a final conformational modification.
Facilitated nucleation due to protein conformational flexibility
Protein crystallization is notoriously difficult. Oftentimes, crystals never form and instead, amorphous aggregates, fibrils, dense liquids, and other undesirables appear.Reference McPherson27 The main obstacle is not the slow growth of protein crystals; it was established that despite their large size and irregular shape,Reference Chernov, Komatsu, van der Eerden and Bruinsma28 the crystal growth rates of many proteins are comparable to those of small-molecule crystals or, at most, two orders of magnitude slower.Reference Vekilov29–Reference Yau, Petsev, Thomas and Vekilov32 A structural impediment to protein crystallization is the lack of suitable intermolecular contact sites that are located on the surface of a protein in a pattern compatible with a crystallographic symmetry group.
This problem is overcome through laborious searches toward procedures, conditions, and additives that enable such contacts,Reference McPherson27 including genetic modifications of the protein surface residues.Reference Derewenda33–Reference Derewenda and Vekilov35 The main kinetic impediment to protein nucleation appears to be the relatively large surface free energy γ of the crystal–solution interface. Typical estimates of γ exceed 0.01 J m–2,Reference Malkin, Kuznetsov, Glanz and McPherson36–Reference Yau and Vekilov38 which is comparable to values for small-molecule materials. In combination with the large size of the protein molecules, the high γ leads to a high free-energy barrier for nucleation.Reference Gibbs39,Reference Gibbs40 In turn, this high barrier imposes high supersaturations at which nucleation may occur, thus expediting the formation of disordered solids.
To understand how proteins work around the high surface free energy problem, a two-step mechanism of nucleation was put forth; this mechanism has been validated and confirmed for numerous protein, small-molecule organic and inorganic (including several important biominerals), colloid, and polymer systems. According to this mechanism, crystal nuclei assemble within preexisting protein-rich clusters rather than from molecules in the dilute solution. Owing to the high protein concentration in the clusters, the surface free energy of a crystalline nucleus emerging in them drops off.Reference Galkin and Vekilov41–Reference Vekilov44 Estimates of the typical surface free energy of the nucleus suggest that it is on the order of 10–4 J m–2,Reference Yau and Vekilov38,Reference Malkin and McPherson45–Reference Galkin and Vekilov49 (i.e., up to two orders of magnitude lower than γ of a nucleus forming in the solution). Since the nucleation barrier depends on the cube of γ,Reference Galkin and Vekilov49,Reference Gibbs50 this mechanism leads to orders of magnitude lower barriers and makes nucleation feasible over laboratory time scales.
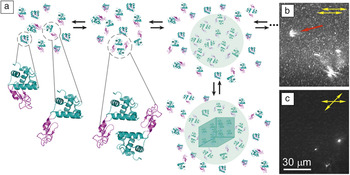
Protein-rich clusters emerge as crucial prerequisites for protein crystal nucleation. Their diameters vary from ca. 100 nm for the relatively small lysozyme,Reference Li, Lubchenko, Vorontsova, Filobelo and Vekilov51 to several hundred nanometers for larger proteins.Reference Gliko, Pan, Katsonis, Neumaier, Galkin, Weinkauf and Vekilov52,Reference Sleutel and Van Driessche53 These clusters are likely liquidReference Sleutel and Van Driessche53–Reference Pan, Galkin, Filobelo, Nagel and Vekilov56 and stable for extended periods.Reference Li, Lubchenko, Vorontsova, Filobelo and Vekilov51 Recently, a mechanism was proposed where the clusters consist of a concentrated mixture of protein complexes and monomers.Reference Pan, Vekilov and Lubchenko57 Cluster formation results from an interplay between monomer influx, complex formation, and subsequent complex outflow and decay. The complexes are characterized by nontypical tertiary or quaternary structures, depending on the protein. In the case of monomeric proteins such as lysozyme, these complexes likely represent an ensemble of dimers made of partially unfolded monomers, including domain-swapped dimers.Reference Schlunegger, Bennett and Eisenberg22,Reference Bennett, Sawaya and Eisenberg58 In oligomeric proteins such as hemoglobinReference Royer and Mangum59 and glucose isomeraseReference Bhosale, Rao and Deshpande60,Reference Srivastava, Shukla, Choubey and Gomase61 (both are typically tetrameric), the complexes may be oligomers whose order is likely higher than its typical value, while the degree of unfolding is insignificant. Figure 3a presents a schematic of the pathway leading to crystal nucleation via partial misfolding, domain swapping, and cluster formation for the protein lysozyme. Figure 3b–c demonstrates the nucleation of glucose isomerase crystals within protein-rich clusters.Reference Maes, Vorontsova, Potenza, Sanvito, Sleutel, Giglio and Vekilov54
Shape change enables protein crystal nucleation. (a) A schematic depiction of partial unfolding, formation of domain-swapped dimers, cluster assembly by dimers and monomers, and the nucleation of a crystal (depicted as a cube) within a protein-rich cluster (depicted as a sphere) for the protein lysozyme. The α and β domains of lysozyme are depicted with teal and purple, respectively. (b–c) Crystals nucleating within clusters. Depolarized oblique illumination microscopy of a supersaturated glucose isomerase solution.Reference Maes, Vorontsova, Potenza, Sanvito, Sleutel, Giglio and Vekilov54 The images were taken ∼40 min after the onset of crystallization (b) in parallel and (c) with crossed polarizers, and are separated by ca. 6 s. Only crystals are detectable in crossed polarizers, hence the cluster indicated by a red arrow in (b) and not seen in (c) is liquid and does not contain crystals. The three intensity peaks in the bottom right corner of (b) are also seen in (c), suggesting they represent small crystals within larger liquid clusters.

Irrespective of the protein structure, shape change—either by domain swapping or misassembled oligomers—emerges as a crucial precondition for the formation of the clusters. Thus, contrary to intuitive views of crystallization, limited protein conformational flexibility becomes a necessary facilitator for crystal nucleation.Reference Vekilov and Nishinaga8,Reference Maes, Vorontsova, Potenza, Sanvito, Sleutel, Giglio and Vekilov54,Reference Vorontsova, Maes and Vekilov62,Reference Vekilov and Vorontsova63
Facilitated nucleation and shape change during two-dimensional crystallization of S-layer proteins
Crystallization of certain membrane-forming proteins into native functional structures illustrates two-step pathways via liquid-like precursors, as well as the potential for transformation between multiple-ordered states. S-layers are a class of proteins that assemble into two-dimensional (2D) crystalline sheets forming the outermost membranes of many bacteria and Archaea, which is a domain of single-celled microorganisms.Reference Albers and Meyer64,Reference Sleytr, Messner, Pum and Sara65 The crystal lattice is constructed of S-layer monomers assembled into multimeric units that have the ability to adopt more than one structural conformation within a single membrane.Reference Stewart, Beveridge and Trust66 Individual proteins are produced within the cell, but must be assembled on the outside. They typically overlie a lipid membrane or polymeric cell wall, exhibit crystal symmetries ranging from P1 to P6, and can be reconstituted in vitro into 2D arrays, both in bulk solutions and at surfaces.
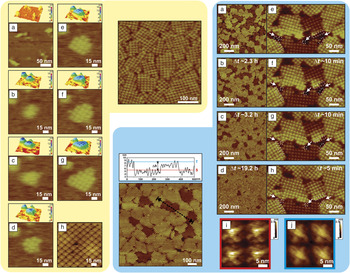
The evolution of S-layer protein assembly on supported lipid bilayers (SLBs) is illustrated in Figure 4 (yellow shaded area).Reference Chung, Shin, Bertozzi and De Yoreo67,Reference Shin, Chung, Sanii, Comolli, Bertozzi and De Yoreo68 These observations reveal a multistage assembly pathway accompanying large-scale shape changes, and are composed of four distinct processes: (1) adsorption of extended monomers onto the SLBs;Reference Kim, Shin, Liu, Oganesyan, Chen, Xu, Kim, Das, Schulze-Gahmen, Holbrook, Holbrook, Martinez, Oganesyan, DeGiovanni, Lou, Henriquez, Huang, Jancarik, Pufan, Choi, Chandonia, Hou, Gold, Yokota, Brenner, Adams and Kim69 (2) condensation into amorphous or liquid-like clusters; (3) rearrangement and folding into crystalline arrays of tetramers; and (4) growth by new tetramer formation at edge sites of the crystalline clusters. The activation energy for the creation of new tetramers was estimated at about 50 kJ mol–1,Reference Chung, Shin, Bertozzi and De Yoreo67 which is about one-half of the free-energy barrier expected for folding of a single protein similar in size.Reference Naganathan and Munoz70
(Yellow shaded area) atomic force microscope (AFM) images of (center) S-layer crystallization on supported lipid bilayers (SLBs). Sequential in situ AFM height images and corresponding surface plots showing the crystallization process. (a) Monomers adsorb onto SLBs. (b–c) Formation of an amorphous and transformation to (d) a crystalline state. (d−g) Crystal growth occurs through the formation of new lattice units only along the perimeter of the crystal. Times are (a) 0, (b) 62, (c) 65.8, (d) 70.3, (e) 88.5, (f) 95.5, and (g) 102.6 min. (h) High-resolution image of a mature crystalline S-layer cluster reveals the tetrameric arrangement and the loop-like structure of each lattice unit. (Blue shaded area) (Center) AFM height image of S-layer crystallization on mica highlights the two domains and the transformation from short (S, red) to tall (T, blue) domains; (top) inset height profile along black dotted line. AFM height images of (a) initial height ratio of tall to short domains is 3:2. (b) Transition of ca. 25% of the short domains into tall domains without dissolution. (c–d) The majority of short domains transform into tall domains. (i–j) Four tetramers from (j) tall and (i) short domains reveal distinct topological differences, indicating that the transformation accompany significant shape changes. (e–h) Transformation of a single domain following incubation over 0.4 h. From (g–h), the short domain grows through adding new tetramers at the bottom edge. The dotted boxes indicated by white arrows highlight that the short domain continued to grow by addition new tetramers at the bottom edge. Times (t) of image collection are (e) 2.5, (f) 2.7, (g) 2.8, and (h) 2.9 h. Adapted with permission from References Reference Chung, Shin, Bertozzi and De Yoreo67 and Reference Shin, Chung, Sanii, Comolli, Bertozzi and De Yoreo68. © 2010 and 2012 National Academy of Sciences.

To examine the role of the lipids during S-layer assembly, bare mica was used as an alternative surface for the assembly. On mica, the assembly proceeds via the formation of two distinct structural domains of S-layers.Reference Shin, Chung, Sanii, Comolli, Bertozzi and De Yoreo68 One, known as the “tall” domain, is identical to that observed on the SLBs. The other, known as the “short” domain, is 2–3 nm shorter in height, though the lateral dimensions of the lattice are nearly identical (Figure 4, blue shaded area). Over time, the short domains transform into the tall domains by “standing up” (Figure 4, blue shaded area). The number density of nuclei of the short and tall phases provides a means for evaluating the relative magnitude of the respective nucleation barriers. The difference between the two barriers was found to be only ca. 1.6 kJ mol–1,Reference Shin, Chung, Sanii, Comolli, Bertozzi and De Yoreo68 which is much less than the barrier for creating new tetramers that was previously discussed.
Analysis of the rates of transformation from short to tall showed that, in contrast to the small difference in the probabilities of forming short and tall phases, the barrier to transformation is quite large. Assuming the transformation of an entire domain is triggered by transformation of a single tetramer (see Figure 4e–h, blue shaded area), that barrier was found to be ca. 61 kJ mol–1.Reference Shin, Chung, Sanii, Comolli, Bertozzi and De Yoreo68 Thus, once the high-energy domains form, the barrier to their relaxation into low-energy domains is nearly as great as the barrier to folding of individual S-layer proteins.
Further image analysis (Figure 4i–j, blue shaded area) showed clear topological differences in the submolecular details of the tetramers in the two domains. For example, the tall domain (Figure 4j, blue shaded area) consists of tetrameric units that are more compact within the lateral plane of the domain and exhibit loop-like regions that are not apparent in the tetramers of the short domain (Figure 4i, blue shaded area).
The observations of S-layer assembly highlight several significant conclusions: Shape change that occurs during the transformation from high-energy, less stable, and short domains to low-energy, stable tall domains is due to a slight conformational transition that is equivalent to folding of portions of the S-layer proteins in order to produce a less extended and more compact structure. Furthermore, S-layer assembly on structureless supports accompanies large-scale shape change. Finally, these observations suggest that the dynamics of protein folding are similar to those of assembly into extended-ordered structures.
Conclusions
Shape change in crystallization is ubiquitous. The examples discussed here provide several instances of the relationship between shape transformation of the crystal building blocks and the resulting crystal structure. In select cases, the packing of molecules in a crystal imposes a novel molecular shape. Two mechanisms of shape change driven by crystallization have been observed. The shape change may occur concurrently with the association of molecules into the crystals if the gain in crystallization free energy is sufficient to overcome the transformation to an unfavorable molecular conformation. Alternatively, if several molecular conformations coexist in the solution or gas, one of them may be trapped in the crystal if it favors crystal packing.
Molecules that are flexible in a free phase have low barriers for conformational variation. Inevitably, upon crystallization, they will adopt a novel shape that may be far removed from that in a free phase. If crystallographic methods are employed to determine the structure of a molecule operating in solution, such as proteins, nucleic acids, and polysaccharides, the emerging structure may be distinct from the one of interest.
Owing to high enthalpy and entropy barriers, crystal nucleation may be very slow. In the case of molecules with conformational variability such as proteins, shape change has emerged as a necessary facilitator of nucleation. Protein molecules may form domain-swapped or misassembled oligomers that enable the formation of protein-rich clusters. Within the clusters, the excess free energy associated with the crystal interface is lower; this reduces the nucleation barrier and accelerates the nucleation rate.
The understanding of the interaction between molecular shape and its crystallization is nascent. This article focuses on several revealing examples, but leaves numerous questions about the mechanisms and consequences of shape change unanswered. For molecules that change shape in response to crystallization pressure, the rules of how crystal packing and symmetry affect the conformation of flexible domains are still to be formulated. The widest knowledge gap is on shape change as crystal nucleation facilitator. This scenario has been studied in depth for a single protein, lysozyme, exhibiting domain-swapped oligomerization. Additional shape transformations and nucleation acceleration pathways must be explored.
Acknowledgments
P.G.V. and K.N.O. were supported by NASA (Grants NNX14AD68G and NNX14AE79G) and NSF (Grant MCB-1244568). S.W.C. gratefully acknowledges support by the Basic Science Research Program through the National Research Foundation of Korea (NRF), funded by the Ministry of Education, Korea (NRF-2015R1D1A1A01059580) and Pusan National University Research Grant, 2014.