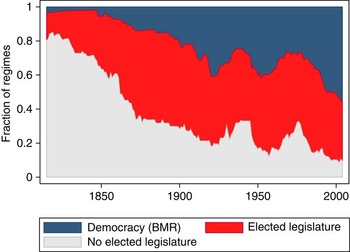
Elections have co-existed with autocracy for centuries. At least twelve Latin American dictatorships held legislative elections in the first half of the nineteenth century, with presidential elections dating back to 1814 in Peru and electoral turnover to 1837 in Colombia.Footnote 1 In Western Europe, representative assemblies extend back to the twelfth century, with a total of sixteen polities featuring parliaments by 1400.Footnote 2 Elsewhere in the world, elections were adopted in the nineteenth century in Liberia, Ethiopia and Japan, and in the first decades of the twentieth century in South Africa, Iran, Turkey, Egypt and Thailand. In total, at least thirty-one countries had experienced legislative elections by 1850,Footnote 3 virtually none of which were fully democratic. Figure 1 displays the fraction of independent countries from 1815–2004 that combined autocracy with an elected legislature.Footnote 4 As early as 1880, nearly two-thirds of autocracies did so.Footnote 5
Democracy and autocratic elections Note: The figure shows the yearly fractions of regimes that were either democratic or combined autocracy with an elected legislature. Note that autocratic elections have been common for nearly two centuries.

Despite this rich history, scholars frequently treat autocratic elections as a new phenomenon. The recent profusion of work on hybrid regimes – which combine authoritarian control with democratic elements like elections, parties and legislatures – has seldom looked more than a few decades into the past.Footnote 6 Because the 1970s represented a low point in the prevalence of autocratic elections, this has led researchers to overestimate their novelty.
This article overviews the history of autocratic elections since 1815 and then tests how autocratic electoral experience predicts democratic development. As a conceptual guide, I adopt Robert Dahl's disaggregation of democracy into the two dimensions of participation (primarily measured by suffrage) and contestation.Footnote 7 As Dahl recognized, the dimensions are useful both to conceptualize democracy (which requires high values on both dimensions) and to track the character of autocratic electoral competition. Although long acknowledged as useful theoretical categories,Footnote 8 there have been surprisingly few attempts to rigorously measure and empirically test the dimensions. With this in mind, I introduce measures of participation and contestation for 169 countries from 1815–2004, extending a similar approach by Coppedge, Alvarez and Maldonado.Footnote 9 I further use the dimensions to code for hybrid regime types.
This article is divided into two parts. First, after describing the measures, I discuss the historical patterns of the electoral dimensions and hybrid regimes since 1815. Although the combination of democratic and authoritarian elements is not new, the way in which they combine has changed markedly. Prior to 1940, hybrid regimes featured high contestation and low participation, typified by the competitive oligarchies of late-nineteenth century Great Britain and Sweden. In contrast, modern electoral authoritarian regimes combine high participation and limited contestation. This shift to high participation is also reflected in the regimes that undergo democratization.
Secondly, I analyze how a country's experience with autocratic elections influences its chances for democratic transition and survival. A growing literature considers whether elections predict democratization,Footnote 10 but has been limited by the time period covered (all post-1972), the small range of electoral indicators used and the oversight of democratic stability. Theoretically, this past work has focused on institutional development and social acculturation to elections. I add to this a consideration of how elections influence autocratic regime power. This expanded framework leads to predictions that differentiate between the two dimensions and between democratic transition and survival. These predictions are tested on all regimes from 1815–2004.
Specifically, I show that histories of both contestation and participation predict democratic survival. For democratization, however, contestation is positive and participation is generally negative. As a consequence, the historical shift to high participation rather than contestation implies a harder road to democracy, but an equal chance at sustaining it. The most important and novel finding is that a longer history with autocratic elections of any kind is strongly positive for democratic survival. In fact, no stable democracy has ever developed without an extended experience with autocratic (or pre-independence) elections.
The results suggest that autocratic electoral history is a major overlooked predictor of democratic development. They further shed light on whether there exist institutional preconditions for democratic stabilityFootnote 11 and whether supporting semi-competitive elections is an effective method of promoting democracy. Lastly, the results help to predict future political developments, including the democratic chances for Iraq, Afghanistan and the countries of the Arab Spring.
Measuring Participation and Contestation
Dahl's insight was that democracy (or what he termed ‘polyarchy’) requires two separate features: a high degree of electoral competition and wide popular inclusiveness.Footnote 12 Historically, these two features have not always gone together, as demonstrated by the competitive oligarchies of nineteenth-century Europe versus the full-suffrage, single-party regimes that dominated Africa during the Cold War. Thus, Dahl argued that these features represent distinct democratic dimensions. Following Dahl, I define the concepts as follows:
Participation: The extent of popular electoral involvement across the citizenry. This does not imply that citizens have a genuine choice over their representatives or that they exercise significant influence.
Contestation: The extent and fairness of electoral competition between parties and distinct interests.
Although the most popular democratic measures remain either dichotomous or one-dimensional, there is growing interest in developing multi-component measures of democracy that capture the complexity of authoritarian regimes.Footnote 13 As this idea goes back to Dahl, most approaches adopt or expand on his categories, with several democracy studies employing proxies for the two dimensions.Footnote 14 For instance, Vanhanen measures contestation and participation by the percentage of legislative seats held by opposition parties and electoral turnout, respectively.Footnote 15
Coding the Dimensions
Recognizing the need for a more comprehensive measurement approach, Coppedge, Alvarez and Maldonado (hereafter, CAM) use principal components analysis (PCA) to combine multiple existing codings of democracy into measures of participation and contestation for 1950–2000.Footnote 16 Both dimensions use variables selected from seven democracy datasets: Polity IV,Footnote 17 Freedom House,Footnote 18 DD,Footnote 19 Cross-National Indicators of Liberal Democracy,Footnote 20 the Cross-National Time-Series archive,Footnote 21 the Measures of Democracy projectFootnote 22 and the CIRI Human Rights Data Project.Footnote 23 Using PCA, they verify that participation and contestation are distinct (though not orthogonal) dimensions over 1950–2000. Moreover, which dimension each variable loads onto is highly consistent over time.
I adopt a similar approach that extends back to 1815. The assignment of variables to each dimension closely follows CAM. In the Appendix, I use PCA to verify that the relationship between variables and dimensions holds steady back to 1815.
Participation is measured by suffrage and electoral turnout in regular elections. Contestation is measured by the existence of independent political parties, the freedom of electoral competition, the extent of intragovernmental constraints, legislative membership by opposition parties and the closeness of national votes. The Appendix details the exact variables assigned to each dimension. Note that if a country lacks elections and an opposition, both dimensions equal 0. I scale the dimensions to be comparable over time (as new measures become available) and to each lie between 0 and 1 over the whole sample.
I make two main departures from CAM. First, I construct each dimensional measure using an intuitive aggregation instead of year-to-year PCA. Rather than simply averaging all of the variables that correspond to each dimension, I first average variables that measure an identical or highly similar political feature. For instance, if two variables measure the freedom of party competition, these are first averaged, then this mean is added to the final aggregation. In this way, these features are not double- or triple-weighted.Footnote 24 Compared to PCA, this method is conceptually more tractable and makes it easier to track changes in the dimensions over time.
Secondly, I consider liberalism to be a distinct dimension, whereas CAM fold it into contestation. This maintains contestation as a measure of electoral competition. Although I constructed a separate coding of liberalism from three measures of civil liberties, I omit it here as the current study is historically focused and the data is limited to 1972–2004.Footnote 25
Despite these departures, my measures and the corresponding measures from CAM are very highly correlated. For the overlapping years 1950–2000, participation is correlated at 0.94 and contestation is correlated at 0.98. In total, my approach produces measures of participation and contestation across 190 years and 169 countries, for a total of 12,863 data points. This dataset is available for public use.
Coding Hybrid Regimes
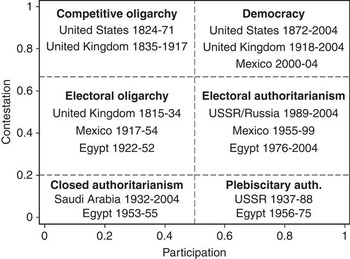
The dimensions are used to categorize countries into six regime types, divided by a threshold on participation and two thresholds on contestation. The regime types closely follow the conceptual categories used by Dahl and Bratton and van de Walle.Footnote 26 Figure 2 displays this typology and lists examples of each regime type.
Typology of regimes Note: The figure presents a simple typology of six regime types. The thresholds are 0.5 for participation and 0.2 and 0.67 for contestation. Country examples are shown for each regime type.

Measuring regime types from thresholds on a continuous scale is a common approach in democracy studies.Footnote 27 Creating such categories is particularly important for multiple dimensions of democracy, as there are theoretical reasons to test particular combinations of the dimensions. However, the chosen thresholds are often arbitrary.Footnote 28 To address this concern, I show that the findings are highly robust to varying the threshold values.
To categorize regimes, I first distinguish between low- and high-participation types. This reflects the historical distinction between regimes with restricted versus wide or universal suffrage. The threshold for participation is 0.5, which is close to the mean.Footnote 29
Contestation is slightly more complex, as electoral autocracies like present-day Russia and Singapore clearly lie between democracies and closed autocracies on the scale of political competitiveness. Thus a meaningful distinction can be made between regimes that allow no competition at all, controlled competition and democratic competition. The lower threshold is 0.2, chosen to classify communist and other single-party regimes in the lowest contestation range.Footnote 30 The higher threshold is 0.67, which maximizes the correlation with the democracy measure supplied by Cheibub, Gandhi and Vreeland.Footnote 31
Democracies combine high contestation and high participation. Competitive oligarchies feature contestation at the same high level, but restrict participation, as was typical in nineteenth-century Europe.
Closed authoritarian regimes (typified by military dictatorships and monarchies) have low values on both dimensions, and hence lack any significant electoral institutions. Low contestation can also combine with high participation if regimes hold non-competitive elections with wide suffrage, such as in the Soviet Union and North Korea. I refer to these as plebiscitary authoritarian.
Finally, regimes with middle values of contestation allow electoral opposition, but manipulate it to below democratic standards. Electoral authoritarian regimes combine this with wide participation. Electoral oligarchies instead restrict suffrage much like competitive oligarchies. As we will see, this is an overlooked group that in fact represents the modal regime type prior to 1920. I refer to all countries that are not democratic or closed authoritarian as hybrid regimes.
HISTORICAL PATTERNS
I now consider how the democratic dimensions and regime types have varied since 1815.
General Trends
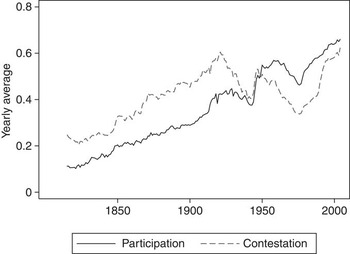
Figure 3 plots each dimension's annual average from 1815–2004. Again, each dimension is scaled to vary between 0 and 1. The two measures (especially contestation) track the wave-like pattern noted by Samuel Huntington: the First, First Reverse and Second Waves of democratization up to 1950; the Second Reverse Wave from 1950–1972; and the Third Wave post-1972.Footnote 32 Note also the large rise in participation relative to contestation since the early twentieth century. Whereas participation steadily climbed (with the exception of the Second Reverse Wave) for the entire period, contestation reached a peak value in 1921 that it did not regain until 1996.
Variation in participation and contestation Note: The figure shows the yearly average values of participation and contestation across all countries for 1815–2004. Each measure is scaled to range between 0 and 1 for the entire time period. Note the large gain for participation relative to contestation since 1920.

Patterns of Contestation and Participation
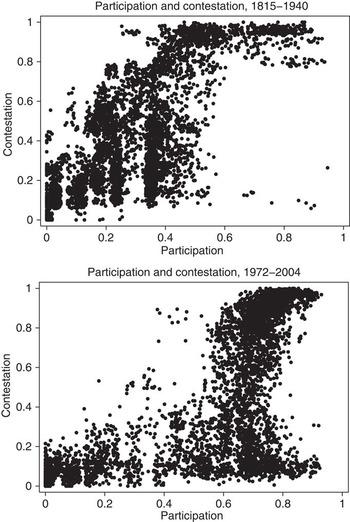
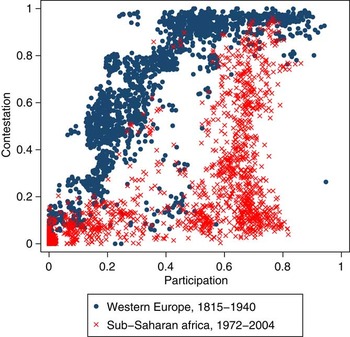
As important as the trends in the dimensions is how they combine differently across time periods. The top panel of Figure 4 plots all country-years from 1815–1940 by participation and contestation. The bottom panel does the same for 1972–2004. The pronounced historical shift is clear. Prior to 1940, essentially all hybrid regimes featured high or moderate contestation and low participation.Footnote 33 After 1972, they featured high participation and low or moderate contestation. As seen in Figure 5, the difference is even more stark if we compare Western Europe and the British settler colonies for 1815–1940 (blue points) to sub-Saharan Africa for 1972–2004 (red x's). Whereas regimes in the earlier period usually passed through competitive oligarchy on the way to democracy, regimes in the modern period tend to democratize from plebiscitary or electoral authoritarianism. A primary focus of this article is to determine whether these alternative paths matter for later democratic stability.
Participation and contestation Note: The figure displays country-years arranged by participation and contestation (jittered for clarity), with 1815–1940 in the top panel and the third wave of democracy (1972–2004) in the bottom panel. Nearly all hybrid regimes in the earlier period featured high contestation and low participation, whereas modern hybrid regimes feature high participation and limited contestation.

Two paths to democracy (Western Europe vs. Sub-Saharan Africe) Note: The figure shows country-years arranged by participation and contestation (jittered), with Western Europe (1815–1940) in blue points and sub-Saharan Africa (1972–2004) in red x's. It is clear that the two regions followed very dissimilar paths to democracy. The blue outlier in the bottom right is Germany in 1933. Most of the outlying red x's in the middle to upper left represent South Africa or Mauritius.

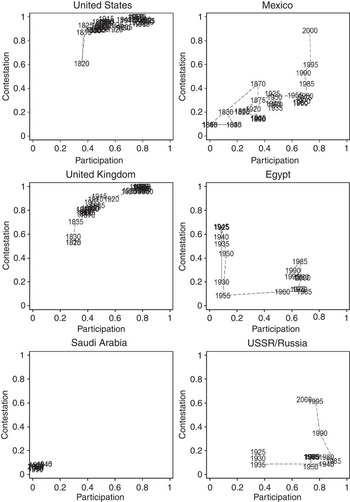
The patterns are further illustrated by Figure 6, which displays the varied development paths of the United States, Mexico, the United Kingdom, Egypt, Saudi Arabia and Russia. The United States and United Kingdom are emblematic of the competitive oligarchy route to democracy, first experiencing high contestation and then gradually expanding suffrage. Mexico represents the modern route to democracy, shifting from closed autocracy to high-suffrage elections and then gradually improving contestation. Russia and Egypt both moved from closed autocracy to plebiscitary authoritarianism and have progressed up the ladder of contestation in recent years. Interestingly, Egypt moved toward competitive oligarchy beginning in the 1930s, but this was halted by Gamal Nasser's 1952 coup. Lastly, Saudi Arabia lacks any participation or contestation.
Regime type development for six countries Note: The figure displays the disparate electoral development patterns of the United States, Mexico, the United Kingdom, Egypt, Saudi Arabia and Russia. Country-years are plotted by participation and contestation. For clarity, one data point is shown for every five years.

A few scholars have noted the historical shift pictured in Figure 4 to some degree, albeit without precise measurement and without explaining why the patterns differ.Footnote 34 Two factors appear to be of the greatest importance. The most critical is the post-war spread of democratic norms and international influence. Since suffrage and the existence of elections are more easily observed and policed than ‘fair competition’, they attract greater international pressure, whereas democracy promoters remain hesitant to get involved in societies’ underlying power structures.Footnote 35 Partial suffrage (as prevailed in South Africa to great international opprobrium) has become particularly objectionable, effectively blocking the democratizing path through competitive oligarchy.
A second factor is the end of colonialism, which often empowered mass movements that solidified into dominant ruling parties.Footnote 36 Across Africa, the first organized political party to espouse independence and claim the mantle of nationalism gained an enormous popular advantage that quickly could not be challenged.Footnote 37 In fact, colonial administrators often collaborated with the party leader to handle the turnover of power. Further, colonialism itself often eliminated the pluralism and regional divisions that foster opposition parties.Footnote 38 Developing countries were often left with political monopolies that adhered to their former colonizers’ electoral procedures but allowed no substantive challenges. This is the essence of electoral authoritarianism.
Regime Types
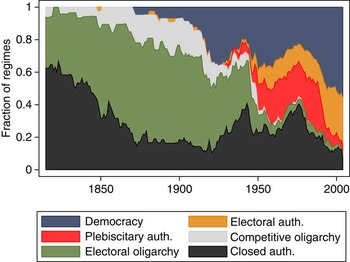
For a more nuanced historical comparison, Figure 7 displays the prevalence of the six regime types for each year from 1815–2004. From 1815 to 1910, there was a steady shift from closed autocracy to competitive and electoral oligarchy, with the proportion of closed autocracies falling from 63 per cent to 14 per cent of all countries. The 1910s saw several competitive oligarchies (such as Sweden and the Netherlands) democratize. Interestingly, the total share of hybrid regimes has remained roughly constant since 1920, but has shifted its composition internally. The key turning point was the end of World War II, when virtually all hybrid regimes shifted from low-participation to high-participation types. Whereas competitive and electoral oligarchies were sixty times as common as electoral and plebiscitary autocracies from 1815–1940, the latter group is nine times as common after 1972.Footnote 39 There followed a resurgence of closed authoritarianism, which left the fraction of autocracies with some degree of political contestation at an historic low in the 1970s. Finally, after the Soviet Union's fall, there was a shift from plebiscitary to electoral authoritarianism, centered in Eastern Europe and sub-Saharan Africa.Footnote 40
Regime type distribution by year Note: The figure shows the distribution of six regime types in each year from 1815–2004. Note the preponderance of electoral oligarchy prior to 1940, the disappearance of electoral and competitive oligarchy since then and the rapid growth of electoral authoritarianism after the Cold War.

A striking feature of Figure 7 is the prevalence of electoral oligarchy, which represents nearly half of all country-years prior to 1940 but has not been the specific focus of any research to my knowledge. About half of all cases of electoral oligarchy occurred in Latin America prior to 1940; other examples include Spain for most of 1834–1922, Romania from 1878–1939 and Japan from 1868–1914. As they feature controlled political competition that is comparable to modern electoral autocracies, they are a promising subject for future comparative work. Their prevalence also dispels the notion that manipulated electoral competition is new to autocracies.
Democratic Transitions
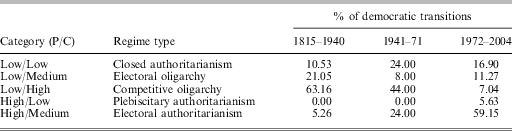
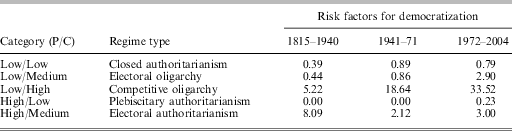
The regime types from which democratization occurs have varied greatly over time. Table 1 displays the percentage of democratic transitions represented by each regime type for three different time periods. Prior to 1940, most democratic transitions occurred from competitive oligarchies, especially in Europe and Latin America. For 1941–71, the preceding regime types were more varied, with closed and electoral authoritarianism becoming more likely. After 1972, the majority of regimes democratized from electoral authoritarianism.Footnote 41
Share of Regime Types Preceding Democratization (by Time Period)

Note: The first two columns classify the regime types by values of participation and contestation. The third through fifth columns show the percentage of democratic transitions that occurred from each regime type for three time periods (N=19; 25; 71).
Looking at the percentage of democratic transitions is perhaps misleading, since the prevalence of each regime type also changed over time. Table 2 presents the regime types’ relative risk factors for democratization, which divides the percentage of democratic transitions by the share of regime-years. Values above 1 indicate more democratic transitions than would occur by chance. Competitive oligarchy and electoral authoritarianism are consistently above 1, with the former the largest (and rising) over time. Plebiscitary authoritarianism presents the lowest risk.
Relative Risk Factors for Democratization from each Regime Type

Note: The first two columns classify the regime types by values of participation and contestation. For three time periods, the third through fifth columns show the share of democratic transitions represented by each regime type divided by its share of regime-years (N=5,223; 2,802; 4,838).
The legacies of these regime types for later democratic stability are remarkably enduring. Consider the fifty-seven countries in this article's dataset that existed before 1920 and after 1985. Twenty of twenty-five countries that experienced competitive oligarchy prior to 1920 were stable democracies for all of 1985–2004, compared to only thirteen of the thirty-two remaining countries. The remainder of this article rigorously tests the relationship between autocratic electoral experience and democracy.
Electoral History and Democratic Development
Past Work
A number of recent empirical studies argue that autocratic elections predict democratization, with a particular focus on the cumulative effect of electoral experience.Footnote 42 In post-1989 sub-Saharan Africa, Bratton and van de Walle find that both participation (the number of past elections) and contestation (the share of opposition seats in the legislature) predict pro-democracy protest and future democracy levels.Footnote 43 Also looking at sub-Saharan Africa, Lindberg finds that the number of past multiparty elections is positively related to civil rights and the chance of electoral turnover.Footnote 44 Teorell and Hadenius confirm this effect for a global sample post-1972.Footnote 45 Looking at 1975–2004, Brownlee shows that competitive authoritarian regimes are just as stable as other autocracies, but are more likely to democratize when they do fall.Footnote 46
Although instructive, this empirical work has been limited in several respects. First, it has been restricted in time to after 1972 and often to the post-Cold War period.Footnote 47 Secondly, past studies have concentrated on relatively simple measures, such as the historical stock of multiparty elections, rather than comprehensive codings of participation and contestation.Footnote 48 Thirdly, no empirical study has rigorously tested the effect of electoral experience on democratic survival.Footnote 49 Democratic transition and survival are not necessarily affected in the same way by the same factors,Footnote 50 and both must be considered for a complete picture of democratic development.
Theory: Two Effects of Autocratic Elections
I argue that autocratic elections influence democratic development through two distinct effects, which vary in strength and direction by the elections’ characteristics. In brief, the first effect relates to the independence and pro-democratic nature of elements outside the regime, including average citizens. The second relates to the political power of the autocratic regime itself. The two effects combine to yield novel predictions that distinguish between contestation and participation and between democratic transition and survival.
As emphasized by Dahl, Bratton and van de Walle and Lindberg,Footnote 51 the first effect encompasses a cluster of long-term institutional and behavioral changes that stem from semi-competitive elections and support democratization. On the institutional side, elections require a set of political organizations – such as a legislature, judiciary and parties – that can fight over time for greater independence.Footnote 52 On the behavioral side, even autocratic elections help to spread a democratic culture of equality and sovereignty among the enfranchised, raising demands for civil liberties and electoral fairness.Footnote 53 A survey of twelve African countries found that a history of either multi- or single-party competition increases popular demands for democracy.Footnote 54 This popular emphasis on elections encourages autocrats to appeal to election victories for legitimacy, in turn making electoral manipulation more costly. As Lindberg sums up, ‘the electoral cycle creates a positive spiral of self-reinforcement leading to increasingly democratic elections’.Footnote 55
Although past work has emphasized democratization, the institutional legacy of autocratic elections should also influence the stability of young democracies. Without previous electoral experiences, electoral institutions, opposition parties and voter attachments must be created de novo after democratization, which can be highly chaotic. For instance, O'Donnell and Schmitter argue that the controlled contestation in autocratic Brazil after 1964 provided essential political experience to regime opponents and thereby stabilized the country's politics after democratization.Footnote 56 In contrast, Mansfield and Snyder warn that war and democratic failure are likely if countries democratize without ‘the strong political institutions needed to make democracy work (such as an effective state, the rule of law, organized parties that compete in fair elections, and professional news media)’.Footnote 57
In addition to this positive institutional-behavioral effect on democracy, we also need to consider a second effect: the influence of elections on autocratic regime power. This acknowledges the growing literature on the use of democratic elements to bolster autocratic co-optation and control.Footnote 58 For instance, elections can serve to solidify clientelistic linkages with citizens and local leaders, which Lust-Okar and Blaydes argue is their primary function in the Middle East.Footnote 59 Ruling parties also employ controlled elections to publicly display dominance,Footnote 60 to identify and forestall budding opposition movements,Footnote 61 and to communicate ideology and propaganda.Footnote 62
The institutional effect should positively contribute to both democratic transition and survival, whereas greater autocratic power should only deter democratic transition. Further, I now argue that all electoral experiences promote democracy through the institutional mechanism, whereas contestation and participation have divergent effects on autocratic power.
Contestation
Contestation is generally regarded as more beneficial than participation for democratic development.Footnote 63 In particular, theorists favor the route to democracy (characteristic of Western Europe) in which contestation exceeds participation.Footnote 64 According to Bratton and van de Walle, ‘[G]etting to democracy is much more difficult from a regime that has no tradition of political competition, however inclusive and participatory it may be.’Footnote 65
Indeed, contestation should promote democracy through both effects discussed above. First, a history of competitive elections produces strong electoral institutions, experienced political parties, and popular attitudes that favor both democratization and later democratic stability. Secondly, higher contestation generally implies weaker autocratic control. Competitive elections threaten turnover, chip away at legislative majorities, provide an opening for elite defectionsFootnote 66 and can serve as public catalysts that help democratic movements solve their collective action problems.Footnote 67 Further, contestation opens up the political space to opposition groups that can press for political reforms.Footnote 68 The opposition in Mexico, for instance, turned the democratic quality of the regime into a potent campaign issue, culminating in democratization through electoral turnover.Footnote 69 This suggests the following hypothesis:
Hypothesis 1: A history of higher contestation is positive for both democratic transition and survival.
It is also worth considering the specific effect of competitive oligarchy, the autocratic type with the highest level of contestation. Pointing to the many successes in Western Europe, Dahl identifies the path through competitive oligarchy as especially conducive to democratic survival because it allows a small set of elites to first establish among themselves ‘the rules, the practices, and the culture of competitive politics. … [A]s additional social strata were admitted into politics they were more easily socialized into the norms and practices of competitive politics’.Footnote 70
I argue instead that competitive oligarchy should strongly predict democratization. This follows for the simple reason that the level of contestation is sufficiently high that power is frequently shifting between parties. This opens the door to democratization when the party in power determines that expanding suffrage is in its electoral interest, a pattern that occurred repeatedly in nineteenth-century Western Europe, as well as in Argentina, Uruguay and Colombia.Footnote 71 These two perspectives suggest the following:
Hypothesis 2A: A history of competitive oligarchy is positive for democratic survival.
Hypothesis 2B: A history of competitive oligarchy is positive for democratic transition.
Participation
Holding contestation fixed, does extending participation encourage democracy? Unlike for contestation, I argue that participation has two countervailing effects. On one hand, participation extends electoral practices to a wider population, encouraging more citizens to become involved in politics and to gradually increase their demands for effective voice. For instance, Bratton and van de Walle find that where elections (regardless of contestation) ‘were a regular feature of African political regimes, elites and masses became socialized to accept participatory political roles’.Footnote 72 As a result, past electoral experiences predicted the outbreak of pro-democracy protest. In addition, elections with wide suffrage encourage regimes to invest in mass parties, which are in turn adaptable to democracy. Thus the institutional-behavioral effect of participation is likely positive, albeit weaker than for contestation.
On the other hand, greater popular involvement with uncompetitive elections is likely to bolster regime power, thus negatively impacting democratization. Wider participation brings more citizens into a political environment that is firmly controlled by the regime, enabling the ruling party to broaden clientelistic linkages, monitor dissidents, spread its ideology and demonstrate dominance.Footnote 73 Further, highly flawed elections can engender disillusionment with electoral politics.Footnote 74 Lastly, democracy may seem more threatening to elites in countries with broad electoral participation, as it implies high social mobilization and thus a higher risk of redistribution.Footnote 75 This threat can reinforce elite coalitions and imperil the moderate pacts that are often key to democratic transitions.Footnote 76
As the two effects oppose each other in autocracy, participation should have a null or negative effect on democratic transition. However, the negative effect no longer bites once democracy is installed, implying a positive effect of participation on democratic survival.
Hypothesis 3: A history of higher participation is positive for democratic survival, but not for democratic transition.
Finally, what about closed authoritarianism? A total absence of elections represents the extreme case of a weak institutional and behavioral basis for democracy. Following democratization, countries with a history of non-electoral autocracy suffer from immature or non-existent electoral bodies, opposition parties critically lacking in experience, and citizens low in democratic norms and partisan attachments. Further, they usually lack former ruling parties that remain electorally competitive after democratization, as occurred in Mexico, Taiwan, Guinea-Bissau and Ghana. Despite being carryovers from the autocratic period, these parties provide a degree of political continuity and can serve to protect elite interests, lessening the risk of coups.Footnote 77 Thus, greater experience with autocratic elections promotes democratic survival.
In contrast, the impact of closed authoritarianism on democratic transition is unclear. The absence of elections inhibits the development of pro-democratic popular attitudes and opposition groups.Footnote 78 However, closed regimes also lack the advantages of mass elections for credibly coopting citizens and elites, leaving them more vulnerable to violent opposition.Footnote 79 As Brownlee has shown, closed autocracies are more likely to break down due to coups and revolutions, but less likely to democratize in the aftermath.Footnote 80 Similar to participation, the combination of a weaker regime with less internal pressure for democracy implies a null relationship between closed autocracy and democratic transition.
Hypothesis 4: Relative to experience with autocratic elections, a history of closed authoritarianism is negative for democratic survival.
Empirical Results
Empirical Approach and Data
This section tests how experience with autocratic elections influences democratic development. As in work by Przeworski et al. and Houle, I employ dynamic probit models that separately predict democratic transition and survival.Footnote 81
The main explanatory variables are weighted averages of each country's electoral experiences, using an exponential discount of 0.99 per year.Footnote 82 This places greater weight on more recent experiences, while still including a country's entire history. For instance, weighted contestation for country i in year t, which is denoted ΣContestationit , is calculated in the following manner:
 $$\Sigma Contestatio{{n}_{it}}\, = \,\frac{{\mathop{\sum}\limits_{\tau \geq 0} {{{0.99}}^\tau } \,Contestatio{{n}_{i,t\, - \,{\rm{\tau }}}}}}{{\mathop{\sum}\limits_{\tau \geq 0} {{{0.99}}^\tau } }}$$
and similarly for other variables. The denominator normalizes ΣContestationit to lie on the same scale as Contestationit .
I consider in turn weighted histories of the dimensions, regime types, and experience with a legislature and multiparty elections. This focus on electoral history reflects the theoretical framework and allows for a close comparison between democratic transition and survival. However, as a robustness check, the transition models are also tested using single-year levels of the variables (lagged by one year). The main results cover 1815–2004. The results are also shown restricted to 1972–2004 (the third wave). All models use robust standard errors clustered by country.
For the democratic survival models, the historical averages of the dimensions partially pick up variation experienced under democracy. To maintain the focus on autocratic experience, I control for the weighted history of democracy and also confirm that the results are unchanged when the measures are held constant at the point of democratization. Note that this is not an issue for testing the regime types.
To define democracy, I primarily rely on my own coding, but also check the results using alternative thresholds on the dimensions and Boix, Miller and Rosato's dichotomous democracy measure,Footnote 83 which is not among the variables used to construct the dimensions. An important concern is whether it is appropriate to use variation in the dimensions to predict democratization, given that democracy is defined using the dimensions. In effect, the models test how a country's location on the participation-contestation nexus predicts its likelihood of moving into the upper-right. Although it may seem almost tautological that positions closer to the upper-right will improve this likelihood, this is not the case, which amplifies the surprise of the results. Further, transitions are not counted if a country crosses a threshold and returns to its original regime type without moving at least 0.1 on a dimension. This prevents several transitions being counted if a country shifts slightly back and forth across a threshold.
Since the dimensional thresholds defining democracy and the hybrid regime types are by necessity somewhat arbitrary, I retest all of the models using alternative boundaries. For each of the three thresholds (one for participation, two for contestation), I consider four evenly spaced alternatives, holding the other thresholds fixed. Specifically, I vary each threshold by steps of 0.05 in both directions. For instance, the participation threshold is tested for values between 0.4 and 0.6.Footnote 84 This produces twelve alternative regime-type measures. As discussed below, the results are highly robust to these alternatives.
A final note is warranted on causation. As with all observational studies, great care is needed in the causal interpretation of the results. At minimum, they demonstrate novel and important associations between electoral experience and democratic development. However, the theoretical argument (and several features of the analysis) strongly support a causal role for autocratic elections. First, the models test long-term institutional legacies that extend back decades, lessening the risk of confounding from short-term political or economic characteristics. In addition, the results are robust to lagging the electoral histories by up to a decade, and in some cases by thirty years. Secondly, omitted variables are less likely to affect the analysis of democratic survival, which provides this article's most novel results. Omitted variables may simultaneously predict an autocracy's adoption of elections and its likelihood of democratizing. For democratic survival, however, the autocratic electoral experience is prior to the democratic spell. Thirdly, I control for various potential confounders, such as socio-economic structure, region and other autocratic institutions, and the results are highly robust to varying controls. Thus, there are clear reasons to infer causation. However, future work can build on these results by exploiting sources of exogeneity in autocratic elections.
Control Variables
The models include the following controls, all lagged by one year. Economic development is accounted for by logged real GDP Per Capita (in 2000 US dollars).Footnote 85 GDP Growth is the annual percentage change in GDP per capita. To control for colonial legacies, I include dummy variables for whether a state was formerly a British Colony or Never Colonized. I include two variables commonly thought to track regime strength: Resource Dependence (revenues from oil, gas, coal and metals as a percentage of GDP)Footnote 86 and Military Size (military personnel as a percentage of the population).Footnote 87
The models include region fixed effects and, to account for democratic diffusion, the surrounding region's average Polity level.Footnote 88 Because the pace of democratic development has changed greatly over time, I include decade fixed effects.Footnote 89 To account for each country's democratic legacy, I control for the number of past Democratic Breakdowns and the weighted history of democracy (ΣDemocracy). Because of data limitations, I only control for the Geddes autocracy categories (military, personalist and party-based) as a robustness check.Footnote 90
Finally, to account for the age of the current regime type, I add cubic splines of regime duration with three knots (at the 25th, 50th and 75th percentiles).Footnote 91 This is a highly flexible method that avoids assuming any particular functional form for the duration. I also confirm that the results hold using alternative duration models (Cox proportional hazard, Weibull and lognormal).
Main Results
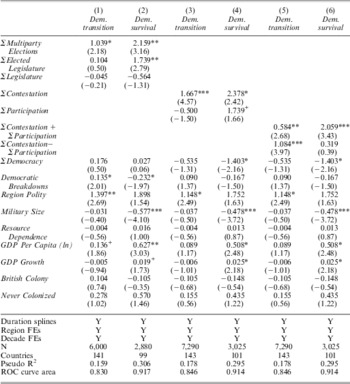
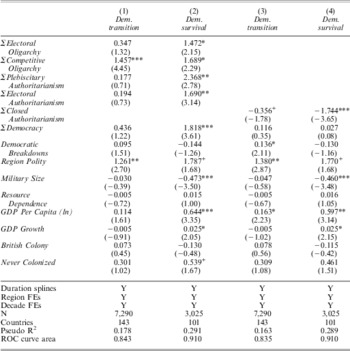
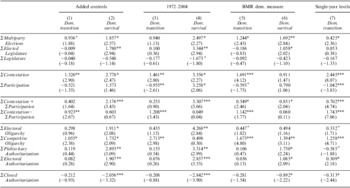
Tables 3 and 4 present the main results; each pair of models separately tests democratic transition and survival using probit. Table 5 presents four sets of robustness checks, with additional checks contained in an online appendix.
Dynamic Probits Predicting Democratic Transition and Survival

Note: The models are dynamic probits that separately predict democratic transition and survival. Years are 1815–2004. The main predictors are weighted historical measures of electoral experience. t-values (from robust standard errors clustered by country) are in parentheses beneath each coefficient.+= p < 0.1, *=p < 0.05, **=p < 0.01, *** = p < 0.001.
Dynamic Probits Predicting Democratic Transition and Survival

Note: The models are dynamic probits that separately predict democratic transition and survival. Years are 1815–2004. The main predictors are weighted historical measures of electoral experience. t-values (from robust standard errors clustered by country) are in parentheses beneath each coefficient. += p < 0.1, *=p < 0.05, **=p < 0.01, ***=p < 0.001.
Robustness Checks for Democratic Transition and Survival

Note: The table summarizes several robustness checks of the previous models. Each column corresponds to a dynamic probit of either democratic transition or survival, with horizontal lines separating the individual probits. A total of 35 models are displayed. Control variables are included, but not shown. Models 1–2 add five additional control variables. Models 3–4 limit the sample to 1972–2004. Models 5–6 use the Boix, Miller and Rosato (2013) coding of democracy for the dependent variable. Model 7 uses single-year values of each electoral variable instead of weighted histories. t-values (from robust standard errors clustered by country) are in parentheses beneath each coefficient. += p < 0.1, *=p < 0.05, **=p < 0.01, ***=p < 0.001.
Before turning to the two dimensions, Models 1 and 2 in Table 3 test experiences with multiparty elections, an elected legislature and any legislature.Footnote 92 These provide simpler, but more concrete, indicators of autocratic institutions. Consistent with Wright and Escribà-Folch, legislatures (elected or not) do not predict democratization.Footnote 93 However, a novel finding is that experience with an elected legislature is positive for democratic survival. Consistent with Lindberg, a richer history with multiparty elections is conducive to democratic transition and survival.Footnote 94 Thus, matching the predictions, all forms of electoral experience predict democratic survival, but competitive elections drive democratization.
Models 3 and 4 show the first results for the dimensions and lend clear support for Hypotheses 1 and 3. Contestation strongly predicts both transition and survival. In contrast, participation is positive (and borderline significant) for survival, but is slightly negative for democratization. If the likelihood of transition is at its mean, shifting ΣContestation from 0.09 (the average in closed authoritarianism) to 0.81 (the average in competitive oligarchy) increases the annual likelihood of democratization by about 8.0 per cent. For democratic survival, a one-standard-deviation decrease in ΣContestation makes democratic breakdown 4.6 per cent more likely each year. For ΣParticipation, the equivalent effect is 1.7 per cent.
Models 5 and 6 instead test the sum and difference between the dimensions. Controlling for the sum, the latter tests whether a high-contestation path to democracy (like Western Europe in Figure 5) is superior to a high-participation path (like sub-Saharan Africa in Figure 5). As expected, the sum contributes to both transition and survival, whereas the degree to which contestation exceeds participation is only predictive of democratization. Thus, contestation is more critical for reaching democracy, but the two dimensions act as substitutes for stabilizing democracy.
To investigate specific combinations of the dimensions, Table 4 tests the regime types. Models 1 and 2 test the four hybrid regimes, with closed authoritarianism as the reference group. Models 3 and 4 reverse this, using the set of hybrid regimes as the reference group. Supporting Hypothesis 2B, Model 1 shows that competitive oligarchy strongly predicts democratization. A long-term competitive oligarchy has an estimated 5.3 per cent annual chance of democratizing, whereas a long-term closed autocracy has a 0.1 per cent chance. The remaining hybrid regime types are positive for democratic transition, but not significantly so. As Model 3 shows, hybrid regimes as a group are positive (and borderline significant) for democratization.
For democratic survival, all hybrid regime types are significantly positive relative to closed autocracy, with only slight differences among them. Thus, democracies are more likely to survive if they experience autocratic elections prior to democratization, even highly uncompetitive ones. Refuting Dahl's expectation, a history of competitive oligarchy does not stand out – an electoral authoritarian past is equally supportive of democracy. In Model 2, we also see that ΣDemocracy is positive for democratic survival, which is consistent with a pattern of democratic consolidation. Surprisingly, though, democratic experience has about the same effect as experience with autocratic elections.
Model 4 confirms that a history of non-electoral autocracy is strongly negative for democratic survival. Holding other variables at their means, a democracy with a full legacy of autocratic elections will survive an average of fifty years, whereas a democracy with ΣClosed Authoritarianism one standard deviation above average will last an average of nineteen years. For all eight democratic transitions in which ΣClosed Authoritarianism exceeded 0.6, the country returned to autocracy within fifteen years. In only one case (Thailand in 1992, which fell to a coup in 2006) did democracy last longer than ten years. Therefore, significant experience with autocratic (or pre-independence) elections appears to be a necessary condition for robust democratic stability.Footnote 95
Results for the control variables are highly consistent across models. The regional Polity average is positive for democratization. GDP Per Capita strongly predicts democratic survival, but transition only weakly.Footnote 96 Economic growth bolsters democratic stability. Resource dependence and colonial history have no effect. Finally, an interesting finding is that Military Size is strongly negative for democratic survival.
Robustness Checks
Table 5 summarizes four sets of robustness checks. All of the preceding models are included, with horizontal lines dividing the separate probits. The control variables are included, but not shown. Models 1 and 2 add further controls for urbanization,Footnote 97 land equality (the percentage of land cultivated by family farms),Footnote 98 logged population size,Footnote 99 literacyFootnote 100 and the size of the agricultural sector.Footnote 101 Models 3 and 4 limit the sample to 1972–2004. Models 5 and 6 use the Boix, Miller and Rosato democracy coding (which covers 1800–2007) for the dependent variable.Footnote 102 In the most important check, Model 7 predicts democratic transition from single-year levels of the electoral variables (lagged by one year) rather than their weighted histories.Footnote 103
I consider first how the results hold up in Models 1–6. Multiparty elections and elected legislatures remain positive for democratic survival, but the former's effect on democratic transition is inconsistent. Contestation generally remains strongly positive for both democratic transition and survival, while participation remains negative for transition and positive for survival (although these effects are inconsistently significant). Participation is particularly negative for transition after 1972. A strong asymmetry is evident whereby the dimensions’ sum predicts democratic survival and their difference predicts transition. For the regime types, the previous pattern holds – only competitive oligarchy predicts transition, but all hybrid regimes predict survival relative to closed authoritarianism.
Model 7 deserves special attention. Holding a multiparty election in the last four years predicts democratization. Contestation remains positive and participation is significantly negative. Competitive oligarchy remains strongly positive, but now plebiscitary authoritarianism is negative, although the effect is small in magnitude. In total, closed autocracies are significantly less likely to democratize than hybrid regimes.
The online appendix displays several further robustness checks. I first show that the results are similar or stronger using alternative duration models (Cox proportional hazard, Weibull and lognormal) and additional controls (such as the Geddes autocracy categories, year fixed effects and years of independence). I also consider democratic survival models that restrict variation in the weighted histories to experience under autocracy. I then show the results are robust to lagging the electoral histories by five and ten years. Lastly, I alter the thresholds defining the regime types, with largely unchanged results.Footnote 104
Conclusion
Autocratic elections have a long and complex history, which is intertwined with the history of democracy. Experience with autocratic elections can greatly improve a country's chances at attaining and securing democracy, but contrary to the existing literature, it is the impact on democratic survival that stands out. Stable democracy has never developed without an extended prior experience with autocratic or pre-independence elections.
This finding contributes to the ongoing debate over the institutional preconditions for democratic stability.Footnote 105 However, unlike Zakaria, who calls for first establishing executive constraints and an effective rule of law prior to democratization,Footnote 106 this article demonstrates the need for regular elections. As Carothers argues, a ‘gradualist’ path to democracy with popular participation and steadily rising electoral competition is highly propitious for future democratic survival.Footnote 107 Looking to recent developments in the Middle East, this casts doubt on the democratic chances of Afghanistan and Libya, whereas Tunisia, Egypt and Yemen all have significant electoral histories and are thus reasonably well situated to sustain future democracies.
Although autocratic elections are nothing new, the combination of multiparty competition with full suffrage has only recently become the autocratic norm. As these electoral authoritarian regimes have a weak propensity to democratize compared to competitive oligarchies, the historical shift to high participation implies a tougher path to democracy, but an equal chance at sustaining it. This vindicates the emphasis in democracy promotion on facilitating semi-competitive elections.Footnote 108 If high contestation cannot be secured, encouraging regular elections and wide suffrage is an effective method of securing democracy in the long run. Autocratic elections may begin as facades and may serve for a time as tools of control and co-optation, but the end result is often the slow evolution of simulation into substance.
APPENDIX
Constructing the Democratic Dimensions
Coppedge, Alvarez and Monaldo (CAM) construct measures of contestation and participation using principal components analysis (PCA) of various measures of democracy, applied to each year from 1950–2000.Footnote 109 I first verified that the highly stable relationship concerning which variables load onto which dimension extends back to 1815 (details are below). I then constructed each dimensional measure by aggregating the variables loading onto that dimension. The only variables from CAM's study not included in this way are the following: (1) Banks’ Competitive Nomination Process (which loaded about equally onto each dimension), (2) Banks’ legef × legsel, the product of two other Banks variables (which did not consistently load onto a dimension over time) and (3) three variables excluded from the contestation measure to construct a separate liberalism measure.
This produced a list of six variables corresponding to participation and nine to contestation. All fifteen variables correlate highly with other variables loading onto the same dimension. Each individual variable was scaled to range between 0 and 1 (1 = more democratic). For 1815–1946, the variables are limited to four for participation and five for contestation, with further variables becoming available in 1946, 1950, 1972 and 1982. As variables were added, the dimensions were re-scaled using a chaining method, whereby yearly averages were compared for the new and old measures and scaled to be comparable over time. Country-years were omitted if particular subsets of the underlying variables were not available. Finally, each dimension was scaled to lie between 0 and 1 across the entire dataset.
As discussed in the text, variables measuring very similar political features were first averaged, then this mean was added to the final aggregation. The measures of the two dimensions are detailed below, along with brief descriptions and years of availability for each variable. For the years prior to the availability of Bollen's suffrage data, Vanhanen's Participation is double-weighted. Alterations to the variables are indicated by a *.
Participation
An average of (1) Vanhanen's Participation (1815–2004) (electoral turnout as a per cent of the total population, plus adjustments for referenda), (2) Bollen's Adult Suffrage* (1950–2004) (as a per cent of the adult population), (3) CIRI's Women’s Political Rights (1982–2004) and (4) a mean of Polity's Openness of Executive Recruitment (1815–2004), Banks’ Legislative Selection* (1815–2004) and Banks’ Effective Executive Selection* (1815–2004) (ordinal indicators of the electoral selection of leaders).
Contestation
An average of (1) Vanhanen's Competition* (1815–2004) (100 minus the per cent of legislative seats received by the largest party), (2) Freedom House's Political Rights (1972–2004), (3) Cheibub, Gandhi and Vreeland's Democracy (1946–2004) (a dichotomous measure of electoral competition), (4) a mean of CIRI's Electoral Self-Determination (1982–2004) and Banks’ Party Legitimacy (1946–2003) (measures of the freedom of party competition and citizen lawmaking power), (5) a mean of Polity's Competitiveness of Participation (1815–2004) and Polity's Competitiveness of Executive Recruitment (1815–2004) and (6) a mean of Polity's Executive Constraints (1815–2004) and Banks’ Legislative Effectiveness (1815–2003) (measures of intragovernmental constraints).Footnote 110
*Alterations
For 2001–04, Bollen's Adult Suffrage is imputed from Vanhanen's Participation. Banks’ Legislative Selection is coded 1 if the legislature is elected and 0 if non-elected or non-existent. Banks’ Effective Executive Selection is coded 1 if the executive is directly or indirectly elected and 0 if non-elected. Vanhanen's Competition is first altered to reach a ceiling of 50 per cent to avoid biasing the measure toward parliamentary systems.
Principal Components Analysis
To confirm that the variables load consistently onto each dimension back to 1815, I followed CAM and performed a PCA with an oblique rotation (which allows the dimensions to be correlated) on a pooled sample of the nine variables available for 1815–2004. The loadings are consistent: the five contestation variables comprise the first dimension (with correlations between the variables and the dimension ranging from 0.66 to 0.96) and the four participation variables comprise the second (with correlations ranging from 0.53 to 0.87). The test of whether two dimensions are sufficient produces a χ2 of 25,857.38 on 19 degrees of freedom (p < 0.0001).