Introduction
Variation in the density of hair, their distribution over the body, their length, diameter, colour and shape contribute to the vast array of hair growth patterns observed in the animal kingdom. Of these, one of the most apparent is the extent of fibre curl, wave or crimp. The biological and physicochemical basis of fibre bending has been the subject of considerable speculation over many decades. Most include one or more of the following mechanisms or associations: differing ratios and composition of ortho-, meso- and para-cortical cells (Horio and Kondo, Reference Horio and Kondo1953; Fraser and Rogers, Reference Fraser and Rogers1954); rotation of the inner root sheath and fibre cuticle around the fibre cortex, thereby imparting torsion to, and shortening of, the cortical cells (Nagorcka, Reference Nagorcka1981); different spatial arrangements of the intermediate filaments within the cortical cells (Caldwell et al., Reference Caldwell, Mastronade, Woods and Bryson2005; Kajiura et al., Reference Kajiura, Watanabe, Itou, Nakamura, Iida, Inoue, Yagi, Shinohara and Amemiya2006); and differences in the expression of keratins and keratin-associated proteins in cortical cells of high- and low-fibre crimp (Plowman et al., Reference Plowman, Bryson and Jordan2000). In wool-producing sheep there is an association between the degree of follicle curvature and fibre crimp frequency (Nay and Johnson, Reference Nay and Johnson1967). Fibre crimp in these animals is also associated with a bilateral distribution of para- and ortho-cortical cells (Horio and Kondo, Reference Horio and Kondo1953; Fraser and Rogers, Reference Fraser and Rogers1954) and a high cystine and sulphur content (Campbell et al., Reference Campbell, Whiteley and Gillespie1972). However, many of the relationships between follicle and fibre characteristics and fibre crimp may simply be associative and not causative. This may account for apparent anomalies in the theoretical models. For example, highly crimped fibres that do not contain para-cortical cells have been observed (our observation unpublished; and Campbell et al., Reference Campbell, Whiteley and Gillespie1972), curled fibres have been observed growing from seemingly straight follicles, and the relationship between cystine content and crimp is reversed by nutritional changes (Campbell et al., Reference Campbell, Whiteley and Gillespie1972).
We propose that the production of fibre crimp or curl is a direct consequence of two simple causative events. The first is an asymmetry in the rate of cell production on either side of the dermal papilla of the follicle bulb (as originally proposed by Auber, Reference Auber1950) and the second is the point at which keratinisation of the fibre is complete within the follicle. To test this hypothesis we examined a series of fibre and skin biopsy samples from Merino sheep differing widely in crimp characteristics.
Material and methods
General
Twelve sites (5 cm2/site) on the midsides (six/side) of 12 medium-wool, 18-month-old Merino sheep (mean liveweight 45 ± 6.5 kg; mean fibre diameter (FD) 22.0 ± 1.8 μm) were clipped close to the skin using small animal clippers (Thrive Super 50; Daito Electric Machine Ind. Co., Ltd, 9-11 Showa-Cho, Higashiosaka, Japan) at the commencement of the experiment. The sheep were subsequently maintained in individual pens in an animal house, on a ration (1.5 kg/day) of sheep pellets (9.0 MJ metabolisable energy/kg dry matter, 110 g crude protein/kg dry matter) for 45 days. The 144 sites were again clipped using the fine clippers and the wool samples placed in labelled vials.
Immediately after wool collection, the skin underlying each wool sample was injected intradermally with 0.5 ml of local anaesthetic (2.0% Lignocaine with adrenaline; Troy Laboratories Pty, Ltd, Smithfield, NSW, Australia). A skin biopsy sample of 1.0 cm diameter was taken by cutting a circle of skin with a trephine and liberating the tissue from the underlying adipose tissue with a sharp pair of surgical scissors. The small wound was treated with an antiseptic (Cetrigen; Virbac Pty Ltd, Peakhurst, NSW, Australia), and the skin biopsy placed into 10% buffered formalin for fixation.
Wool fibre measurements
The staple crimp frequency of wool grown at each site in the 45-day period was measured by counting the number of crimps/cm, a crimp being defined as the distance from one peak to the next in the wool staple. The wool samples were subsampled using a minicore device designed to provide 2 mm snippets of wool suitable for measurement using the optical FD analyser (OFDA 100; BSC Electronics Pty Ltd, Western Australia, Australia). The OFDA machine measures the mean FD (in μm), the standard deviation of FD (±μm) and fibre curvature (FC; in deg/mm). The latter is related to staple crimp frequency and provides a more objective and accurate estimate of the fibre crimp than subjective counting. A total of 1500 fibres were measured to characterise the mean diameter, standard deviation of diameter and FC of each sample. From the 144 samples, three subsets of samples were formed on the basis of mean FD (low FD = 19.7–20.9 μm; medium FD = 21.2–23.0 μm and high FD = 23.1–25.3 μm). Within these three groups a further selection was made on the basis of mean FC from the OFDA analysis (low FC = 60–78 deg/mm and high FC = 90–106 deg/mm). This provided a total of 48 samples (8/group × 2 groups/diameter range × 3 diameter ranges).
Wool follicle measurements
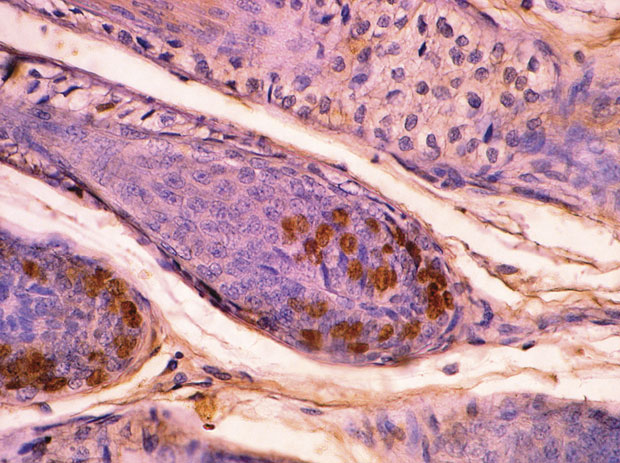
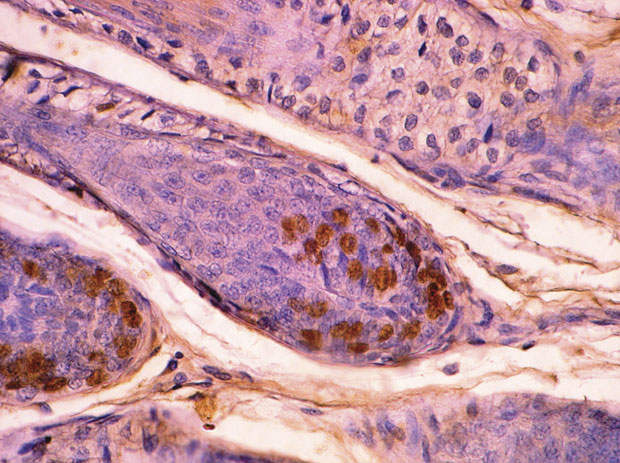
To identify those cells undergoing DNA synthesis and replication, the sheep received an intravenous injection of 5-bromo-1,2-deoxyuridine (BrDU) at a rate of 5 mg/kg bodyweight, 6 h prior to the skin biopsy being taken. BrDU-labelled cells were identified by an immunohistochemical technique (Hynd and Everett, Reference Hynd and Everett1990). Asymmetry in follicle bulb cell division was determined in longitudinally sectioned (8 μm) follicles by counting the number of BrDU-labelled cells on either side of the follicles in which the dermal papilla was deemed to have been sectioned through the midline (Figure 1). A total of 100 follicles were counted to characterise each sample. The degree of mitotic asymmetry was estimated as the ratio of the larger number of labelled cells in each bulb to the smaller number of labelled cells.
Bromodeoxyuridine-labelled cells in the wool follicle. The asymmetry of DNA labelling was quantified by expressing the larger number of DNA-labelled cells on one side of the dermal papilla to the smaller number on the other side of the papilla.
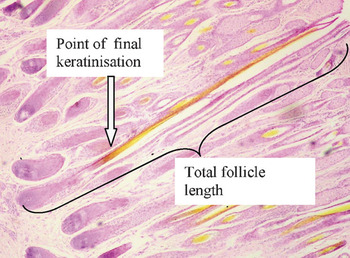
A separate series of longitudinal sections from each biopsy was stained with haematoxylin, eosin and picric acid. The length of the keratinisation zone within the follicle was measured as the distance from the base of the follicle bulb to the point at which the fibre changed from eosinophilic (pink) to picrophilic (yellow) (Figure 2). The total follicle length was measured from the basal bulb to the estimated point of emergence of the fibre from the skin surface. It was not always possible to track the entire length of the follicle to the skin surface but reasonable estimates could nevertheless be made. In the same sections, a subjective score for follicle curvature was made based on the scoring system devised by Smith (Reference Smith2002), with the following definitions: Score 1 (straight follicles with little or no curvature); Score 2 (mostly slightly curved follicles); Score 3 (moderately curved follicles); Score 4 (strongly curved follicles with bulbs parallel to the skin surface) and Score 5 (very definite follicle curvature with bulbs facing the skin surface).
Photomicrograph of wool follicles showing the point in the follicle at which final hardening of the fibre occurs as indicated by yellow staining with picric acid (stain haematoxylin, eosin and picric acid). The length of a line drawn from the basal bulb to this point and the length of a line drawn from the basal bulb to the skin surface were used to determine the proportion of ‘unkeratinised’ fibre.

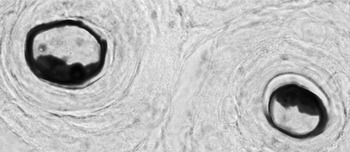
The fibre cross-sectional area occupied by para-cortical cells was estimated by drawing around the area stained for para-cortical cells, using the methylene blue method (Clarke and Maddocks, Reference Clarke and Maddocks1965) and the total fibre cross-sectional area (Figure 3). The ratio of paracortex area to total fibre area was calculated.
Fibres stained with Loeffler’s methylene blue following performic oxidation, showing the dark-staining paracortex and unstained orthocortex.

Statistics
A linear model was used (Genstat v5; VSN International, http://www.vsni.co.uk) to evaluate the effects of group (FD group and FC group) on the dependent variables (paracortex (%), extent of mitotic asymmetry, proportion of follicle length unkeratinised and follicle curvature). Animal identity was used as a fixed effect in the model. Multiple regression analysis was used to assess the relative effects of mitotic asymmetry, point of keratinisation and ortho-/para-cortical cell ratio on FC. A ‘crimping index’ was used to combine mitotic asymmetry and point of keratinisation into a single term. Crimping index was defined as mitotic asymmetry/proportion of the follicle containing unkeratinised fibre.
Results
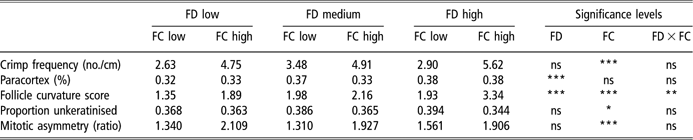
Table 1 shows the mean values for paracortex (%), extent of mitotic asymmetry, proportion of follicle length unkeratinised and follicle curvature score, for each FD and FC group.
Least-square mean values for paracortex (%), extent of mitotic asymmetry, length of unkeratinised fibre and follicle curvature score, for each fibre diameter (FD) and fibre curvature (FC) group
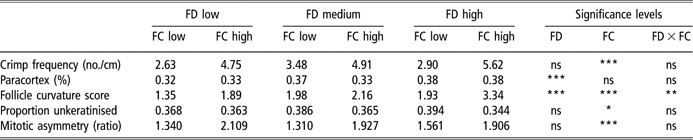
Significance levels are indicated for the effects of fibre diameter group, fibre curvature group and the interaction between fibre curvature and fibre diameter group (*P < 0.05; **P < 0.01; ***P < 0.001; ns P > 0.05).
As expected, crimp frequency differed significantly between groups selected on the basis of FC but there was neither a difference in crimp frequency between diameter selection groups nor was there any interaction between diameter and FC groups for crimp frequency (Table 1).
The proportion of the fibre cross-section occupied by paracortical cells increased with increasing FD (P < 0.0001) but there was neither significant difference in the paracortex (%) between FC groups nor any interaction between diameter and curvature group (Table 1). Somewhat unexpectedly, subjectively assessed follicle curvature score was positively associated with FD (Table 1). Follicle curvature score was positively associated with FC (P < 0.01) and there was a significant interaction between diameter group and curvature group in follicle curvature score, such that low- and high-diameter groups differed more in curvature score between high- and low-FC groups than in the medium-diameter group (Table 1). The length of the unkeratinised zone relative to total follicle length was greater for the low-curvature groups than for high-curvature groups within each FD group (P < 0.05). Mitotic asymmetry was significantly greater (P < 0.001) in the high-FC groups than in the low-curvature groups, regardless of diameter grouping (Table 1). It should be noted here that significant errors occur when estimating mitotic asymmetry in histological sections, as many sections will not bisect the plane of asymmetry. It is likely, therefore, that the degree of asymmetry reported in this paper underestimates the actual value.
Regression analysis of the relationships between variables confirmed the results shown in Table 1. A multiple regression model including terms for mitotic asymmetry, paracortex (%) and unkeratinised (%) revealed that these three variables accounted for 0.69 of the variance in FC (P < 0.0001). Mitotic asymmetry accounted for 0.64 (P < 0.0001), the unkeratinised (%) accounted for 0.05 (P < 0.041) and paracortex (%) accounted for only 0.008 (P = 0.392) of the total variance in FC.
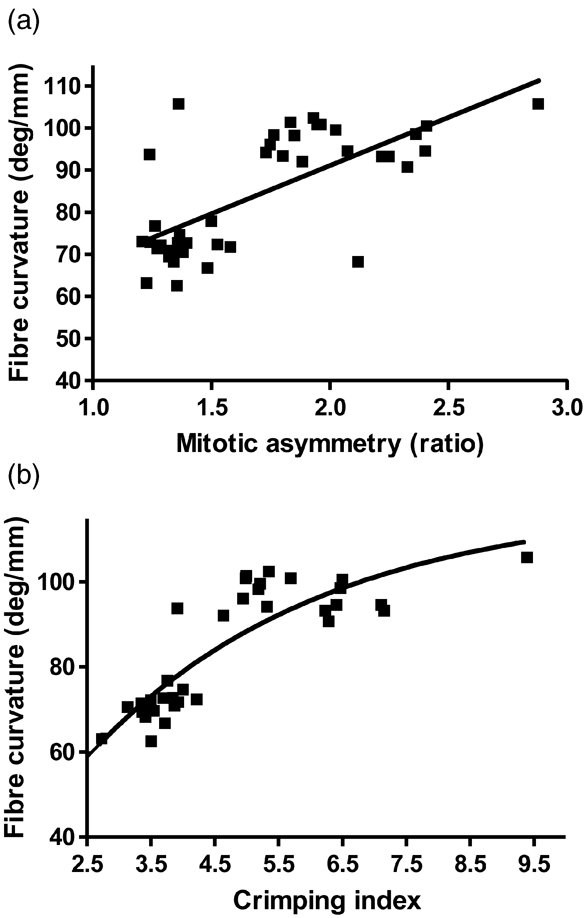
The simple linear relationship between mitotic asymmetry and FC is shown in Figure 4a. A composite ‘crimping index’ derived from asymmetry and keratinisation point accounted for a greater proportion of variance in FC (Figure 4b). Note the impact that consideration of the keratinisation level has on the ‘fit’ for individual data points.
Relationships between fibre curvature and mitotic asymmetry (a) and between fibre curvature and ‘crimping index’, a composite value comprising mitotic asymmetry and point of keratinisation of the fibre within the follicle (b).
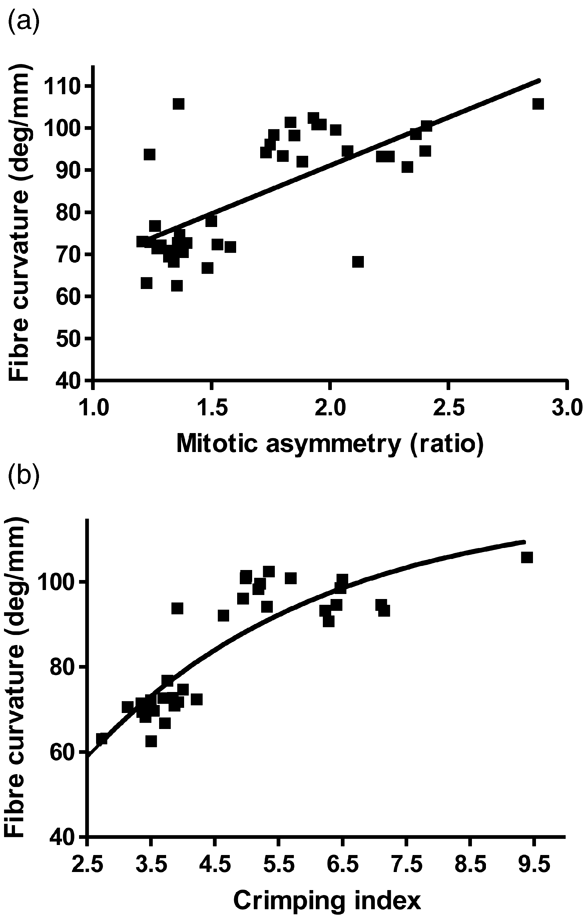
The relationships accounted for 0.48 (P < 0.001) and 0.76 (P < 0.0001) of the variance in FC.
Discussion
The observations reported here support a simple mechanistic model underpinning the formation of curl or crimp in hair fibres. We propose that there are two main events that generate bending of hair fibres. The primary event is the asymmetric production of cells on either side of the dermal papilla, a phenomenon presumably established during the establishment of the follicle in foetal development. All follicles during early foetal skin development are initially straight (unpublished observations), but those that have a genetic asymmetry in the number of cells on either side of the dermal papilla probably bend at the time of keratinisation of the first fibre. The follicle curvature, thus established, remains throughout the life of the animal, accounting, in the current experiment, for the strong relationship between mitotic asymmetry and follicle curvature score (Table 1).
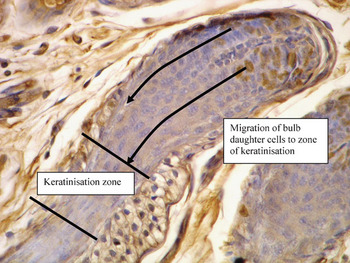
The results of the trial reported in this paper support a strong relationship between mitotic asymmetry in the follicle bulb and FC, in accordance with the early suggestion (Auber, Reference Auber1950) that asymmetry was a major driver of fibre crimp. Thibaut et al. (Reference Thibaut, Gaillard, Bouhanna, Cannell and Bernard2005) also provided evidence that cell proliferation, as indicated by Ki-67 labelling, was asymmetric in follicles, thereby producing curly human hair fibres. These authors concluded that fibre curliness is programmed in curved bulbs. Asymmetric cell division (Figure 5) means that there is a greater supply of daughter cells on one side of the follicle than the other, placing differential pressure on the fibre as it is extruded through the already-hardened inner root sheath canal. The greater rate of cell supply from the concave compared to the convex side of the bulb (Figure 5), results in torsional pressures in the lower follicle as the cells harden and are pushed against the already-hardened inner root sheath. The fibre responds to these pressures by bending or kinking. The greater the asymmetry of cell division, the greater the pressure differential and the greater the crimping response of the fibre, accounting for the strong relationship between follicle curvature score and FC reported in this paper (P < 0.01) and that of Nay and Johnson (Reference Nay and Johnson1967). This notion of mitotic asymmetry and differential hardening of the cells in the lower follicle is consistent with the theoretical mechanism for crimp, proposed by Nagorcka (Reference Nagorcka1981). He suggested that crimp is imparted in the fibre by the rotation of inner root sheath and fibre cuticle around the cortex and that this rotation imparts twisting of the intermediate filaments within the cortical cells. These cells respond by shortening, which deforms the fibre and changes the orientation of the lower follicle and the bulb. By altering the mathematical components of this system, the various forms of crimp observed in Merino wool can be replicated. The present study indicates that this sequence of events is established initially by asymmetrical cell division in the follicle bulb.
Photomicrograph of a wool follicle showing bromodeoxyuridine-labelled bulb cells stained by an immunohistochemical technique with diaminobenzidine. The predicted path of cells from both sides of the bulb to the keratinisation zone is indicated by arrows.

It appears therefore, that the major initiator of crimp formation in animal fibres is asymmetric cell division in curved follicles. However, the site of final keratinisation of the fibre might be expected to play a greater role than that reported in this paper in situations where there is a marked shift in the location of final keratinisation in the follicle. If, for example, the rate of keratinisation was markedly delayed as a consequence of insufficient keratin precursors, a paucity of cofactors for enzymes required for keratinisation or a mismatch of intermediate filament proteins with their intermediate filament-associated protein counterparts, the developing fibre would be ‘fluid’ or ‘plastic’ in nature. The differential pressures that would have been produced in the lower follicle would dissipate and the fibre would straighten. This is why disruptions to keratinisation induced by deficiencies of zinc (White et al., Reference White, Martin, Hynd and Chapman1994) or copper (Marston and Lee, Reference Marston and Lee1948), or as a result of keratin gene transgenesis (Bawden et al., Reference Bawden, Powell, Walker and Rogers1998), result in straight or ‘steely’ fibres. This also explains how curved and asymmetric follicles can still produce straight fibres.
This theory of curl formation may explain variations in fibre curl, that occur along the length of the same fibre. These are particularly evident in human pubic hairs and in scalp hairs of people of African or Caribbean descent. Similarly, wool fibres that change from highly crimped to ‘straight’, as is evident in the Felting Lustre mutant Merino (Short, Reference Short1958), probably reflect differential changes in the rate of cell production relative to the rate (and hence point) of final keratinisation. Straight regions would reflect periods throughout the hair cycle in which the rate of cell division and cell migration rate is increased, resulting in later keratinisation (presuming there is no change in the rate of keratinisation). Regions of regular fibre coiling, on the other hand, would occur if cell birth rate in the bulb was low relative to keratinisation rate, resulting in fibre hardening in the proximal follicle. Kinks, such as those observed in pubic and zigzag hairs, would result from very early keratinisation in highly curved follicles. In these follicles, fibre hardening probably occurs at the point of greatest curvature in the lower follicle, which would create such high torsional pressure that the fibre would deflect rapidly rather than undergo a smooth change in direction as is evident in wool fibres. Animals, such as the Merino sheep, which has been selected for a long hair-growth (anagen) phase, will tend to produce fibres with very regular crimp periodicity because the rate of cell migration and keratinisation remains relatively constant. Hair follicles with a short hair cycle, on the other hand, will undergo periods in which the relative rates of cell supply and keratinisation are not constant. Our model predicts that this will result in a fibre that varies in curl along its length. Indeed, the prediction would be that early- and late-anagen growth, which is characterised by slow cell division, would be highly curled because keratinisation would occur lower in the follicle, and that mid-anagen growth, characterised by rapid cell division, would be relatively straight. Indeed this is consistent with our observations of curl in Afro-Caribbean human hair.
That fibre shape is dictated by follicle shape and the relative rates of cell migration and keratinisation is also consistent with other studies. For instance, manipulation of insulin-like growth factor (IGF) signalling in hair follicles by altering IGF-binding proteins or IGF-1 expression results in either abnormal curling of fibres or suppression of hair bending (Schlake, Reference Schlake2005). Given the known mitogenic effects of IGF-1 on the hair follicle (Philpott et al., Reference Philpott, Sanders and Kealey1994) and the agonistic or antagonistic effects of the insulin-like growth factor binding proteins (IGFBPs) on IGF-1 actions, it is tempting to speculate that the IGFs have differential effects on hair bending, depending on the relative effects of the growth factors on cell division and keratinisation rates.
This theory of curl formation in hair fibres, based on asymmetrical cell division in the bulb of curved follicles, and hardening of the migrating cortical cells in the fibre, does not require differences in the type of cortical cells formed on either side of the fibre. Nor is it necessary to invoke differences in keratin and keratin-associated protein composition, although these may modulate the response. There was no significant difference in the amount or distribution pattern of para-cortical cells in wool fibres of low or high crimp curvature (Table 1). This is in contrast to many reports of a strong correlation between the ratio of para-cortical to ortho-cortical cell areas and fibre crimp, but is in keeping with other studies that show a decrease in fibre crimp as the proportion of para-cortical cells increases with increasing nutrition (Campbell et al., Reference Campbell, Whiteley and Gillespie1972). Other studies ascribing differences in fibre curl to differences in the composition (Plowman et al., Reference Plowman, Bryson and Jordan2000) or structural arrangements of intermediate filaments (Caldwell et al., Reference Caldwell, Mastronade, Woods and Bryson2005), probably reflect secondary effects of differential keratinisation, but are not directly responsible for fibre bending.