Soil is an important natural resource, fundamental to life, providing vital ecosystem services of crucial importance to rural economies. In urban areas, soil forms an essential platform for the built environment as well as key green-space resources. As such, the protection and sustainable use of both rural and urban soils is of growing international importance (e.g., CEC 2006; Dobbie et al. Reference Dobbie, Bruneau and Towers2011). Understanding the chemical quality of soil is key for a number of reasons. Soil provides the basis for agricultural production, and concerns relate to the ability of soil to provide enough essential nutrients and trace elements for healthy crop and animal growth. Soil acts also as a filter and sink for chemical pollutants in the environment and plays a key role in mediating detrimental pollution impacts on surface and groundwater quality. Soil is also the fundamental building block supporting terrestrial ecosystems. Soil chemistry is controlled by a number of factors, primarily the soil parent material (solid geology and Quaternary deposits), climate, topography and drainage, vegetation cover, land use, atmospheric deposition and anthropogenic inputs (Fergusson Reference Fergusson1990; McBride Reference McBride1994). Concentrations of potentially harmful substances (PHS) in soil can be altered and enhanced by anthropogenic inputs such as industry, agriculture, transport and urbanisation (Alloway Reference Alloway and Alloway2013). Hence, all soil types contain varying concentrations of naturally occurring chemical elements, 26 of which are essential for plant, animal and human health in small amounts, but can be harmful in excess. Additionally, elements such as arsenic (As), antimony (Sb), cadmium (Cd), lead (Pb), mercury (Hg) and tin (Sn) have limited/no known biological function and are generally toxic to most organisms (Appleton Reference Appleton1995).
In city environments, the concentrations of PHS are often elevated as a result of atmospheric and terrestrial pollution and the nature of urban ground, which is typically disturbed and in-filled and bears little relation to the soil of the surrounding rural environment (Birke & Rauch Reference Birke and Rauch2000; Mielke et al. Reference Mielke, Gonzales, Smith and Mielke2000; Fordyce et al. Reference Fordyce, Brown, Ander, Rawlins, O'Donnell, Lister, Breward and Johnson2005; Wei & Yang Reference Wei and Yang2010; Flight & Scheib Reference Flight, Scheib, Johnson, Demetriades, Locutura and Ottesen2011; Johnson et al. Reference Johnson, Demetriades, Locutura and Ottesen2011). Humans are exposed to soil via dermal contact in gardens/play areas/allotments; resuspension of soil dust into the air column and inhalation; back-track of soil into homes on shoes; hand-to-mouth contact in children; and consumption of home-grown vegetables and agricultural produce. Indeed, it is estimated that children ingest up to 100mg of soil per day (EA 2009a). For these reasons, the protection of soil quality is a prime tenet of current UK environmental legislation (HMSO 1989, 1990). Soil quality is regulated in the rural environment for the safe production of food and to minimise adverse impacts on water and ecosystem quality (MAFF 1998). Similarly, UK government targets to build 60% of new homes on brownfield sites, have focussed attention on the quality of urban land (DETR 1998). The advent of Part IIa of the Environmental Protection Act (HMSO 1990), requiring local authorities to manage polluted soil during the development process, prompted the need for urban soil quality information to aid sustainable planning and urban regeneration and to maintain healthy environments.
In recent years, the British Geological Survey (BGS) has assessed the chemical quality of soil across the city of Glasgow and the surrounding Clyde Basin in the W of Scotland, UK, as part of the Clyde Urban Super Project (CUSP). This is a multi-disciplinary project being undertaken by the BGS in collaboration with Glasgow City Council and other local authorities in the region to characterise the geo-environment of the River Clyde catchment to aid sustainable planning and development in Scotland's major conurbation (Campbell et al. Reference Campbell, Merritt, Ó Dochartaigh, Mansour, Hughes, Fordyce, Entwisle, Monaghan and Loughlin2010).
Urban and rural soil samples were collected across Glasgow and the surrounding River Clyde Basin by the national strategic geochemical survey of Great Britain, known as the Geochemical Baseline Survey of the Environment (G-BASE), which provides information on the chemical quality of the surface environment (Johnson et al. Reference Johnson, Demetriades, Locutura and Ottesen2005). Following collection, the topsoil samples were analysed to determine the total concentration of approximately 50 inorganic chemical elements. The Clyde Basin dataset represents the most detailed regional assessment of soil geochemistry for any area of Scotland. This paper presents the results of the survey for the first time, with a particular focus on As, Cd, chromium (Cr), Pb, nickel (Ni) and selenium (Se), as these PHS in soils were identified to be of potential concern for human health under UK land contamination guidance (EA 2002, 2009b; DEFRA 2014). Summary information for copper (Cu), molybdenum (Mo), Sb, vanadium (V) and zinc (Zn) is also presented, as these elements commonly form part of land-quality assessments to UK environmental industry standards (CL:AIRE 2010; Nathanail et al. Reference Nathanail, McCaffrey, Gillett, Ogden and Nathanail2015). This study aims to determine the effects of the urban/industrial/metalliferous mining legacy on soil metal–metalloid (hereafter referred to as metal) quality in the Clyde Basin in the context of the surrounding rural environment to enhance understanding of the impacts of anthropogenic pollution and potential threats to ecosystems and human health as an aid to future land management.
1. Clyde Basin study area
1.1. Location
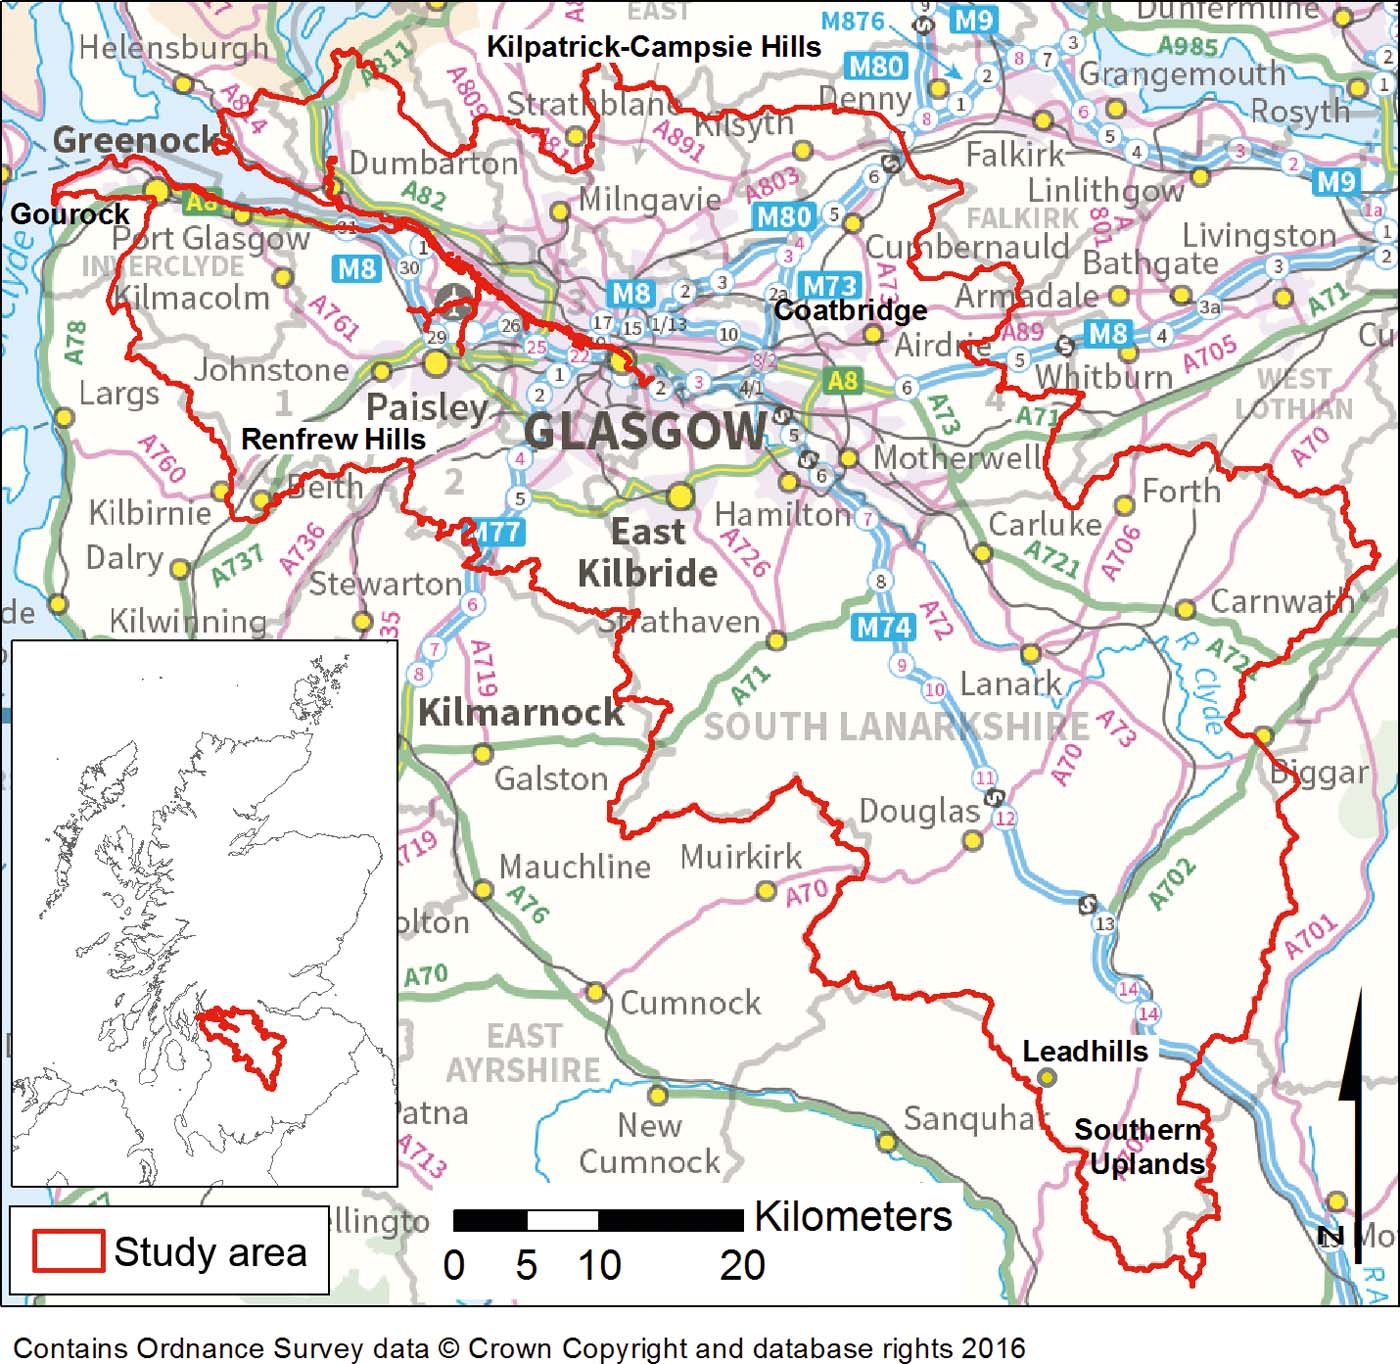
The Clyde Basin study area encompasses the entire catchment of the River Clyde, from the upper reaches in the Scottish Borders to the mouth of the estuary at Gourock (Fig. 1). The 3130km2 area contains the main Glasgow conurbation, including Hamilton, Motherwell, Airdrie, Cumbernauld, East Kilbride, Dumbarton, Port Glasgow, Greenock, Gourock, Johnstone and Paisley-Renfrew. The topography of the area ranges from the flat land of the River Clyde valley to the upland plateaux of the Kilpatrick–Campsie Hills to the N of Glasgow and the Renfrew Hills to the SW of Glasgow (Fig. 1). The S of the area is dominated by the rolling-hill-country of the Southern Uplands. The urban and built-up areas, centring on the Glasgow conurbation, are concentrated in the N of the Basin around the lower reaches of the River Clyde, whereas the S of the area is predominately rural. The upland areas of the Kilpatrick–Campsie Hills, Renfrew Hills and Southern Uplands comprise rough grazing and open moorland, whereas agricultural pasture and, to a lesser extent, arable land and forestry dominate the centre of the Basin.
Location of the Clyde Basin study area.

1.2. Geology and soil type
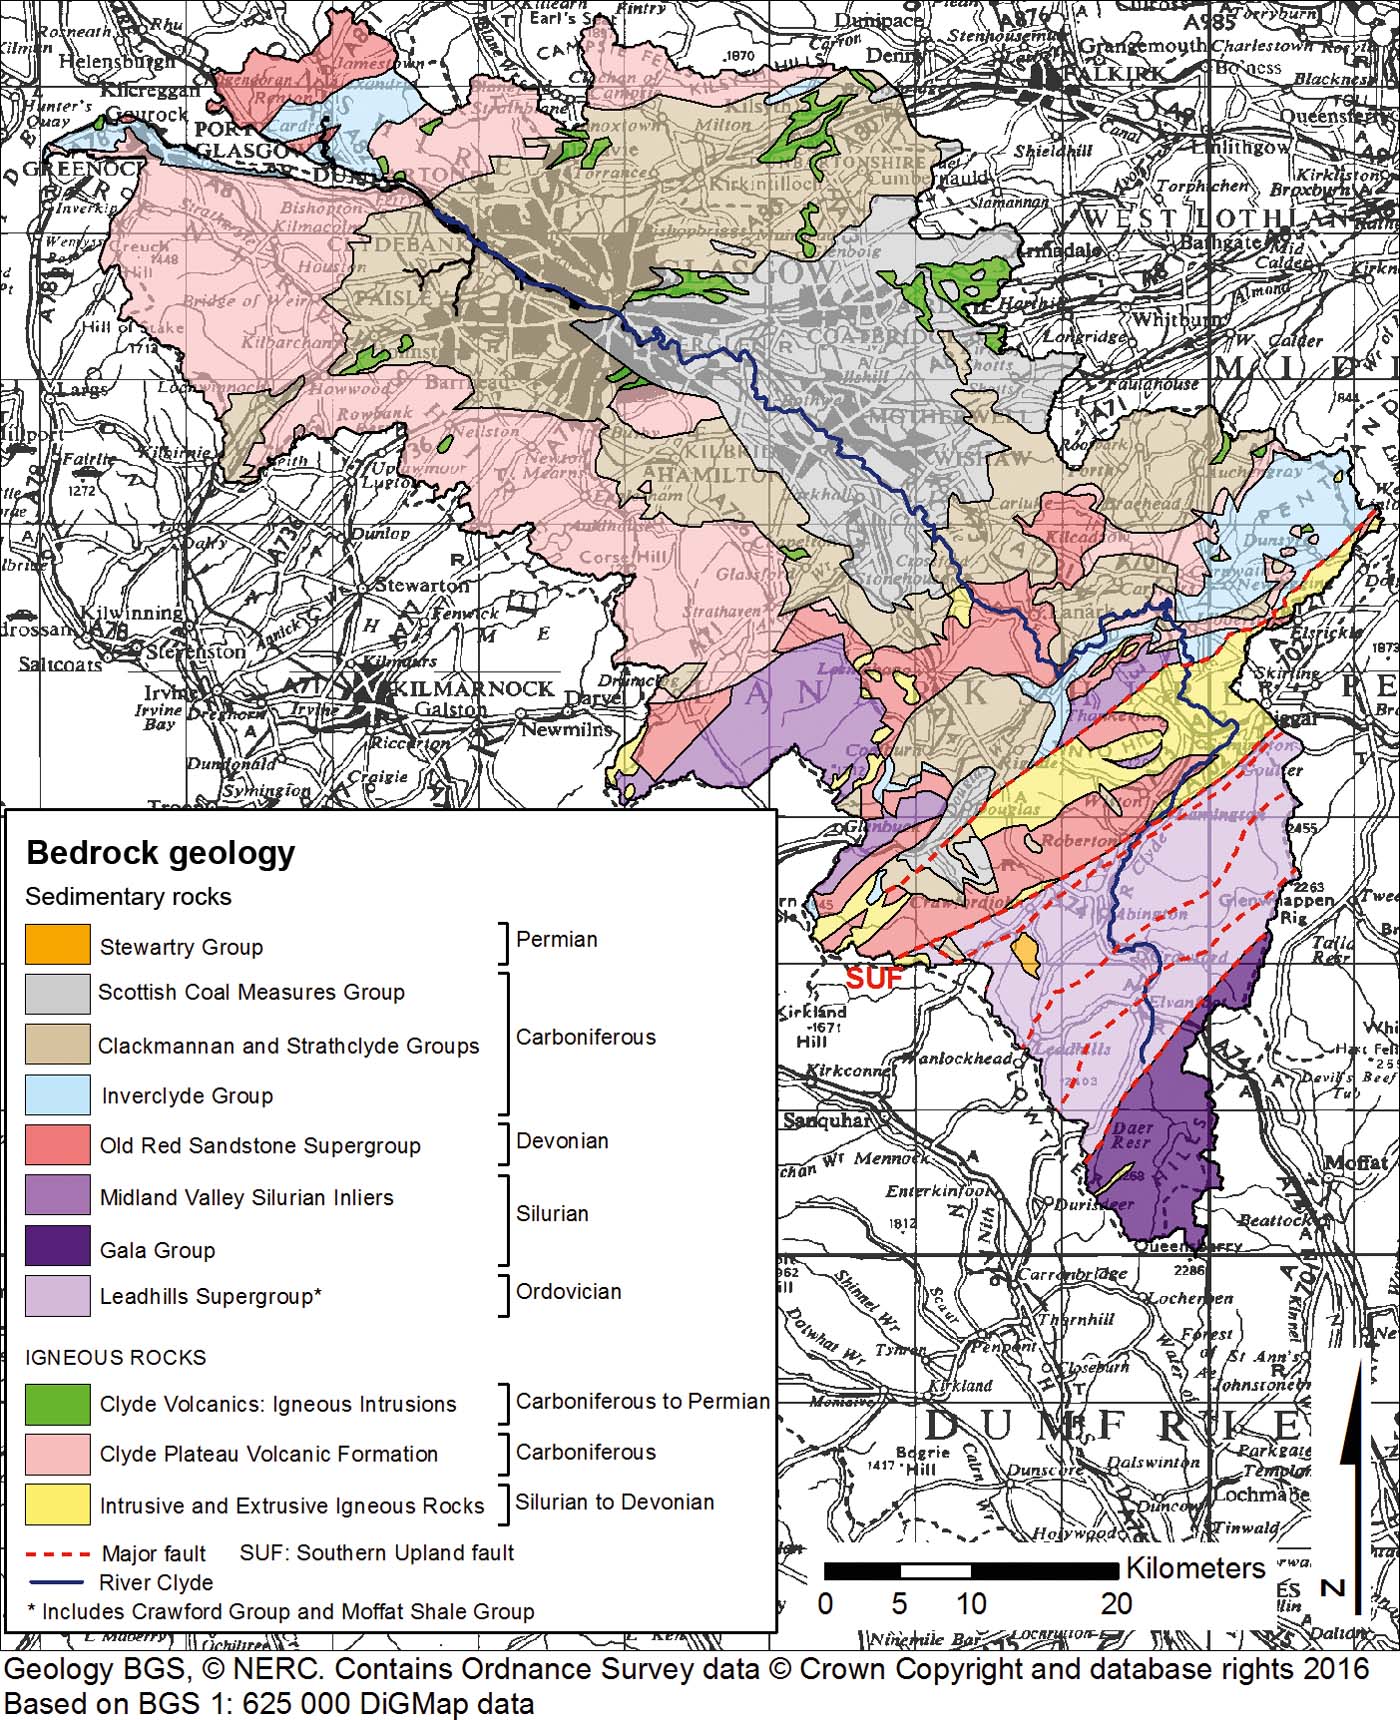
Geologically, the S of the area includes part of the Ordovician and Silurian Lower Palaeozoic belt of the Southern Uplands (Fig. 2). The Leadhills Supergroup, Gala Group and Midland Valley Silurian inliers comprise predominately greywacke sandstone with siltstone, chert, mudstone and conglomerate (Floyd Reference Floyd1995). Devonian Old Red Sandstone strata are present in the centre of the Basin and N of the River Clyde estuary around Dumbarton. Carboniferous sedimentary rocks underlie much of the N and E of the Clyde Basin. These comprise conglomerate, sandstone, siltstone, limestone, mudstone, seatearth and coal with minor oil shale. Permian breccio-conglomerate strata belonging to the Stewartry Group crop out in one small area in the SE of the Clyde Basin (Browne et al. Reference Bown, Shipley and Bibby1999; Stone et al. Reference Stone, Green and Williams2012).
Simplified bedrock geology map of the Clyde Basin study area.

In addition to these sedimentary sequences, Silurian-to-Permian-age intrusive and extrusive igneous rocks crop out in the centre and N of the Basin (Smith & Monaghan Reference Smith and Monaghan2013). The Carboniferous Clyde Plateau Volcanic Formation (CPVF) to the N and SW of Glasgow forms the Renfrew, Kilpatrick and Campsie Hills (see Fig. 1 for locations). It is composed of thick alkali olivine-basalt, felsic tuff and volcaniclastic sedimentary rocks (Cameron & Stephenson Reference Cameron and Stephenson1985).
The Quaternary deposits in the area predominately comprise glacial till and morainic material (typically deposited directly on bedrock), and cover much of the central portion of the Clyde Basin. Peat is typically found over the high ground as well as in hollows. Recent alluvium deposits occupy the present-day river courses throughout the region and, in particular, the River Clyde valley in the centre of Glasgow (Cameron & Stephenson Reference Cameron and Stephenson1985).
The Scottish Coal Measures that underlie the NE of the Clyde Basin were extensively mined both in opencast and underground pits from the 17th–20th centuries. Although much of the coal mining was in decline by the 1980s, several opencast pits are still in operation today, particularly to the S of Glasgow. Several metalliferous mineral occurrences are also present in the area. The most notable deposit is the Leadhills field (see Fig. 1 for location) comprising Pb–Zn veins held in Ordovician greywacke (BGS 1993). Between 1700 and 1958, approximately 0.4 million tonnes of metallic Pb, 10,000 tonnes of Zn and 25 tonnes of cupellated silver were produced from the Leadhills area (Mackay Reference Mackay1959).
Soil types in the Clyde Basin are predominately controlled by variations in soil parent material (bedrock and superficial geology) as well as by climate and topography. Non-calcareous gley is the dominant soil type in the area. This soil type is characterised by poor natural drainage and is developed over the extensive till deposits overlying the Carboniferous strata that occupy much of centre of the study area (Fig. 2). Low-permeability brown earth is also developed on these rock types, but is particularly associated with till over the Devonian Old Red Sandstone strata. Peaty gleyed podzol forms on the more freely draining steeper slopes of the Kilpatrick–Campsie and Renfrew Hills (see Fig. 1 for locations). Peaty gley is developed on poorly draining clayey till on moors and uplands in the area, which are also characterised by blanket peat bogs as a result of higher rainfall, cooler temperatures and greater soil wetness. Peaty gleyed podzol is the dominant soil type over the greywacke of the Southern Uplands in the S of the area. Alluvial mineral soil is restricted to the valleys of the rivers (Bown et al. 1982).
1.3. Urban history
Up until the end of the 16th Century, Glasgow was a small ecclesiastical centre on the most reliable seaward ford of the River Clyde. The development of the Glasgow conurbation was based largely on the combination of easy transport via the River Clyde and mineral extraction related to the local geology. The numerous and easily accessible coal and ironstone seams of the Scottish Coal Measures provided the fuel and raw materials to support a thriving industrial centre. By the 18th Century, coal was being exported in flat-bottomed barges, and Glasgow became the third most important port in the UK, after London and Liverpool, with imports of tobacco, cotton, coffee, rum and sugar. From 1732 onwards, the establishment of ironworks and forges, predominately in the East End of the city, increased the local demand for coal and ironstone at the expense of the export trade. Between the 18th and 20th centuries, Glasgow became a centre of heavy industry renowned for ship building centred on the River Clyde, railway engineering, iron and steel manufacture and cotton spinning. By 1800, the population of Glasgow had grown to 84,000, reflecting the gathering momentum of the industrial revolution. Across the whole Glasgow conurbation, the trend of increasing population and commercial success continued well into the 20th Century.
The conurbation sustained heavy bombing during the Second World War (1939–1945), and large tracts of the 19th-Century tenement housing were cleared between the 1950s and 1970s, as part of the city's post-war regeneration programme. Much of the inner-city population moved out to satellite new-town developments such as East Kilbride and Cumbernauld at this time (see Fig. 1 for locations). This, coupled with a decline in heavy industry over the same period, left the conurbation with a legacy of derelict land, which has subsequently been the subject of regeneration schemes that continue to the present day. Areas, such as the former Gartcosh steel works in Coatbridge and Ravenscraig in Motherwell, are being redeveloped for light industry and housing. Similarly, the metal processing heartland of the East End of Glasgow is the subject of major regeneration and was the site of the 2014 Commonwealth Games. The Glasgow conurbation today is a thriving business, retail, cultural and tourism centre with a modern mixed economy (Browne et al. Reference Browne, Forsyth and McMillan1986; Glasgow City Council 2014).
2. Methods
2.1. Soil sample collection and analysis
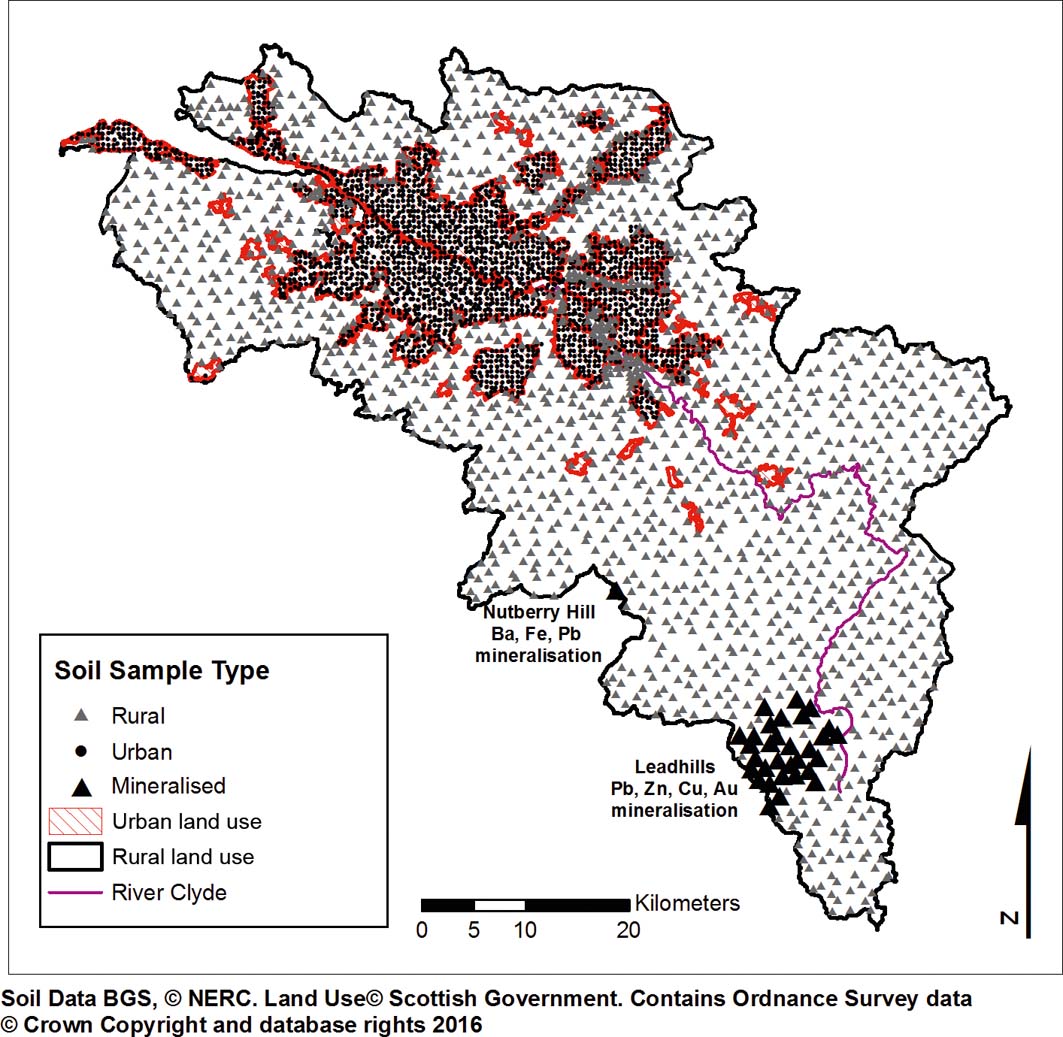
The Clyde Basin soil survey was carried out in two phases. During the first phase, soil samples were collected from the urban/peri-urban area of Glasgow city in 2001–2002. In 2010–2011, the survey was extended to include rural soil across the Clyde Basin and urban soil from the remaining cities in the study area (Fig. 3). Whilst the data are from two distinct time periods, great care was taken to standardise sampling and analytical procedures for both quality assurance and direct comparison between the survey phases. The G-BASE field procedures manual clearly defines all protocols followed (Johnson Reference Johnson2005). In summary, soil samples were collected on a systematic grid at a sample density of 1 per 2km2 in rural and 4 per km2 in urban/peri-urban areas, respectively. At each sampling location, two depth-related samples were collected by hand-held Dutch auger: topsoil (5–20cm; once the root zone on top of the soil profile was removed) and deeper soil (35–50cm). Each sample was a composite of five sub-samples collected from the centre and corner of a 20-m square. Samples were air- and oven-dried at <30°C (to avoid volatilisation of Se) and sieved to <2mm. The deeper soil samples were stored, whereas the topsoil samples were homogenised, coned and quartered and a 30-g sub-sample was ground in an agate planetary ball mill until 95% was <53μm. The pulverised material was further sub-sampled to obtain portions for analysis. The topsoil samples were analysed for total concentrations of 50 inorganic chemical elements (Table 1) by X-ray fluorescence spectrometry according to standard G-BASE procedures (Johnson et al. Reference Johnson, Demetriades, Locutura and Ottesen2005; Fordyce et al. Reference Fordyce, Nice, Lister, Ó Dochartaigh, Cooper, Allen, Ingham, Gowing, Vickers and Scheib2012, Reference Fordyce, Everett, Bearcock, Lister, Gowing, Watts and Ellen2017). Soil pH was determined by adding 10g of <2mm sample to 25ml of 0.01M CaCl2.2H2O (calcium chloride). The mixture was shaken to form a slurry prior to analysis by pH electrode. This method of pH determination generally gives lower results (0.5pH units) than water-based methods (Rowell Reference Rowell1997). Loss on ignition (LOI) was determined on 2g of <2mm material heated in a furnace and kept at 450°C for a minimum of 4h. The LOI is the percentage difference in weight before and after heating. LOI can be used as a broad indication of soil organic matter content, but can be affected by the loss of structural water in clay soil (Rowell Reference Rowell1997).
Locations of soil samples collected across the Clyde Basin from urban, rural and mineralised land-use domains.

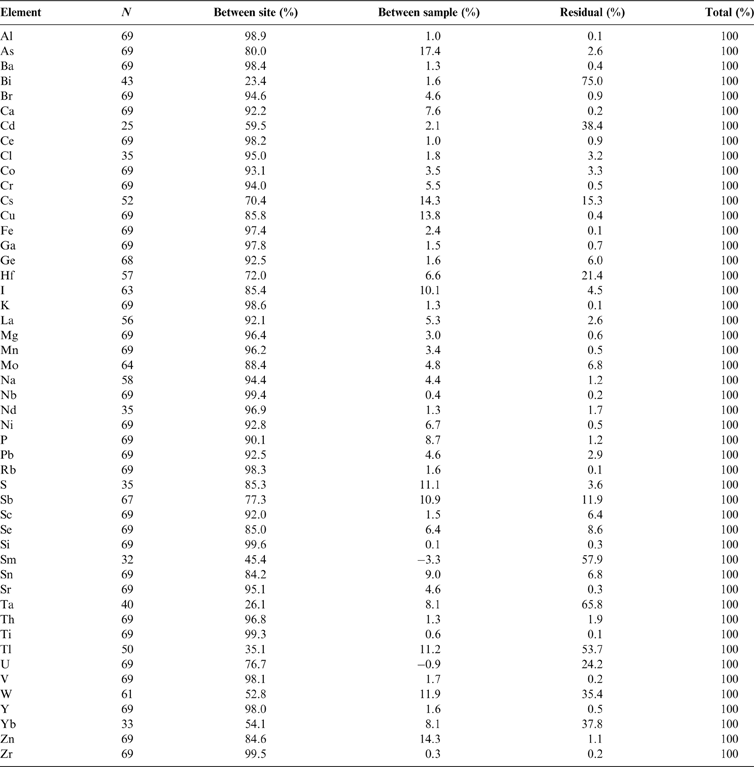
List of parameters determined in the G-BASE Clyde Basin topsoil dataset.

2.2. Data analysis and presentation
The analytical results undergo rigorous G-BASE quality assurance procedures (Johnson et al. Reference Johnson, Demetriades, Locutura and Ottesen2005). Systematic error in field sampling and analysis was monitored using a method based on randomised sample site numbers (Plant Reference Plant1973). Field-based procedures at each stage of the sampling process were designed to minimise error (Johnson Reference Johnson2005). Six percent of the samples analysed were controls comprising field duplicate, analytical replicate, and primary- and secondary-certified reference materials. Values below the lower limit of detection were assigned to a value of one-half of the detection limit, and all field duplicate sample results were removed prior to statistical treatment (Lister & Johnson Reference Lister and Johnson2005). Sampling and analytical precision were calculated using a procedure based on analysis of variance (ANOVA). Plots of cumulative frequency versus concentration for each element in the soil were examined to assess the degree to which the elements conformed to a Gaussian distribution; in most cases elements were log-transformed before undergoing ANOVA, to improve their conformity to the model distribution. A random nested model of ANOVA was used because all the analyses are part of a single randomised dataset (Snedecor & Cochran Reference Snedecor and Cochran1989). The percentage of variance attributable to between-site, between-sample and residual variance of duplicate and replicate topsoil pairs from the Clyde Basin are given in Table 2, and provide a general indication of the reliability of the geochemical data. In most cases, over 90% of the variability can be attributed to between-site variance, demonstrating the robustness of the field sampling method. ANOVA results for As, Cu, Se, Sn and Zn fall below the 90% between-site-variance level, largely as a result of the inhomogeneous nature of urban soil. Sample preparation and analytical variability (residual variance) is low (<3% for most elements), indicating the reliability of the analytical techniques. Higher values for elements such as Bismuth (Bi), Cd, caesium (Cs), hafnium (Hf), iodine (I), Mo, sulphur (S), Sb, samarium (Sm), tantalum (Ta), thallium (Tl), uranium (U), tungsten (W) and ytterbium (Yb), reflect the fact that concentrations of these elements in soil are close to the limit of detection. The spatial distributions of parameters in topsoil across the Clyde Basin were examined with the aid of interpolated surface geochemical maps plotted using the ArcGIS10.1 (ESRI®) geographic information system (GIS) software package. The interpolation was carried out using inverse distance weighting analysis based on splitting the area into 250×250m grid cells. Each grid cell (pixel) was then assigned a value, which was calculated from all the data within 1500m of the cell. These data were weighted according to the distance of the sample site from the cell (r); the weighting was proportional to r 2. Colour-classified maps were then produced, based on boundaries set at the 5, 10, 15, 25, 50, 75, 90, 95 and 99 percentiles of the data distribution for most elements, according to standard G-BASE procedures (Johnson et al. Reference Johnson, Demetriades, Locutura and Ottesen2005).
Percentage of variance in Glasgow topsoil samples attributable to between-site, between-sample and residual variance. N=number of replicate pairs. All data log-transformed.

Soil geochemical distributions are primarily controlled by three main factors (Ander et al. Reference Ander, Johnson, Cave, Palumbo-Roe, Nathanail and Lark2013):
(i) The soil parent-material type (geology) exerts a fundamental influence on soil mineralogy. This, in turn, determines the natural background concentrations of elements in soil, which can be highly variable depending on the diversity of rock types present in an area. It should be noted that many PHS occur naturally in rocks and soil, and geology is an important control on their distribution.
(ii) Another natural geological source of PHS in soil is mineralisation. Particularly in the case of potentially harmful metals, concentrations can be elevated in soil underlain by mineralised bedrock. Activities such as mining often release and disperse PHS in mineralised areas, leading to further anthropogenic enhancement of soil PHS concentrations.
(iii) Urbanisation and industrialisation release PHS to the environment. Although in recent years better environmental controls are in place, the UK has a long industrial and urban history and a legacy of pollution. Urban soil geochemistry is a combination of the natural soil composition plus the anthropogenic contribution (Johnson & Ander Reference Johnson and Ander2008):
 $$U_{\rm b} = N_{\rm b} + A_{\rm c}$$

where U b=urban geochemical baseline; N b=natural background; A c=anthropogenic contribution.
Initial assessment of the spatial distribution maps of parameters in Clyde Basin topsoil, revealed that the built-up areas and metalliferous mineralisation/mining exerted an important influence on soil geochemistry. Therefore, to examine the impact of the urban environment and metalliferous mining on soil quality, the soil dataset was categorised into rural, mineralised and urban samples, based on land-use domain polygons in GIS. The derivation of urban and mineralised land-use domains has been described by Ander et al. (Reference Ander, Johnson, Cave, Palumbo-Roe, Nathanail and Lark2013), Johnson & Demetriades (Reference Johnson, Demetriades, Johnson, Demetriades, Locutura and Ottesen2011) and McIlwaine et al. (Reference McIlwaine, Cox, Doherty, Palmer, Ofterdinger and McKinley2014). For the purposes of this study, the urban domain was determined using the Scottish Government Urban Rural Land Use Classification. This two-fold classification is based upon the National Records of Scotland settlement dataset, and defines areas of contiguous high-population density postcodes (>3000 people) as urban, and areas <3000 people as rural (Scottish Government 2015; Fig. 3). The urban dataset for the present study comprises 2333 soil samples collected from within this urban domain. The peri-urban and rural samples collected in the non-built environment are referred to collectively as the rural soil dataset, which comprises 1611 samples (Fig. 3). However, as Figure 2 shows, the urban areas of Glasgow are underlain by Devonian–Carboniferous sedimentary and volcanic rocks only, and not by the other rock types present in the Clyde Basin. To provide an indication of element rural background concentrations over these rock types, a subset of 1269 rural soil samples (hereafter referred to as ruralD-C) were selected for comparisons between element concentrations in the urban versus the rural environment to indicate the anthropogenic impacts on soil quality.
Similarly, the rural environment of the Clyde Basin contains non-ferrous metalliferous mineralised areas that raise soil metal concentrations above the typical geogenic background. Therefore, in the GIS, the rural soil samples were sub-divided further into mineralised and non-mineralised soil with reference to the Arcview British Mineralisation and Mining database (BGS 2013), which outlines the extent of mineralised areas as a polygon layer. The Pb–Zn–Cu–gold former mining district of Leadhills and one sample only from the barium (Ba)–iron (Fe)–Pb mineralised Nutberry Hill areas were associated with higher concentrations in soil for As, Cd, Cu, Pb and Sb. Elevated results for these elements (>90th percentile) within these areas were removed from the rural soil dataset and placed in a mineralised land-use dataset (Fig. 3). A subset of the remaining non-mineralised rural soil data over the surrounding bedrock of the Leadhills Supergroup was selected to provide the background geochemical signature against which the impacts of mineralisation and mining could be assessed.
Exploratory data analysis revealed that for most parameters (with the exception of pH and Fe) the data were positively skewed (skewness coefficient >1). Therefore, the data were log-transformed to better conform with a normal distribution prior to statistical analysis. Statistical analyses were deployed taking the 5% significance level (P<0.05) to assess (i) relationships between parameters in topsoil (Pearson linear correlation coefficients); (ii) significant difference between the mean concentrations of parameters in ruralD-C and urban soil samples (two-tailed un-paired t-tests); and (iii) significant difference between mean soil element concentrations over 11 different land-use types using one-way ANOVA and post-hoc Tukey Honestly Significant Difference (HSD) tests. For the t-tests, ANOVA and Tukey HSD tests the null hypothesis (H0) by assuming that the means are equal (Stockburger Reference Stockburger2001). In addition, box and whisker plots of the untransformed data were prepared to assess parameter distributions in urban versus ruralD-C soil samples and over different land-use types. These analyses were carried out using the Statview® software package, with the exception of ANOVA/Tukey tests, which were undertaken in Minitab®.
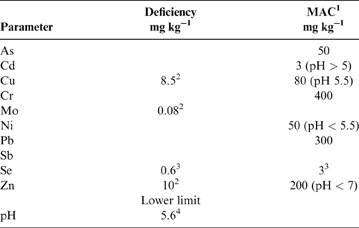
Soil quality assessments are made with reference to recommended thresholds for both agricultural and land contamination. For agricultural soil, potential risks of trace element deficiencies for crop/grass growth are assessed relative to recommended ‘no deficiency expected' thresholds (Table 3). However, it should be noted that the Cu, Mo and Zn thresholds provided by Edwards et al. (Reference Edwards, Coull, Sinclair, Walker and Watson2012) for Scottish soil refer to extractable element concentrations; whereas, in the current study, total element concentrations were determined and, hence, are likely to approximate to deficiency risk only. In terms of land contamination, under UK environmental legislation, the Contaminated Land Exposure Assessment (CLEA) model was established to assess potential threats to human health from soil exposure, based on a minimal level of risk (EA 2002). The CLEA method uses toxicological data from international studies and likely soil exposure routes and duration to derive a series of generic soil guideline values (SGVs) for various land-use types as a first-pass assessment of land quality for the elements As, Cd, Cr, Ni, Pb and Se. If parameter concentrations are below the SGV, the land is not considered contaminated. The generic SGVs were subsequently updated based on further international evidence, although revised SGVs for Cr and Pb were not defined (EA 2009b). More recently, a suite of generic human health risk Soil Screening Levels (SSLs) for As, Cd, CrVI and Pb have been derived for England to provide a more pragmatic approach to the identification of land that is not contaminated (DEFRA 2014). These are based on a low rather than minimal level of risk and, as such, are generally higher than the CLEA SGVs. However, the SSLs have not been adopted in Scotland, and for the present study reference is made to the CLEA SGVs (EA 2002, 2009b) and to current industry human health risk recommended thresholds that are typically considered as part of UK land quality assessments (CL:AIRE 2010; Nathanail et al. Reference Nathanail, McCaffrey, Gillett, Ogden and Nathanail2015). The exception is Pb, whereby the DEFRA (2014) SSL is lower than the EA (2002) SGV; hence, the SSL is included for comparison in this study. However, it should be noted that it is not possible to determine whether land is contaminated on the basis of the Clyde Basin soil dataset, as that requires detailed site-specific investigation to define any source–pathway–receptor linkages for particular land-use types (EA 2009a). Therefore, for the purposes of this study, comparisons are made with the SGVs/SSLs as a general indication of soil quality between rural and urban environments only. As such, the Clyde Basin soil is compared to the most precautionary SGVs, which are typically for residential and allotment land uses where human soil exposure is greatest, as opposed to open space and commercial land uses (Table 4).
Recommended parameter thresholds for agricultural soil. Abbreviations: Deficiency = no deficiency expected threshold; MAC = maximum admissible concentration.

1 MAFF (1998): UK agricultural soil MAC.
2 Edwards et al. (Reference Edwards, Coull, Sinclair, Walker and Watson2012): thresholds for Scottish soil.
3 Fordyce (Reference Fordyce and Selinus2013): generic soil thresholds.
4 Sinclair et al. (Reference Sinclair, Crooks and Coull2014): recommendations for Scottish soil.
Percentage of Clyde Basin rural and urban topsoils exceeding most precautionary UK soil guideline values and recommended industry standards.

1 EA (2009b): revised UK CLEA generic soil guideline values. As=residential with plant uptake; Cd, Se=allotment land-use types.
2 Nathanail et al. (Reference Nathanail, McCaffrey, Gillett, Ogden and Nathanail2015): environment-industry-suggested suitable-for-use levels for allotment land-use types.
3 EA (2002): UK CLEA generic soil guideline values for allotment/residential with plant uptake land-use type.
4 CL:AIRE (2010): environment-industry-suggested Generic Assessment Criteria for residential without plant uptake land-use types.
5 DEFRA (2014): Category 4 Soil Screening Levels for residential with plant uptake and allotment land-use types.
3. Results and discussion
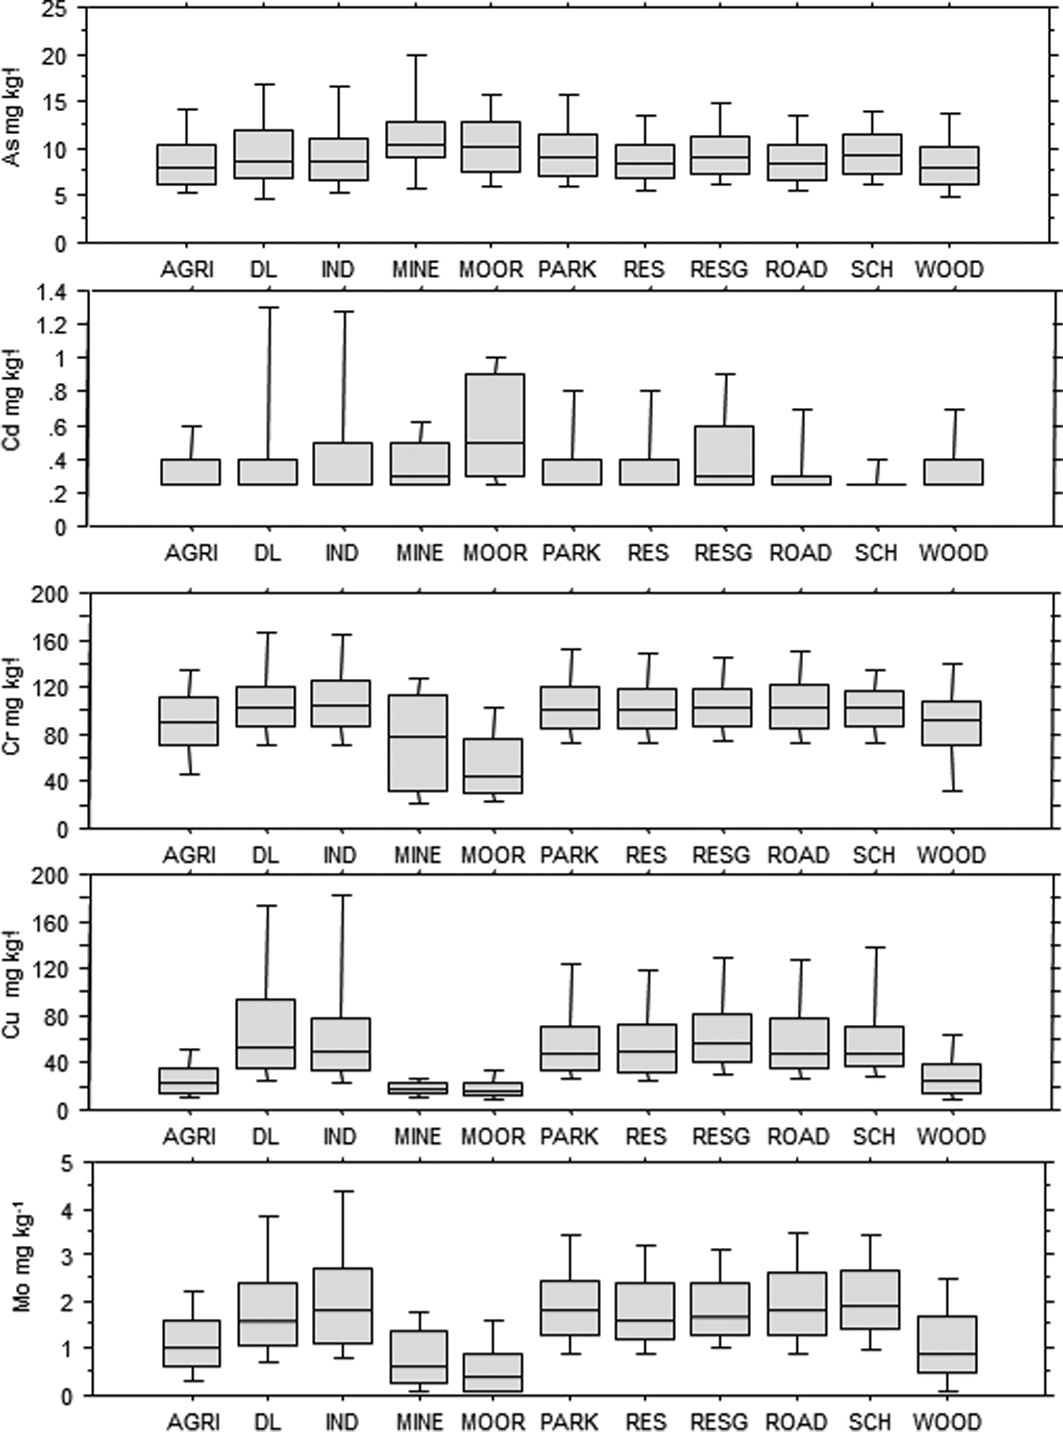
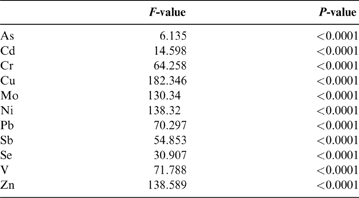
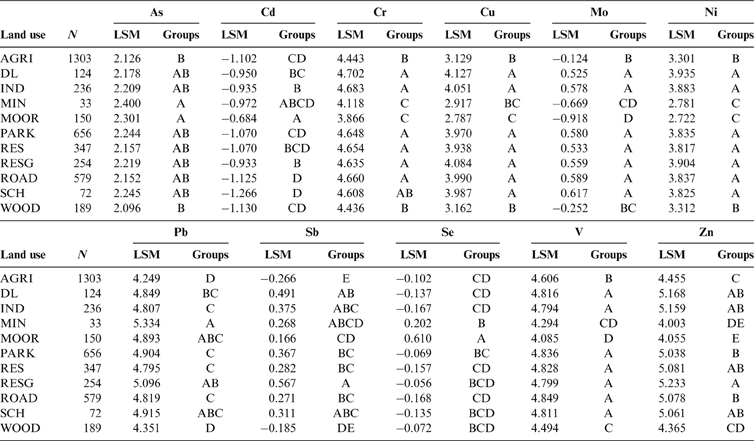
The main controls on the distribution, source apportionment and impacts on soil quality of a selection of elements of concern under current UK environmental legislation (As, Cd, Cr, Ni, Pb and Se) in the Clyde Basin are discussed here. Soil organic matter content (LOI) and pH have a significant influence on soil metal chemistry, and their distributions across the Clyde Basin are shown in Figures 4–6. Fe and manganese (Mn) oxides also commonly exert a control on the distribution of other trace metals in soil (McBride Reference McBride1994); hence, their concentration ranges in urban and rural Clyde Basin topsoil are included in Table 5. The PHS Cu, Mo, Sb, V and Zn are not considered a threat to human health under current UK land contamination guidance (EA 2009a; DEFRA 2014) but often form part of land quality assessments to environmental industry standards (Nathanail et al. Reference Nathanail, McCaffrey, Gillett, Ogden and Nathanail2015; CL:AIRE 2010). Therefore, their concentration ranges in Clyde Basin soil are summarised in Table 5. These elements, and Fe and Mn, are included in the Pearson linear correlation matrix of soil parameters in Table 6. The subset of ruralD-C soil underlain by Devonian–Carboniferous rocks that was used as the rural background concentration for comparisons with the urban dataset is outlined in Table 5. Similarly, the sub-division of the rural soil into mineralised and non-mineralised land-use classes for the Leadhills area is summarised in Table 7. To examine the impacts of anthropogenic inputs on soil quality further, relationships between selected soil metal concentrations and 11 different land-use types across the Clyde Basin were assessed. For the purposes of comparison, land use was categorised into moorland, agriculture, woodland (including nature areas/reserves), mining, road/railway verges, residential gardens/allotments, residential open space, schools, derelict land, industry (including commercial properties) and parks (including sport and recreational grounds such as golf courses and playing fields, and tended public green spaces such as cemeteries, hospitals and colleges). One-way ANOVA (Table 8) and box and whisker plots (Fig. 7) of soil-parameter distributions showed that land use accounted for significant variation in As, Cd, Cr, Cu, Mo, Ni, Pb, Sb, Se, V and Zn concentrations in Clyde Basin topsoil (P<0.0001). On this basis, the relationships between soil metal concentration and land use were assessed using Post-hoc Tukey HSD tests, whereby land uses with no significant difference between mean soil metal concentration (H0 accepted; P<0.05) were grouped together (Table 9). The results for each parameter are discussed in the following sections of this paper.
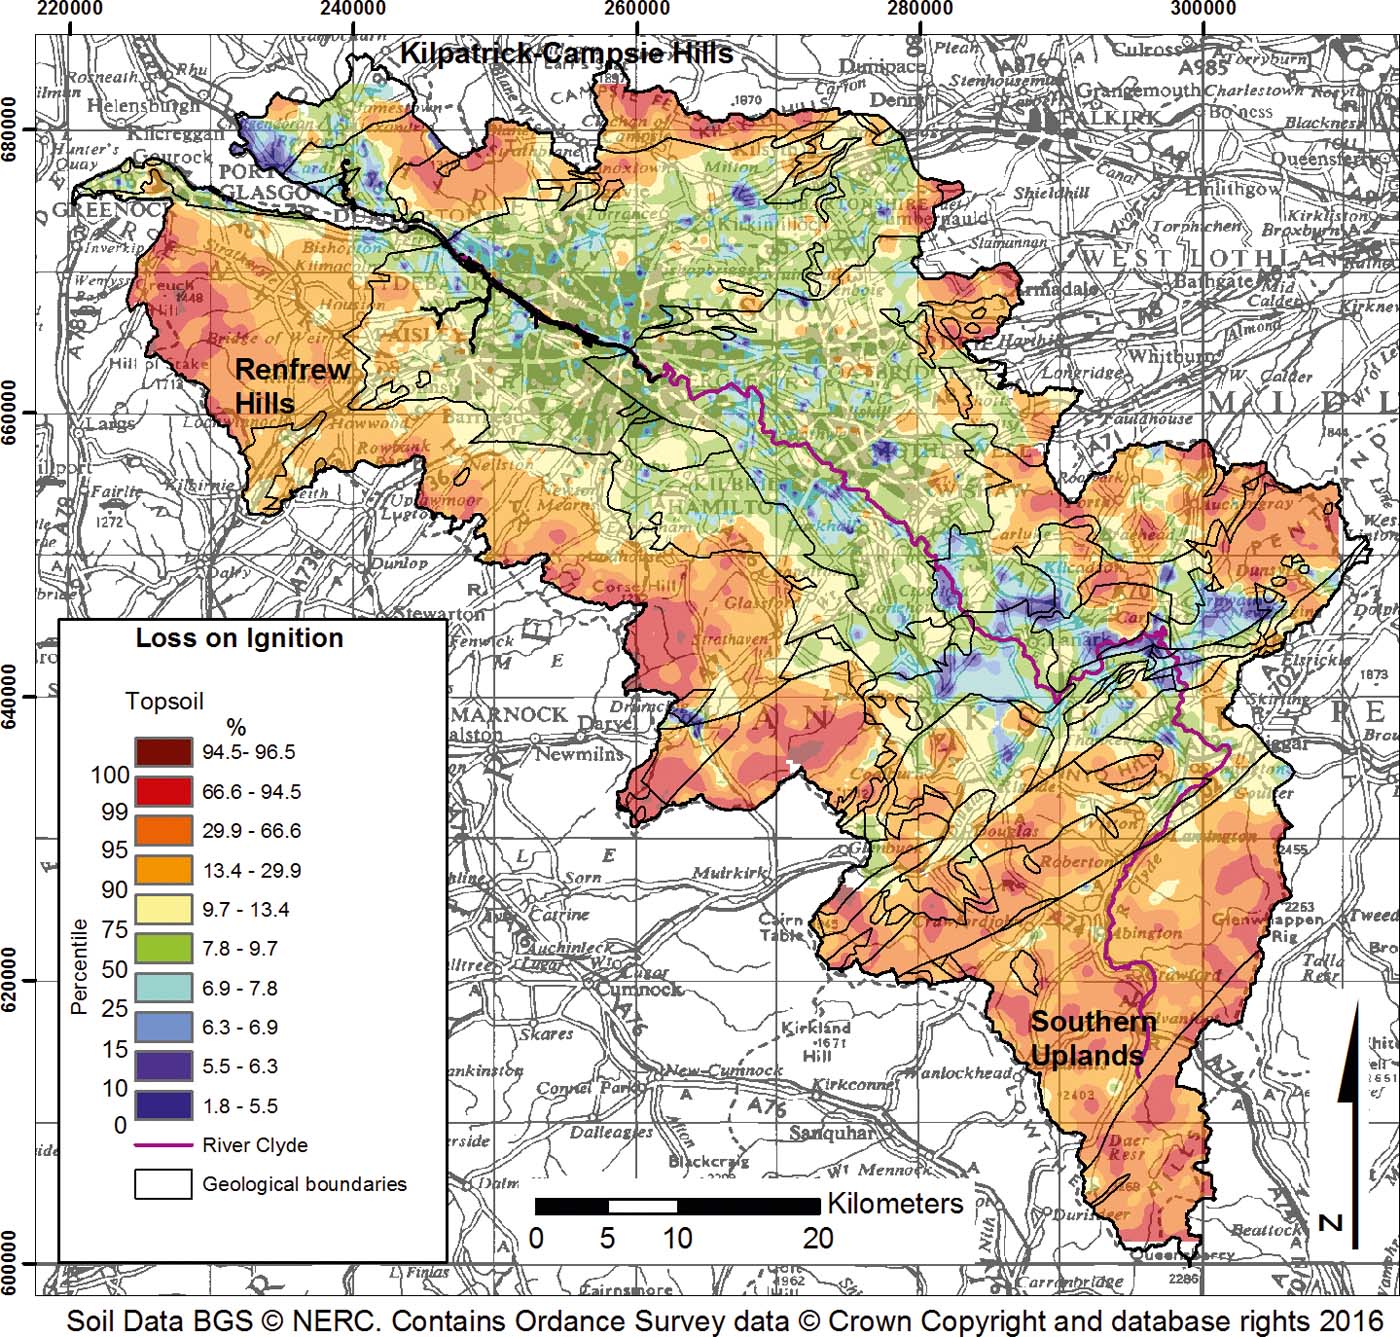
Map of loss on ignition in topsoil of the Clyde Basin.

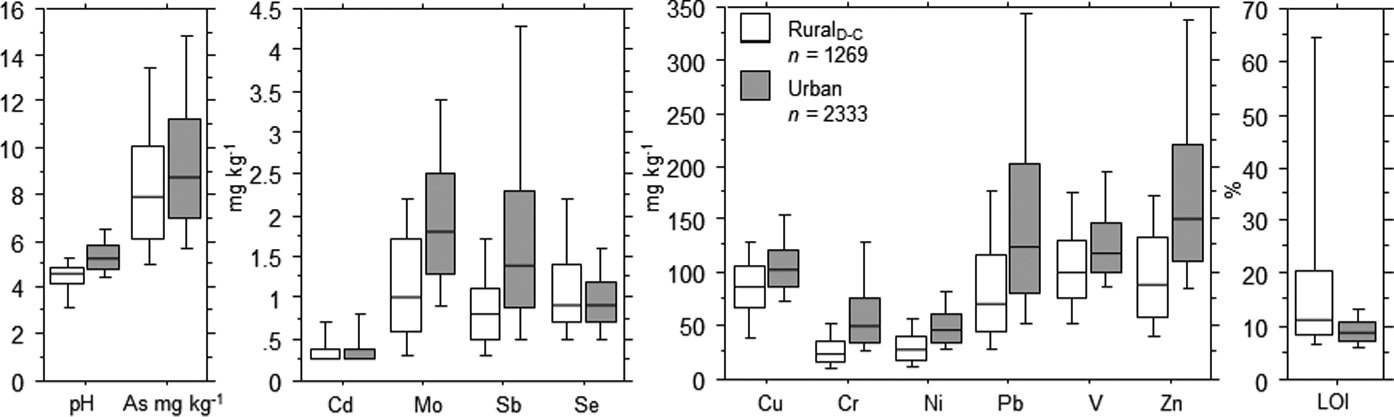
Box and whisker plots showing the 10th, 25th 50th 75th and 90th percentiles of parameter distributions in rural topsoil collected over Devonian–Carboniferous rock types and urban Clyde Basin topsoil. RuralD–C = samples over Devonian and Carboniferous rock types as rural background.

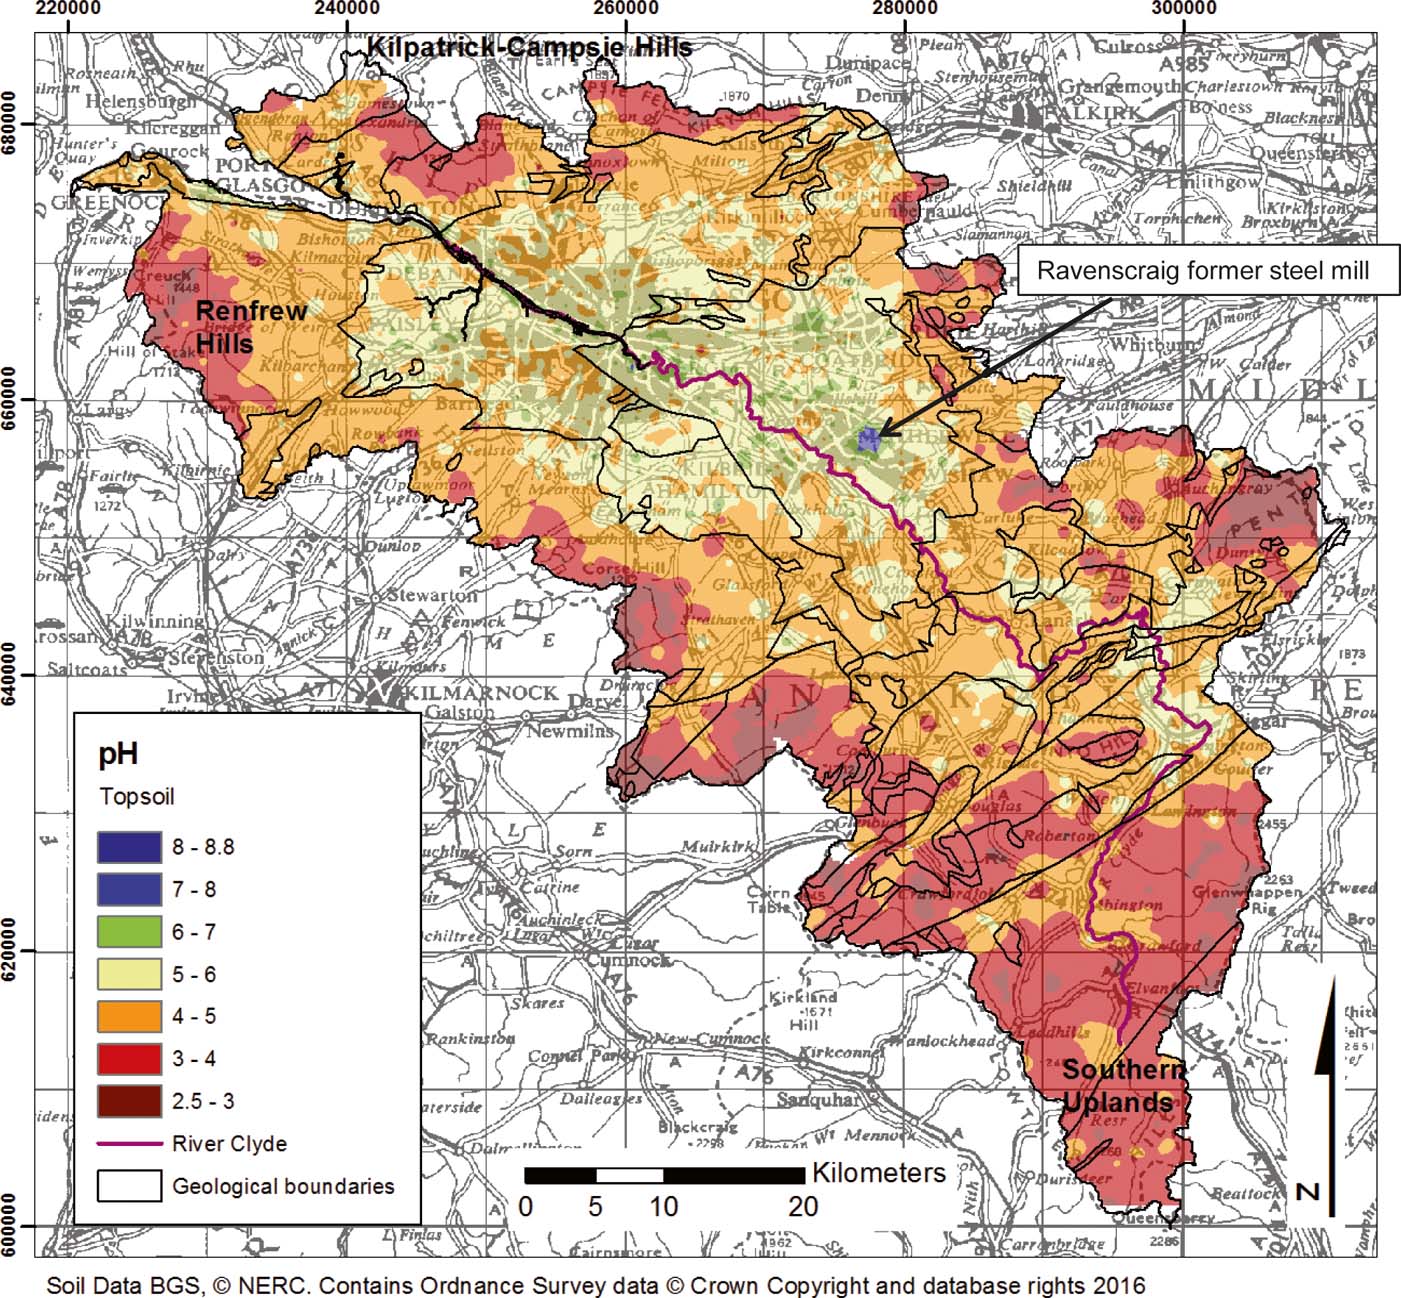
Map of topsoil pH across the Clyde Basin.

Box and whisker plots showing the 10th, 25th 50th 75th and 90th percentiles of parameter distributions in topsoil over various land-use types. Abbreviations: AGRI = agriculture; DL = derelict land; IND = industry; MIN = Mining; MOOR = moorland; PARK = recreational; RES = residential open space; RESG = garden/allotment; ROAD = road/rail; SCH = school; WOOD = woodland.

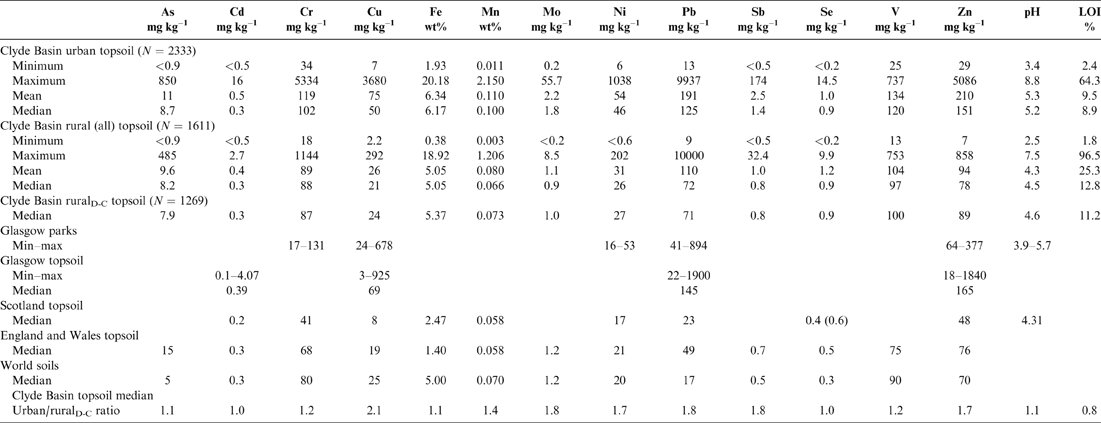
Summary statistics for selected parameter concentrations in Clyde Basin topsoil and soil elsewhere. Abbreviations: LOI=loss on ignition; RuralD-C=rural topsoil collected over Devonian and Carboniferous rock types as rural background to urban soils; N = number of samples; Glasgow parks=27 samples from Glasgow Green and Alexandria Park (Madrid et al. Reference Madrid, Diaz-Barrientos, Ruiz-Cortes, Reinoso, Biasioli, Davidson, Duarte, Grcman, Hossack, Hursthouse, Kralj, Ljung, Otabbong, Rodrigues, Urquhart and Ajmone-Marsan2006); Glasgow topsoil=397 0–5-cm-depth samples on 800m grid across Glasgow (Gibson & Farmer Reference Gibson and Farmer1983); Scotland topsoil=Paterson et al. (Reference Paterson, Towers, Bacon and Jones2003) and Paterson (Reference Plant2011), except Se=Fordyce et al. (2010) (114 samples from 44 farms) and Shand et al. (Reference Shand, Balsam, Hillier, Hudson, Newman, Arthur and Nicol.2010) (47 samples); England and Wales topsoil=Rawlins et al. (Reference Rawlins, McGrath, Scheib, Cave, Lister, Ingham, Gowing and Carter2012); world soils=Reimann & Caritat (Reference Reimann and Caritat1998). Note: pH value normalised by −0.5 units to take into account difference between water and CaCl2 slurry methods of analysis (Rowell Reference Rowell1997).

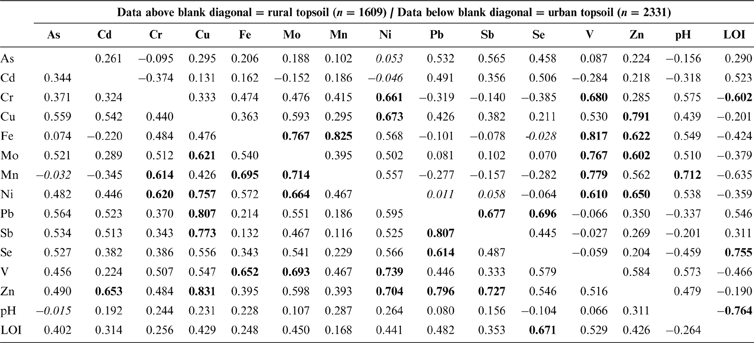
Pearson correlation matrix of selected elements in Clyde Basin rural and urban topsoil. Abbreviation: LOI=loss on ignition. Italic text=not statistically significant (r=0.062; P<0.05); bold text=strong (r>0.600) correlation (Stockburger Reference Stockburger2001). All data except Fe and pH log-transformed.

Comparison of mineralised and non-mineralised soil domains. Mineralised=one soil from Nutberry Hill for As; all other soils from Leadhills (Fig. 3); Non-min rural LHS=subset of non-mineralised soils over the Leadhills Super Group rock unit as rural background to the mineralised soils.

ANOVA comparison of selected topsoil element mean concentrations over 11 different land-use types. All data log-transformed prior to analysis. Null hypothesis H0 rejected at significance level P<0.05.

Post-hoc Tukey HSD comparison of selected topsoil element mean concentrations over 11 different land-use types. Abbreviations: LSM = least squares mean; AGRI = agriculture; DL = derelict land; IND = industry; MIN = Mining; MOOR = moorland; PARK = recreational; RES = residential open space; RESG = garden/allotment; ROAD = road/rail; SCH = school; WOOD = woodland. All data log-transformed prior to analysis. Groups = groups of factor levels. For each element, land-use LSMs that do not share the same letter are significantly different (P<0.05).
3.1. Loss on ignition (LOI)
The map of LOI distribution as a general indication of soil organic matter content shows that organic-rich soil is associated with the upland areas on the periphery of the Clyde Basin over the Southern Uplands, Renfrew Hills and Kilpatrick–Campsie Hills, as well as moorlands in the E of the Basin, as expected (Fig. 4). The greywacke rock types, underlying much of the Southern Uplands and volcanic rocks of the Renfrew and Kilpatrick–Campsie Hills, are harder and more resistant to erosion than other rock types in the region, forming high ground subject to greater rainfall and cooler temperatures. This favours the development of organic-rich and peaty soil in these areas (Bown et al. 1982). By contrast, sandier alluvial soil in the River Clyde valley has lower organic matter content. On the basis of urban/ruralD-C median ratio values, LOI is only marginally lower in urban topsoil than in rural topsoil (Table 5). However, box and whisker plots of the LOI distribution in ruralD-C and urban soils (Fig. 5) and unpaired t-tests reveal that LOI is statistically significantly higher (P<0.0001) in rural soil as a result of the greater spatial extent of peaty soil in the rural environment.
3.2. Topsoil pH
Topsoil pH values across the Basin are generally acidic (<pH≤7) and the lowest pH values (pH≤4) are controlled by the distribution of organic-rich/peaty soil in the upland areas on the periphery of the Basin (Fig. 6). These are typical values for peat soil types due to the increased presence of humic acids (McBride Reference McBride1994), and are similar to results reported for Scottish topsoil (Paterson Reference Paterson2011; Table 5). Topsoil developed over the Clackmannan, Strathclyde and Scottish Coal Measure Group strata in the N of the area has marginally higher pH values (5–6), which may reflect the influence of calcareous sandstone and limestone parent materials. In terms of farming production, the results of this study indicate that 96% of the agricultural soil sampled in the Clyde Basin is below the pH of 5.6 that is recommended for grassland soil (Sinclair et al. Reference Sinclair, Crooks and Coull2014; Table 3). These soil types may require interventions such as liming to optimise pasture production – the predominant land use in this region.
On the basis of median ratio values, topsoil pH is marginally elevated 1.1 times in urban relative to ruralD-C soil (Table 5). However, as Figures 5 and 6 show, pH values in the urban areas are generally between 5 and 7, and are statistically significantly higher than in ruralD-C soil on the basis of unpaired t-tests (P<0.0001). The former Ravenscraig Steelworks in Motherwell is characterised by topsoil pH values >7; in addition to the presence of building rubble at this cleared site, these values almost certainly reflect the use of lime in the steel-making process, resulting in calcareous furnace slag noted in soil at this location, which was the largest steel mill in Western Europe until it closed in 1992. Higher soil pH values in urban areas relative to rural soil are indicative of the presence of building rubble, slag and made-ground materials in city soil, which are generally calcareous in nature. Similar relationships have been noted previously in Glasgow and other cities and are a typical characteristic of many urban environments (Fordyce et al. Reference Fordyce, Brown, Ander, Rawlins, O'Donnell, Lister, Breward and Johnson2005, Reference Fordyce, Nice, Lister, Ó Dochartaigh, Cooper, Allen, Ingham, Gowing, Vickers and Scheib2012; Birke et al. Reference Birke, Rauch, Stummeyer, Johnson, Demetriades, Locutura and Ottesen2011).
3.3. Topsoil arsenic (As)
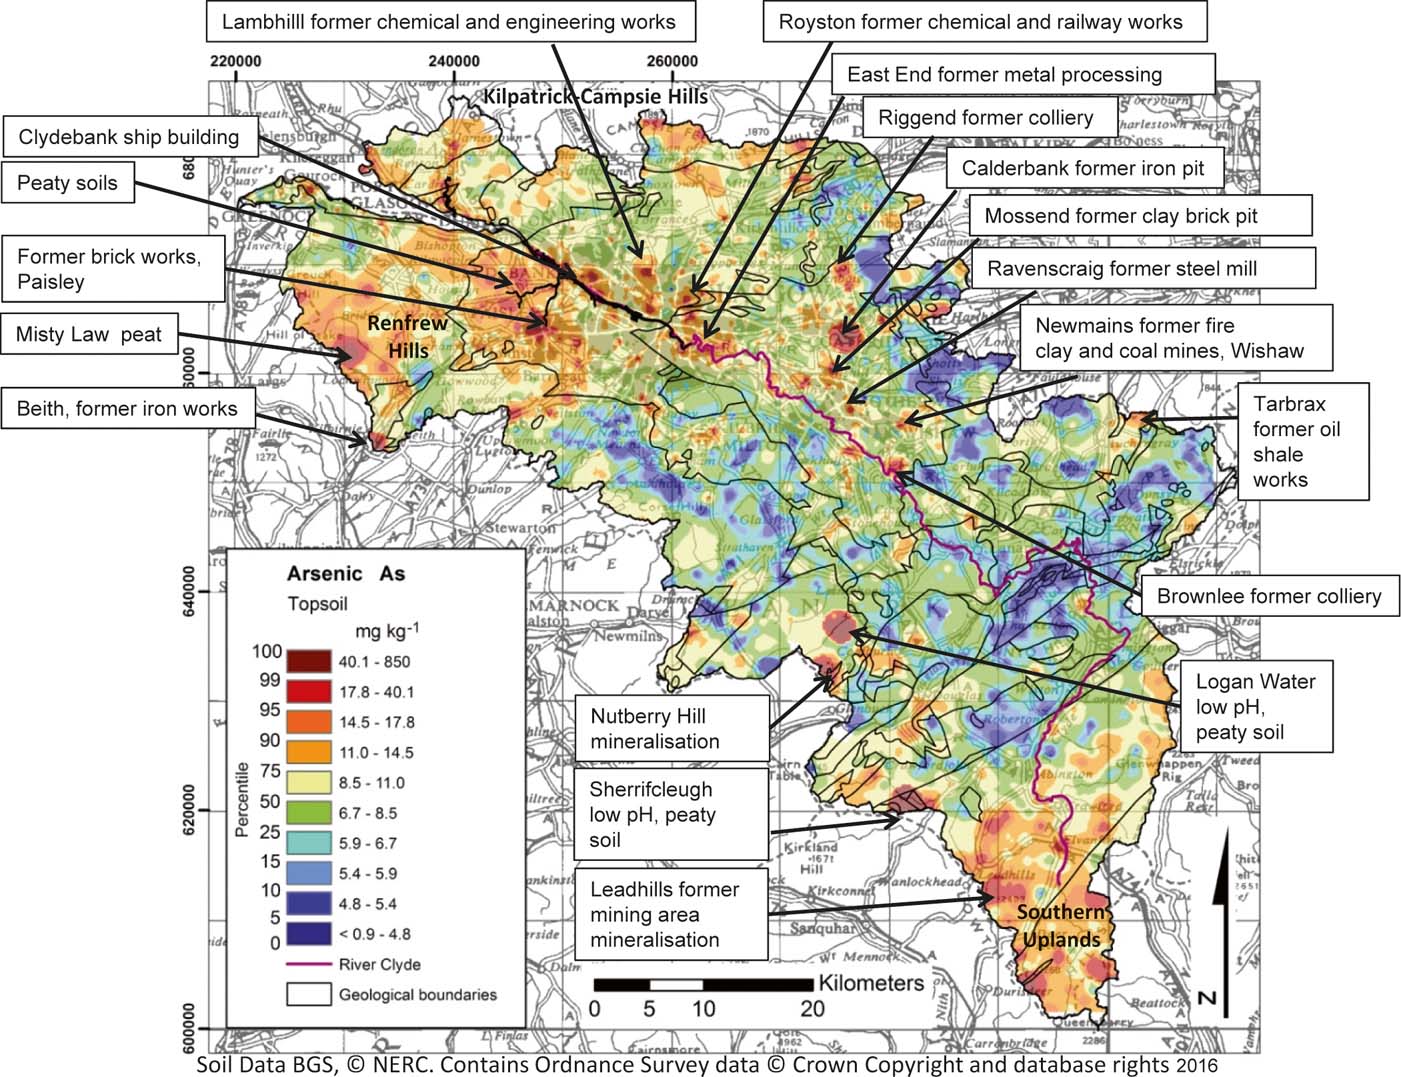
Concentrations of As in topsoil range from <0.9 to 850mgkg–1 across the Clyde Basin. In the rural environment, higher As concentrations are associated with peaty and upland organic-rich soil in the Southern Uplands S of Leadhills, in the Renfrew Hills around Misty Law and in the Campsie and Kilpatrick Hills to the N of Glasgow (see Fig. 8 for locations). This may reflect greater atmospheric deposition of As in these higher rainfall upland areas and trapping of As in these soil types as the element is readily sorbed to organic matter (Wenzell Reference Wenzell and Alloway2013). Concentrations of As in the rural environment may be enhanced further by the presence of sulphide mineralisation in the Southern Uplands around Leadhillls, and in the Nutberry Hill area (Ba–Fe–Pb), where comparisons of soil underlain by mineralised and non-mineralised areas over the Leadhills Supergroup rock types suggest 3.2 times enrichment based on median values (Table 7). Indeed, post-hoc Tukey HSD tests reveal that As concentrations are significantly higher in mining and moorland soils than in agricultural and woodland soils (Table 9; Fig. 7). The As anomaly at Logan Water may relate to the nearby mineralisation at Nutberry Hill and, similarly, the higher values at Misty Law may be influenced by mineralisation in the area (Ba–Cu). However, these environments and those at Sherrifcleugh are characterised by peaty low-pH soil and the higher As values correspond to Fe- and Mn-rich soil (Fordyce et al. Reference Fordyce, Everett, Bearcock, Lister, Gowing, Watts and Ellen2017). This suggests the influence of secondary processes and the mobilisation and then trapping of As in Fe and Mn oxides (Wenzell Reference Wenzell and Alloway2013).
Map of total As concentrations in Clyde Basin topsoil.

Whilst As may be essential for some organisms, it is generally considered toxic to most species including humans (WHO 1996), and, as such, the concentrations are typically regulated in most environmental media. One percent of farming soil samples exceed the 50mgkg–1 UK maximum admissible concentration (MAC) for agricultural soil (Table 3; MAFF 1998). These are centred on the urban periphery and peaty acid soil such as the samples from Sherrifcleugh and Logan Water. A comparison of median ratios suggests As concentrations in urban soil are only marginally higher than in ruralD-C soil (1.1 times; Table 5), and Figure 5 shows substantial overlap in data ranges between the urban and rural environment. However, unpaired t-tests reveal concentrations in urban soil are statistically significantly higher (P<0.0001) than in ruralD-C soil.
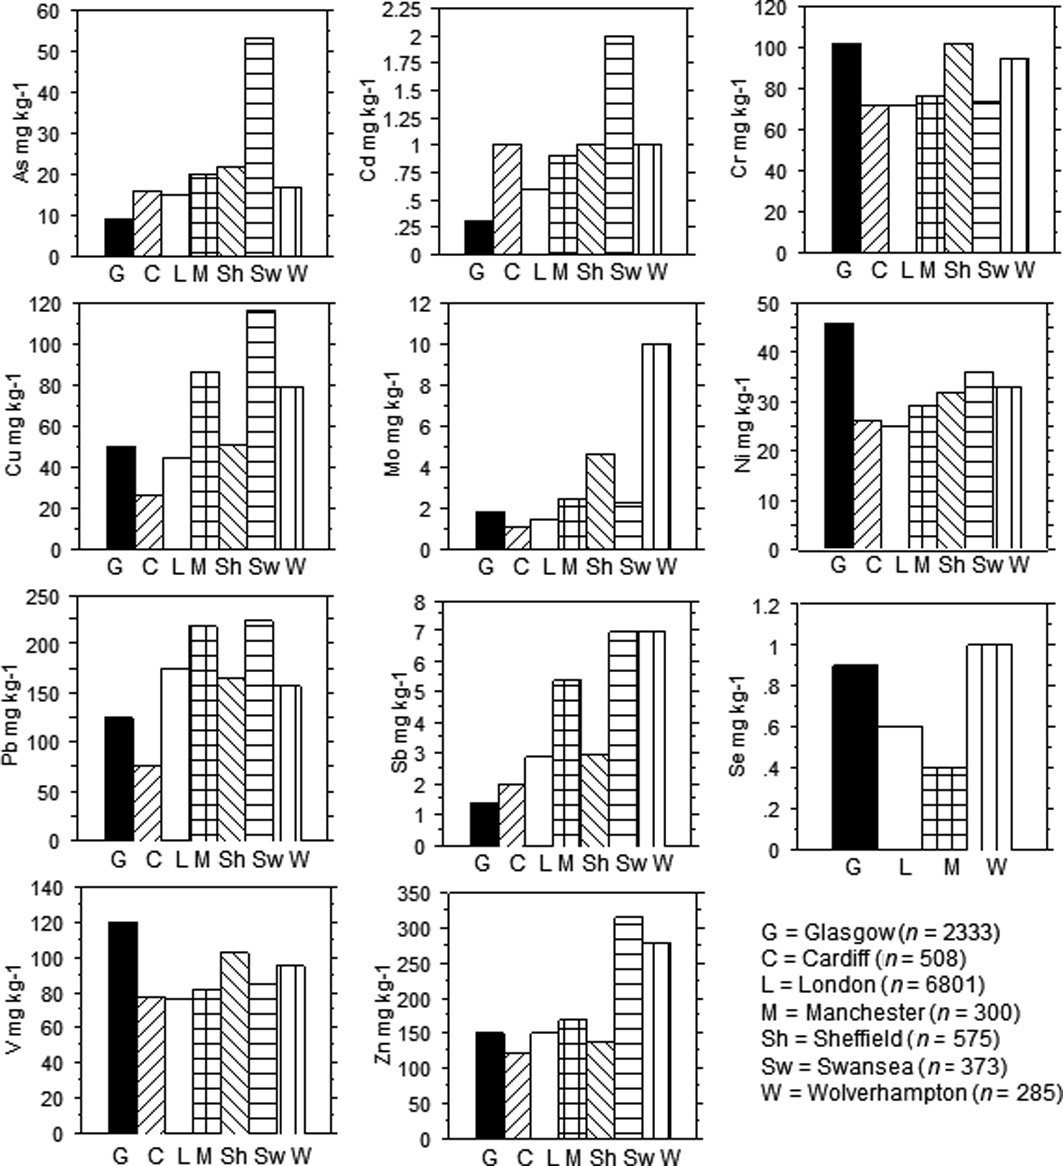
Indeed, the influence of humans on the distribution of As in soil is evident. Elevated As concentrations are associated with former extractive industries, such as the oil shale works at Tarbrax in the E of the Basin, the Brownlee, Newmains and Riggend collieries as well as iron and clay pits in Wishaw, Coatbridge and Motherwell. Similarly, higher concentrations of As are associated with the former ship building, engineering and metal working centres in Glasgow and Beith and brick works in Paisley (Fig. 8). However, only 2% of urban and 1% of rural topsoil samples exceed the most precautionary (residential use) 32mgkg–1 UK land contamination SGVs (EA 2009b; Table 4). Indeed, on average (median values), As concentration in urban topsoil from Glasgow is lower than for other large UK cities Fig. 9) and both urban and rural topsoils from the Clyde Basin are lower in As than soil in England and Wales (Table 5).
Bar charts of selected median element concentrations in urban topsoil from Glasgow compared to other large UK cities. Based on data from Fordyce et al. (Reference Fordyce, Brown, Ander, Rawlins, O'Donnell, Lister, Breward and Johnson2005), BGS (2011) and this study.
3.4. Topsoil cadmium (Cd)
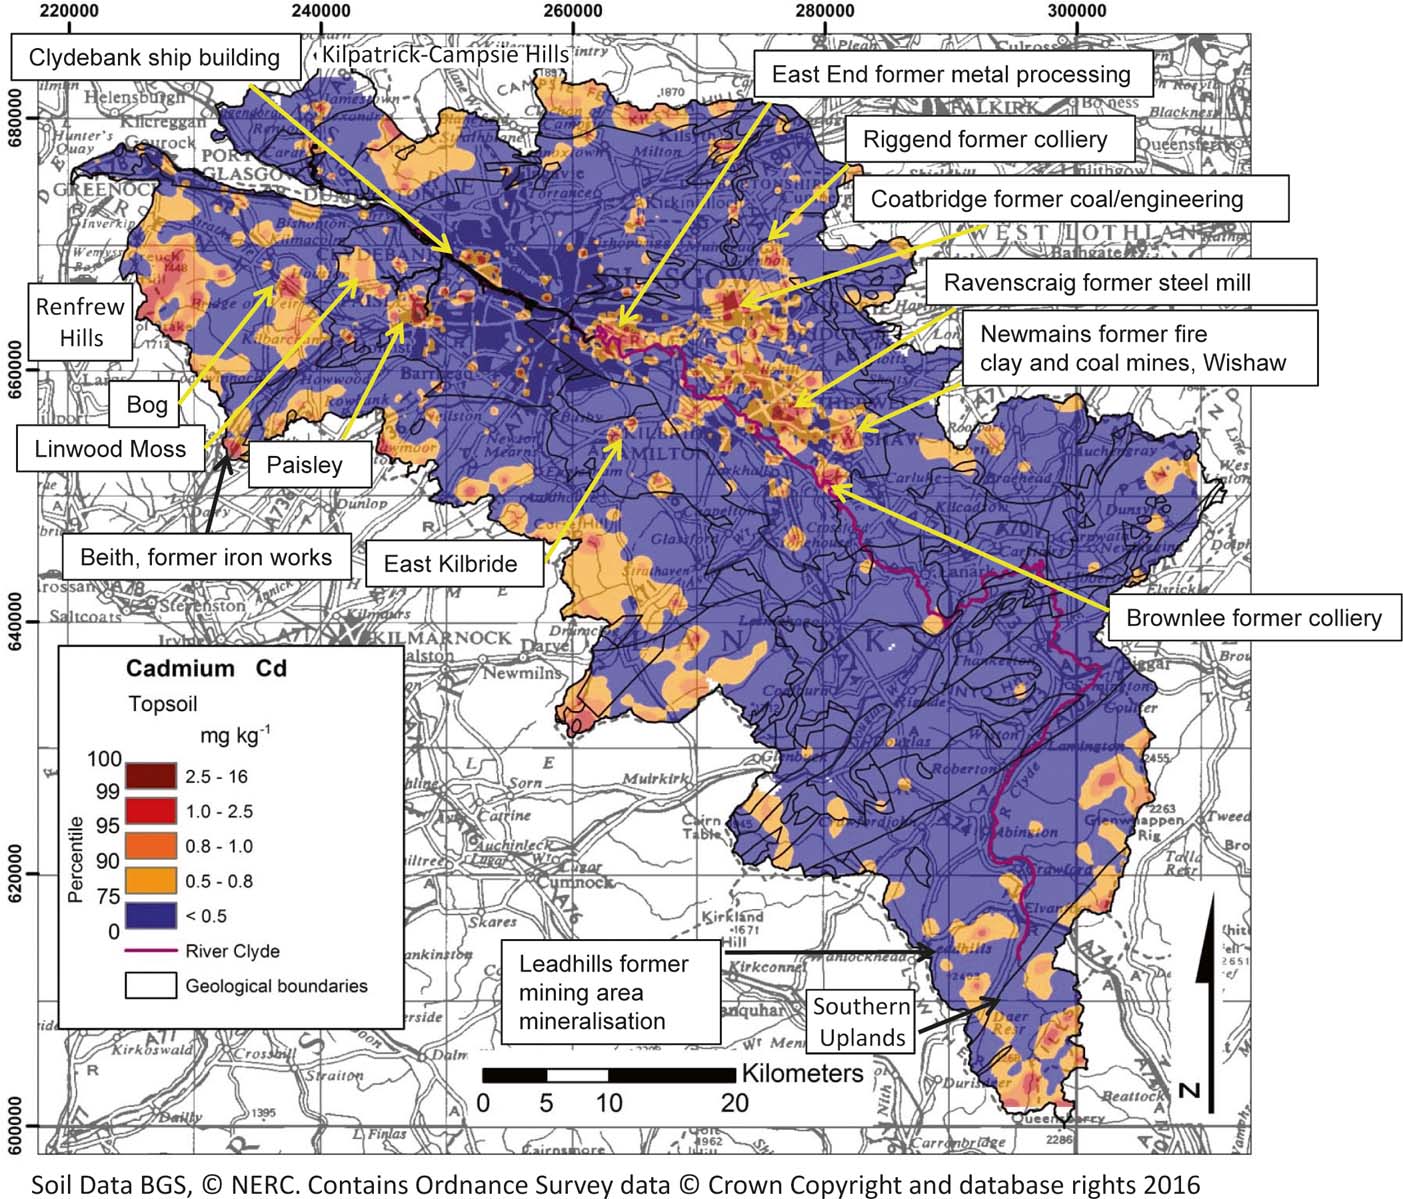
The majority of topsoil in the Clyde Basin contains Cd concentrations below the lower limit of detection (0.5mgkg–1), as expected, as Cd is generally of very low abundance in most soil (Reimann & Caritat Reference Reimann and Caritat1998) (Fig. 10). Where Cd is detected, values range up to 16mgkg–1 and median values are similar to those reported in Scottish, English, Welsh and world soils and in urban soil to those reported in Glasgow previously (Table 5). In the rural environment, higher concentrations are associated with upland organic-rich soil in the Southern Uplands, Renfrew Hills and Kilpatrick–Campsie Hills (see Fig. 10 for locations). Similarly, peaty/boggy soil in the vicinity of Linwood Moss to the W of Paisley contains elevated concentrations of Cd, indicating the importance of atmospheric deposition of the element and binding in this organic-rich soil. As a result, Cd concentrations in moorland soil is significantly higher (P<0.05; post-hoc Tukey HSD) than soil over all other land-use types except mining (Table 9; Fig. 7).
Map of total Cd concentrations in Clyde Basin topsoil.

Topsoil collected in the Leadhills former mining area also contains higher Cd concentrations relative to most of the rural Clyde Basin (0.5–1.1mgkg–1) and is elevated 2.3 times the rural background on the basis of median values over similar rock types (Table 7). Higher concentrations in rural soil are reported also from former coal mining sites at Riggend to the N of Airdrie and Brownlee S of Motherwell (Fig. 10).
Industry and residential garden/allotment soil samples contain similar quantities of Cd to mining, derelict land and residential open-space soil, but significantly higher (P<0.05; post-hoc Tukey HSD) concentrations than agricultural, park, woodland, school or road-verge soil (Table 9; Fig. 7). This probably reflects the former use of coal as both a domestic and industrial fuel source and the metal-processing history of Glasgow. Indeed, elevated values are associated with the ship-building centre at Clydebank and the former metal-processing heartland in the East End of the city. Similarly, concentrations are generally higher in urban topsoil from Airdrie, Beith, Motherwell and Wishaw, including at the Ravenscraig former steel mill, reflecting the history of metal processing and coal and fire clay extraction in these urban centres. Elevated concentrations are also reported from current and former industrial sites in Paisley. Higher concentrations in the centre of East Kilbride probably relate to diffuse urban pollution such as coal waste noted in the samples (Fig. 10). Cd in urban topsoil shows a strong correlation (P<0.05) with Zn (Table 6), reflecting the close geochemical association of these elements, which are both chalcophile with similar ionic structure. Cd often substitutes for Zn in sulphide ore minerals and both elements are released during metal processing (Smoulders & Mertens Reference Smoulders, Mertens and Alloway2013).
Cd is not a biologically essential element, it is generally toxic to most organisms and is typically regulated under environmental monitoring regimes (WHO 1996). In the present study, none of the rural soil samples exceed the UK MAC of 3mgkg–1 for agricultural soil (Table 3; MAFF 1998). Average Cd concentrations are statistically similar in urban versus ruralD-C soil (P=0.1897; unpaired t-test) (Table 5; Fig. 5). Median Cd values are lower in Glasgow than other large UK cities (Fig. 9) and topsoil Cd concentrations across much of central Glasgow are low (Fig. 10). However, as a result of industrial/urban inputs, 2% of urban compared to only 0.1% of rural topsoil samples exceed the most precautionary UK 1.8mgkg–1 SGVs (allotment land use) (EA 2009b; Table 4).
3.5. Topsoil chromium (Cr) and nickel (Ni)
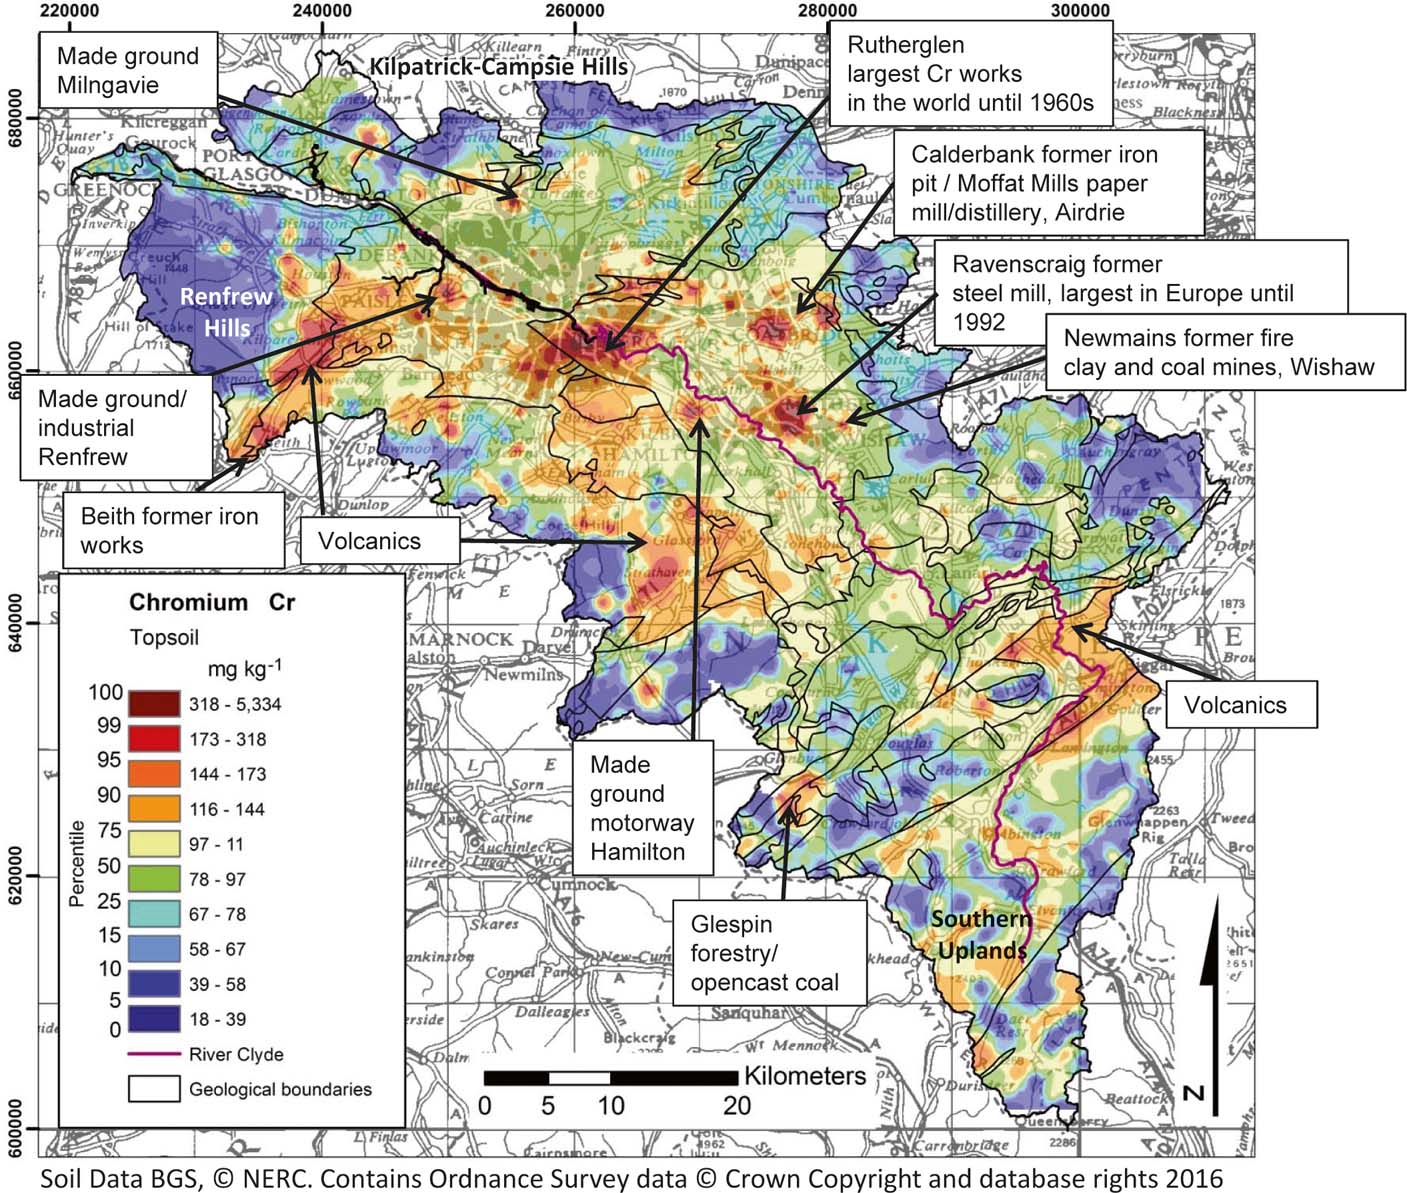
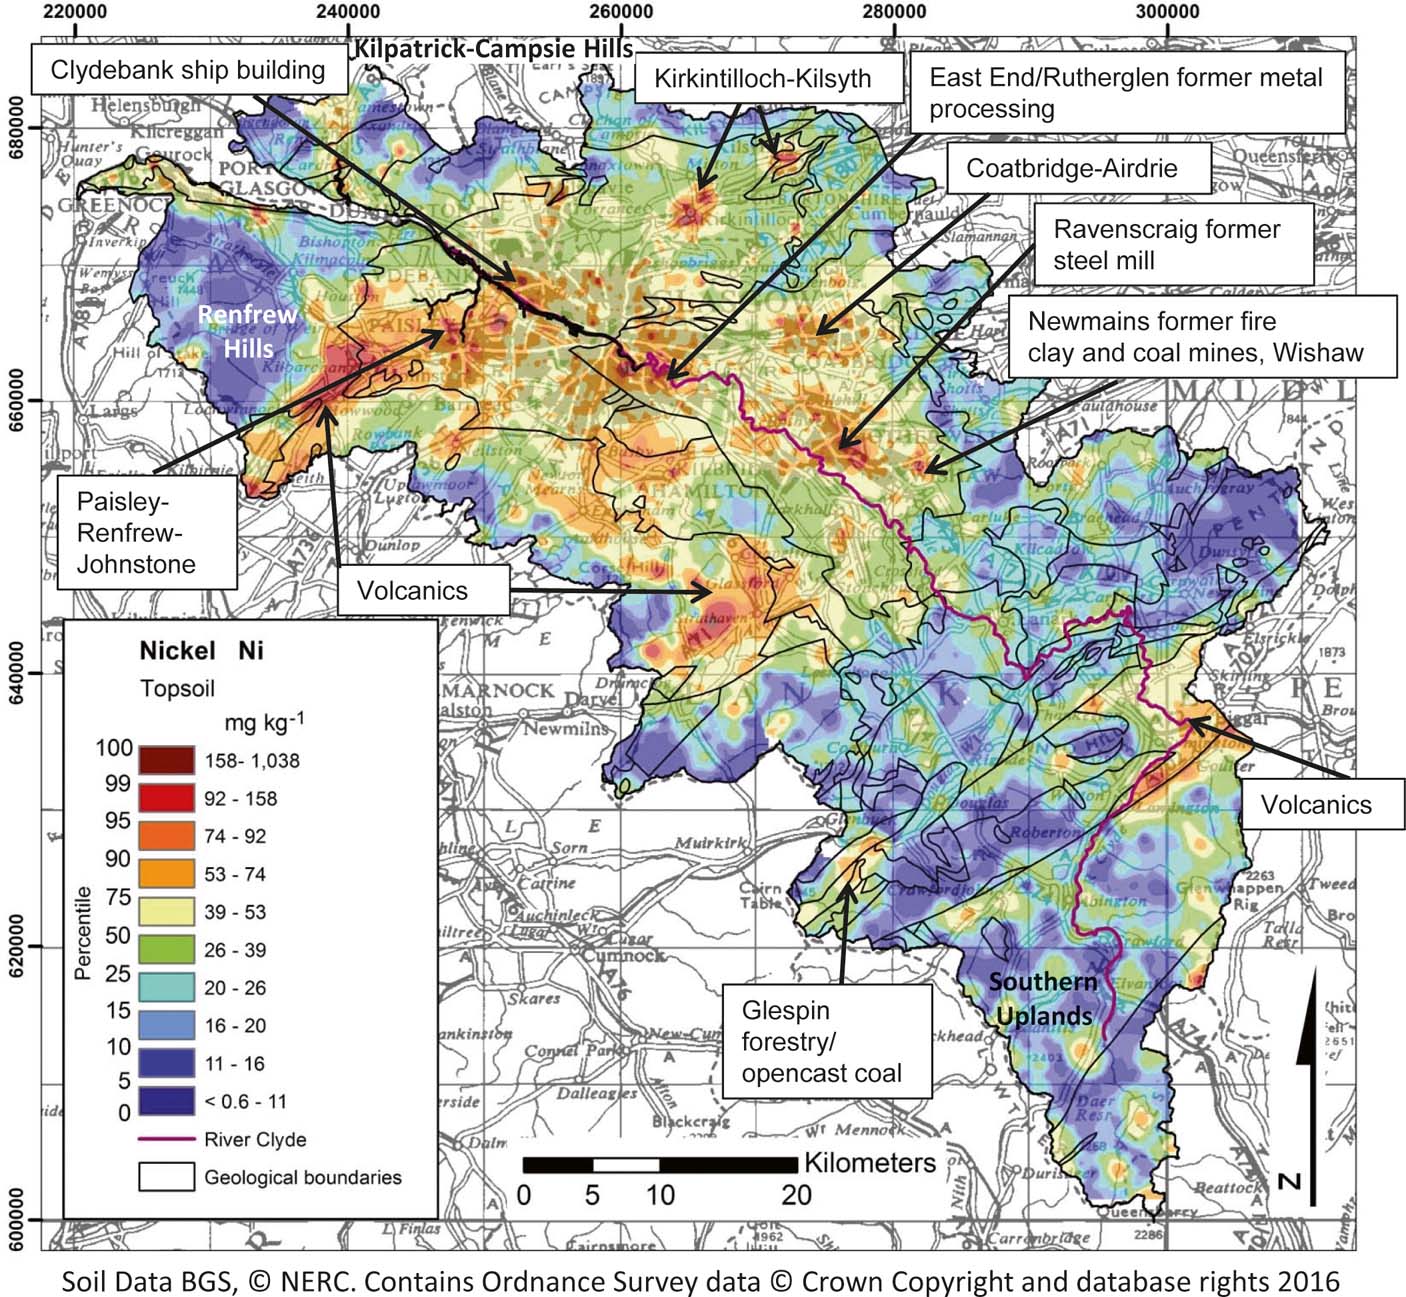
Topsoil Cr and Ni show similarities in distribution and controls across the Clyde Basin (Figs 11, 12). In the environment, these elements are typically associated with mafic and ultramafic igneous rocks, and concentrations are commonly higher in organic-rich rocks such as black shale and coal than in other sedimentary lithologies (Gonnelli & Renella Reference Gonnelli, Renella and Alloway2013). As a result, in the Clyde Basin rural topsoil, higher concentrations are associated with the outcrop of the Silurian–Devonian mafic volcanic rocks in the SE of the Basin and with the more mafic components of the CPVF to the SW of Glasgow, as expected. Lower concentrations of both elements are reported in soil developed over the sandstone-dominated Old Red Sandstone and Inverclyde Groups than the Clackmanan–Strathclyde and Scottish Coal Measures successions (Figs 11, 12). Cr and Ni in rural topsoil correlate strongly (P<0.05; Table 6) with each other and with V, which is also typically associated with mafic igneous soil parent materials and coal-bearing strata (Alloway Reference Alloway and Alloway2013). Concentrations of topsoil Cr are generally higher over the Leadhills Supergroup and Gala Group in the S of the Basin, reflecting the basic source rocks of these greywacke metasediments (Stone et al. Reference Stone, Green and Williams1997; see Figs 11, 12 for locations). As a result of these igneous rock sources, rural topsoil median Cr values across the Clyde Basin are higher than those reported for Scottish or English and Welsh soils (Table 5). By contrast, most of the rural Clyde Basin soil is characterised by low–average Ni concentrations, similar to those reported in Scottish, English, Welsh and world soils (Table 5).
Map of total Cr concentrations in Clyde Basin topsoil.

Map of total Ni concentrations in Clyde Basin topsoil.

Upland peaty soil on the eastern and western peripheries of the Basin and over the CPVF to the W and N of Glasgow has low Cr and Ni concentrations due to its organic rather than mineral soil composition. Indeed, Cr shows a strong negative correlation (P<0.05) with LOI in rural soil (Table 6) and Cr and Ni moorland and mining soil concentrations are significantly lower (P<0.05; post-hoc Tukey HSD) than soil over other land uses in the Basin (Fig. 7; Table 9). McIlwaine et al. (Reference McIlwaine, Cox, Doherty, Palmer, Ofterdinger and McKinley2014) report similar controls on these elements in upland peaty soil in Northern Ireland.
Higher values of both elements at Glespin in the SE of the Basin are associated with coniferous forestry and opencast coal mining, and correspond to high-Mn soil suggesting retention of Cr and Ni in secondary Mn oxides in this low-pH environment. Similarly, higher values at the foot of the Campsie Hills to the N of Glasgow correspond to higher Mn–Fe soil. Indeed, Cr in rural topsoil correlates strongly (P<0.05) with Mn (Table 6).
Across the Clyde Basin in general, Cr and Ni concentrations in agricultural and woodland soils, whilst significantly higher (P<0.05; post-hoc Tukey HSD) than in moorland areas, are lower than over other land-use types in the region, with the exception of Cr in school-yard soil (Fig. 7; Table 9). Only one of the farmland soil samples in the area exceeds the UK agricultural MAC for Cr, but 14% exceed the 50mgkg–1 (pH<5.5) Ni MAC (MAFF 1998; Table 3), reflecting the dominance of low-pH soil in the area. These soil types may be sensitive to agricultural inputs such as sewage sludge, which often contain elevated concentrations of Cr and Ni; hence, their application is regulated under current UK environmental legislation (DOE, 1996).
Anthropogenic activities have a significant influence on the distribution of Cr and Ni in urban topsoil. High values are associated with made ground in Milngavie, the Moffat Mills distillery/former paper mill in Airdrie, ironworks in Beith and with made-ground and industrial sites in Renfrew–Paisley–Johnstone. Soil Ni is elevated also in Kirkintilloch and Kilsyth, and in the ship-building centre of Clydebank. High concentrations of both elements are reported in soil from the former Ravenscraig steel mill in Motherwell and the former iron pit at Calderbank in Coatbridge (Figs 11, 12). Rutherglen in SE Glasgow was home to the world's largest chromite ore processing plant during the 19th Century, which operated until 1968. Chromite ore processing residues were extensively used as landfill material around SE Glasgow, and it is estimated that 2,500,000 tons (dry weight) were dumped during the lifetime of the factory (Farmer et al. Reference Farmer, Graham, Thomas, Licona-Manzur, Paterson, Campbell, Geelhoed, Lumsdon, Meeussen, Roe, Conner, Fallick and Bewley1999). As a consequence, Cr (>173–4286mgkg–1) and, to a lesser extent, Ni concentrations in topsoil in S and E Glasgow are significantly elevated (Figs 11, 12). Cr and Ni correlate strongly (P<0.05; Table 6) in urban topsoil as both commonly occur in mineral deposits associated in ultramafic and mafic rocks and in coal deposits, and are often released to the environment together from metal processing and coal-burning activities (Gonnelli & Renella Reference Gonnelli, Renella and Alloway2013). Similarly, Ni correlates strongly (P<0.05) with Cu and Zn in both rural and urban soils and with Mo in urban soil, probably reflecting metal-processing inputs (Table 6). Both elements are statistically significantly higher in urban than in ruralD-C topsoil samples (P<0.0001; unpaired t-tests), and are elevated (Cr 1.2 and Ni 1.7 times, respectively), based on median ratios (Table 5). Consequently, a greater proportion of urban (3%) than rural (0.5%) soils exceed the most precautionary CLEA residential land use at 130mgkg–1 Ni SGV, reflecting the impacts of the urban environment on soil quality (EA 2009b; Table 4).
The ranges in concentration of urban topsoil Cr and Ni are greater than those reported previously in Glasgow by Madrid et al. (Reference Madrid, Diaz-Barrientos, Ruiz-Cortes, Reinoso, Biasioli, Davidson, Duarte, Grcman, Hossack, Hursthouse, Kralj, Ljung, Otabbong, Rodrigues, Urquhart and Ajmone-Marsan2006), based on 27 samples collected in Glasgow Green and Alexandra Park (Table 5). This is expected given the greater number of sites surveyed during the present project. Both elements are, overall, higher (median values) in Glasgow urban soil than several other large UK cities (Fig. 9), and median values of Cr in Glasgow are comparable to those in Sheffield, which has a similar history of steel making and metal processing. Indeed, 18% of urban and 10% of rural topsoil exceeds the most precautionary UK Cr SGV of 130mgkg–1 (residential land use; EA 2002). However, this older SGV is for soil total-Cr, whereas concerns about Cr concentrations in the environment centre on the speciation of the element and this is taken into account in the more recent UK SSL guidance, which refers to CrVI (DEFRA 2014). Trivalent Cr, the most common form in natural soil, is an essential nutrient for insulin regulation, whereas CrVI, which is far less common in nature, is a known human carcinogen (WHO 1996). In most soil, CrVI is reduced to CrIII in the presence of organic matter, with reduction most rapid in acidic soil. However, industrial processes such as metal processing and leather tanning can release CrVI to the environment (WHO 1998).
Following concerns about CrVI in soil associated with the legacy of chromite ore processing residues in SE Glasgow, Broadway et al. (Reference Broadway, Cave, Wragg, Fordyce., Bewley, Graham, Ngwenya and Farmer2010) investigated CrVI concentrations in 21 of the highest total-Cr concentration G-BASE Glasgow urban topsoil samples and a further six samples collected from the Cr-waste sites. Results revealed that CrVI concentrations ranged from <1.8 to 1485mgkg–1. However, concentrations in excess of the new most precautionary (residential land use) DEFRA (2014) SSL of 21mgkg–1 CrVI were present in only three of the topsoil samples from the known Cr-waste sites. Further tests to examine possible human uptake via soil ingestion, using a universal bioaccessibility method that simulates conditions in the digestive system, showed that CrVI in the soil was reduced in the presence of soil organic matter and low stomach pH to CrIII in the gut solutions, and was of less concern for human uptake. However, simulations of inhalation exposure on two of the Cr-waste soil samples using Gamble's solution to mimic lung fluid indicated CrVI present in the <10μm soil-size fraction, suggesting inhalation may be an exposure route warranting further investigation. The Cr-waste sites in Glasgow have undergone significant remediation in recent years, including the lining and diverting of water courses away from the waste dumps, in-situ chemical treatments with calcium polysulphide and capping/containment of the waste materials to mitigate the impacts on soil and water quality and human interaction as part of major urban regeneration programmes in the East End of Glasgow (Bewley & Sojka Reference Bewley and Sojka2013).
3.6. Topsoil lead (Pb)
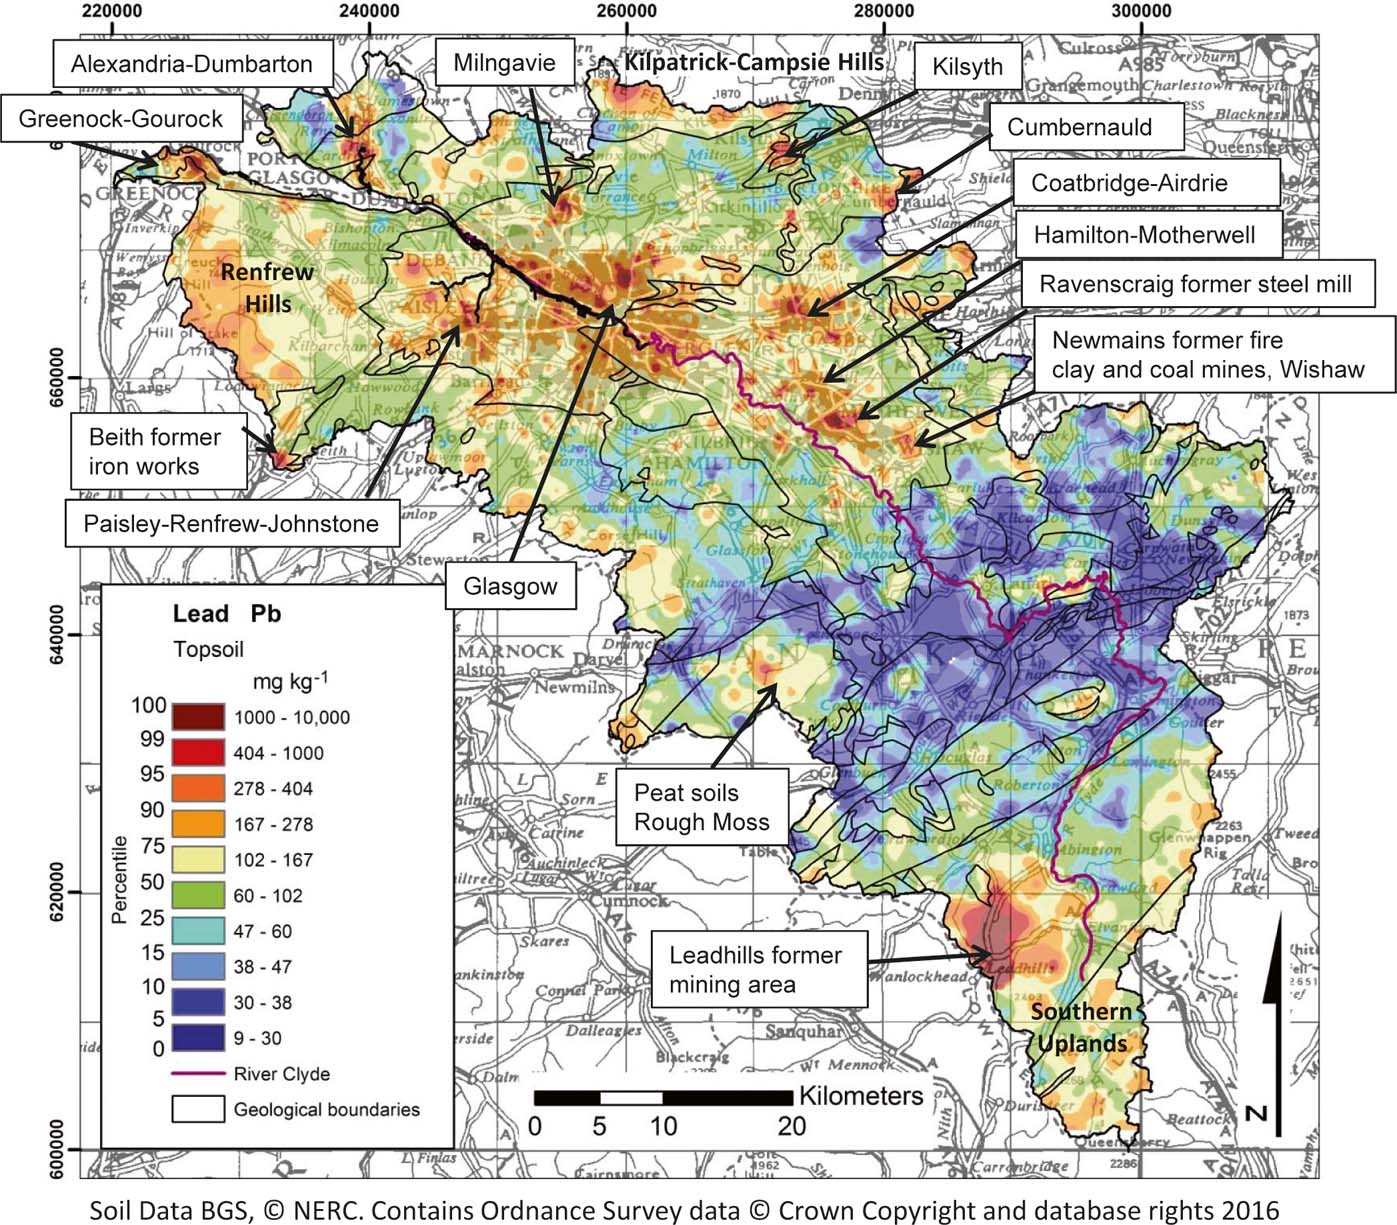
Concerns about the distribution of Pb in the environment centre on the fact that it has no known biological function, and is generally toxic to most life forms. It can cause mental impairment in young children (WHO 1996). Pb concentrations in Clyde Basin rural topsoil are markedly higher than those reported for Scottish, English, Welsh and world soils, based on median values (Table 5), as a result of the mineralisation/mining and organic-rich soil present in the area. The most notable control on the distribution of Pb in the Clyde Basin is the former Leadhills mining area in the S of the area (see Fig. 13 for locations). Within the mining district, concentrations range from 74mgkg–1 to very high values of 10,000mgkg–1, and soil Pb is, overall (median ratios), elevated 4.3 times the surrounding rural geochemical background over the Leadhills Supergroup rock types, indicating the impact of former mining activity on soil quality (Table 7). Rowan et al. (Reference Rowan, Barns, Hetherington, Lambers and Parsons1995) reported a similar magnitude of enhanced Pb concentrations, 2–3 times the typical background, in floodplain sediments in the Leadhills area. Elevated blood-lead levels (15.9 men; 12.4 women; 17.6 children μgdL–1), compared to a control area, were reported in the Leadhills mining district by Moffat (Reference Moffat1989). The main exposure routes were thought to be wind-blown dust dispersion from old tailings and local water supplies. The old tailings were subsequently capped and the area supplied by water from outside the mining/mineralised region with low Pb content. Residents were also advised to limit Pb exposure by good hygiene (washing vegetables and hands that may have come into contact with soil), damp dusting to reduce house-dust and the avoidance of lead piping for water supply in homes (Chandler et al. Reference Chandler, Cromie, Breen and Ramsay2012).
Map of total Pb concentrations in Clyde Basin topsoil.

By contrast, Pb concentrations in non-mineralised/mined Clyde Basin rural soil range between 8 and 758mgkg–1. Interestingly, concentrations of soil Pb in the Leadhills mining area are not significantly different (P<0.05; post-hoc Tukey HSD) to moorland, residential garden and school-yard soils, but they are significantly higher than the other land uses in the study area (Fig. 7; Table 9). In the case of moorland soil, this is because Pb is strongly bound to organic matter in soil (Steinnes Reference Steinnes and Alloway2013), and in the rest of the rural Clyde Basin, peaty areas such as Rough Moss and upland areas on the periphery of the Basin, including the Southern Uplands, Renfrew Hills and Kilpatrick–Campsie Hills, contain higher Pb concentrations as a result of atmospheric deposition and trapping of Pb in this organic-rich soil. Indeed, the atmospheric deposition of Pb and retention in Scottish peatlands has been documented by Cloy et al. (Reference Cloy, Farmer, Graham, Mackenzie and Cook2008), who demonstrated that it was greatest between the 1880s and 1960s, with annual rates of ca.10–40mgm–2 per year, declining to ca.0.44–5.7mgm–2 per year by the 2000s, as a result of the removal of Pb from petrol and reductions in coal usage and heavy industry. Pb shows a strong correlation (P<0.05) with Sb and Se in rural soil, reflecting the control of organic matter on the distribution of all three elements (Table 6). In contrast to organic-rich soil, concentrations in rural mineral soil in the middle of the Clyde Basin, developed over Devonian and Carboniferous sediments, are notably lower (<30mgkg–1) (Fig. 13). Indeed, agricultural and woodland soils contain significantly lower (P<0.05; post-hoc Tukey HSD) Pb concentrations than all other land-use types (Table 9; Fig. 7). However, it should be noted that using soil profiles from the National Soil Inventory of Scotland (2007–2009), Farmer et al. (Reference Farmer, Graham, Eades, Lilly and Bacon2016) found that about half of the Pb in cultivated agricultural soils (Ap) to a depth of 30cm was anthropogenic. Only 2% of Clyde Basin farming soil exceeds the UK agricultural MAC of 300mgkg–1 in the Leadhills area and on the periphery of the urban environment as a result of mining and urban impacts in the region.
Pb concentrations in Glasgow urban topsoil show a greater range than those reported by Gibson & Farmer (Reference Gibson and Farmer1983; Table 5), reflecting the wider extent of the current study, but are moderate compared to other large UK cities (based on median values; Fig. 9). Nonetheless, the effects of pollution are evident whereby higher values are associated with the former iron and steel works at Beith and Ravenscraig and the former fire clay and coalmines at Newmains in Wishaw (Fig. 13). In addition to strong correlations with Sb and Se, which were also noted in rural soil, the element correlates strongly (P<0.05) with Cu and Zn in urban soil, reflecting industrial, transport and energy-generation sources (Table 6). Concentrations of soil Pb are significantly higher (P<0.05; post-hoc Tukey HSD) in residential gardens and schools than in other urban land uses, most likely as a result of the former use of coal as domestic fuel and dispersal of coal ash into gardens/yards, and the historical use of Pb in paint (Table 9; Fig. 7). Indeed, further investigations using Pb-isotope analysis on 19 of the Glasgow G-BASE soil samples revealed that Pb was derived from a combination of coal, paint and petrol sources (Farmer et al. Reference Farmer, Broadway, Cave, Wragg, Fordyce, Graham, Ngwenya and Bewley2011). Interestingly, over the area as a whole, Pb shows no significant increase in road-verge soil concentrations (P<0.05; post-hoc Tukey HSD) relative to other land-use types, despite the former use of Pb in petrol (Table 9; Fig. 7). This may be because many of the road verges sampled during this study were located on quiet residential roads, rather than busy traffic routes. Indeed, MacKinnon et al. (Reference MacKinnon, MacKenzie, Cook, Pulford, Duncan and Scott2011) showed that the dispersal of petrol Pb in soil to the W of Glasgow was restricted to within 3m of minor roads. However, the city centres across the area do show elevated topsoil Pb concentrations (Fig. 13), which probably, in part, reflects greater traffic densities in the most urbanised zones.
As a result of these anthropogenic inputs, Pb is statistically significantly higher (P<0.0001; unpaired t-test), and is enhanced 1.8 times (based on median values) in Clyde Basin urban versus ruralD-C soil (Table 5), and 6% of urban versus 1% of rural soils exceed the UK CLEA residential land-use SGV of 450mgkg–1 (EA 2002; Table 4). Based on a subset of the G-BASE Glasgow urban dataset, investigations into the oral bioaccessibility of Pb in 27 topsoil samples revealed that 23–77% (mean 52±13%) of Pb was bioaccessible. The oral bioaccessible Pb concentration in the soil exceeded the 450mgkg–1 CLEA residential SGV in eight samples, only one of which was a garden soil (Farmer et al. Reference Farmer, Broadway, Cave, Wragg, Fordyce, Graham, Ngwenya and Bewley2011). There is a great deal of uncertainty in the dose–response relationships and toxicological evidence used in the derivation of soil-based human health risk guidelines and values (EA 2009a); hence, the guidelines vary through time as science advances. The new DEFRA (2014) UK allotment and residential SSLs of 80 and 200mgkg–1, respectively, are lower than the CLEA SGV because of growing evidence for the toxicological effects of low-level exposure to Pb, prompting bodies such as the US Centres for Disease Control and Prevention to revise the reference blood Pb value in children from 10 to 5μgdL–1 (CDC 2012). As such, nearly half the rural soil samples (45%) and most of the urban soil samples (76%) exceed the new allotment SSL (Table 4). An allotment is a rather specific land-use type and would not apply to the vast majority of these soil types. Nonetheless, a significant proportion of the Clyde Basin soil samples (8% of rural and 26% of urban) also exceed the new residential SSL (Table 4).
The new SSLs were brought out to accompany revisions to the contaminated land legislation in England and Wales undertaken in 2012. The revisions introduced the concept of ‘normal concentrations of contaminants in soil', which should not be considered to cause land to be defined as contaminated unless there are specific reasons to do so. These include natural sources of contaminants, which are typical in an area that does not pose an unacceptable risk to health and low-level diffuse pollution (DEFRA 2012). The aim of the new guidance was to focus attention on point sources of pollution. To accompany the SSLs, a series of normal background concentrations (NBCs) of PHS in soil were determined for urban, mineralised and principal land-use domains across both England and Wales to aid regulators in their contaminated land assessments (Ander et al. Reference Ander, Johnson, Cave, Palumbo-Roe, Nathanail and Lark2013; DEFRA 2014). However, DEFRA (2014) recognise that there is an issue when the SSLs are below the normal or typical concentrations of a PHS in soil, as in the case of Pb. In these circumstances, the use of the NBC rather than SSL is recommended, provided site characterisation can demonstrate that site use and the chemical form/bioavailability of a PHS is analogous to the typical background.
Similar NBCs have not been defined for Scotland, but comparison between the Clyde Basin topsoil and English NBC values for Pb reveal that 2% of urban soil samples exceed the 820mgkg–1 English urban NBC; 9% of rural soil samples exceed the 180mgkg–1 English principal NBC; and 10% of soils in the Leadhills area exceed the 2400mgkg–1 English mineralised NBC. The methodology employed to determine the NBCs for England and Wales has been called into question in recent studies to establish local NBCs in Northern Ireland (McIlwaine et al. Reference McIlwaine, Cox, Doherty, Palmer, Ofterdinger and McKinley2014) and NE England (Rothwell & Cooke Reference Rothwell and Cooke2015), and future work by the present authors in the Clyde Basin will focus on optimising statistical analysis to define NBCs for the area.
As a result of the lower Pb SSL and new guidance, far fewer urban sites are likely to be categorised as ‘not contaminated' during the first phase of land-quality risk assessment under the current environmental legislation. More sites will have to undergo detailed site-specific investigations to assess potential risks such as source–pathway–receptor linkages and the proportion of soil Pb that is available for plant/human uptake via bioaccessibility tests adding to the costs of development. The significant percentage of urban soil samples exceeding the guideline highlights the difficulties in protecting human health from a substance, which can cause deleterious effects at low concentration on the one hand, but that is ubiquitous in the environment on the other.
3.7. Topsoil selenium (Se)
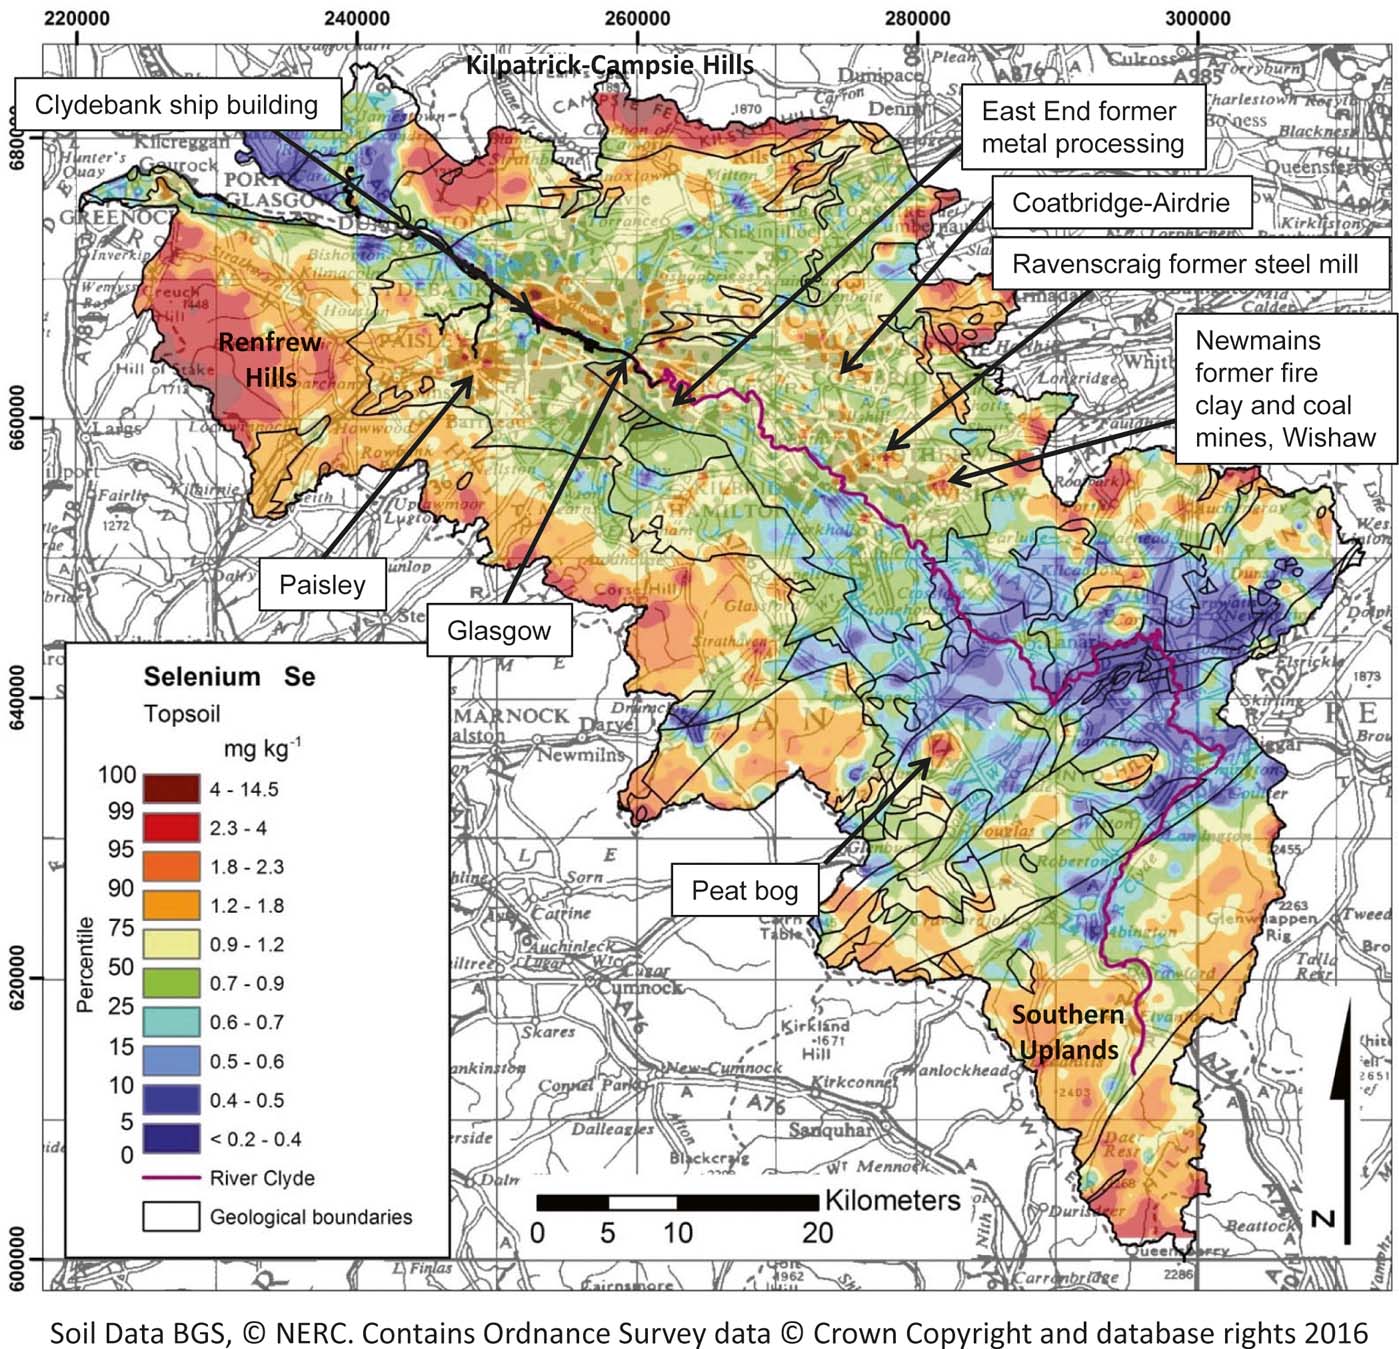
Topsoil Se concentrations across the Clyde Basin range from <0.2 to 14.5mgkg–1 (Fig. 14). Its distribution in rural environments is largely controlled by the presence of organic-rich soil in the upland and peaty areas on the periphery of the area. As a result, moorland soil has significantly higher concentrations (P<0.05) of Se than soil over all other land-use types in the region (Table 9; Fig. 7). Se shows a strong correlation (P<0.05) with LOI and Pb in both rural and urban soil, reflecting this organic matter association. Conversely, lower Se concentrations are reported in rural mineral soil developed over the mature sandstone-dominated Old Red Sandstone and Inverclyde Group sediments in the centre of the Basin and around Dumbarton. Whilst some rock types such as black shale and coal can contain high levels of Se, its concentration in most rock types, and in the soil derived from them, is generally low (<0.3mgkg–1). Hence, in many circumstances its distribution in soil is dominated by the organic matter content, which readily sorbs the element in the soil profile (Johnson et al. Reference Johnson, Ge, Green and Liu2000; Fordyce et al. Reference Fordyce, Brereton, Hughes, Luo and Lewis2010; Shand et al. Reference Shand, Balsam, Hillier, Hudson, Newman, Arthur and Nicol.2010; Fordyce Reference Fordyce and Selinus2013). Concentrations in Clyde Basin rural soil are, overall (median values), higher than those reported for soil in Scotland as a whole and England and Wales, reflecting the dominance of organic-rich soil in the area. Se is an essential element for human and animal health, involved in a number of key enzymes and selenoproteins in the body. Se deficiency has been implicated in heart disease, growth and development disorders. Conversely, excess Se exposure can result in hair and nail loss and neurological disorders (EA 2009b). In the Clyde Basin area, 17% of agricultural soil samples are below the recommended thresholds for grassland soil (0.6mgkg–1; Fordyce Reference Fordyce and Selinus2013), indicating that grazing animals may require Se supplementation to avoid deficiency.
Map of total Se concentrations in Clyde Basin topsoil.

On the basis of median value ratios, Se is not elevated in urban versus ruralD-C soil (Table 5); rather, the element is statistically significantly higher in ruralD-C than in urban soil (P<0.0001; unpaired t-test). Nonetheless, concentrations are elevated in the urban environment with specific anomalies associated with the Ravencraig former steel mill, Newmains former fire clay and coalmines in Wishaw, the former metal processing centres of the East End of Glasgow and Airdrie–Coatbridge, as well as ship building in Clydebank and the former industrial centre of Paisley (Fig. 14). However, none of the rural or urban soils across the region exceed the most precautionary (allotment land use) CLEA SGV of 120mgkg–1 (Table 4).
3.8. Soil quality information for copper (Cu), molybdenum (Mo), antimony (Sb), vanadium (V) and zinc (Zn)
Although not the main focus of this paper, summary information for Cu, Mo, Sb, V and Zn in Clyde Basin topsoil is presented in the context of land quality assessments. The results reveal that on the basis of median concentration ratios, Cu (×2.1), Mo (×1.8), Sb (×1.8), V (×1.2) and Zn (×1.7) are all elevated in urban compared to ruralD-C topsoil across the region (Table 5) and that urban soil concentrations are statistically significantly higher than ruralD-C soil (P<0.0001; unpaired t-tests), indicating the impact of urbanisation on soil quality in the area. Indeed, due to the organic rather than mineral composition of upland soil, the rural moorland and mining areas exhibit significantly lower (P<0.05; post-hoc Tukey HSD) concentrations of soil Cu, Mo, V and Zn than soil over other land uses in the Basin. Whilst significantly higher than moorland areas, concentrations of these elements are also significantly lower in agricultural and woodland soil than other land-use types in the region (P<0.05). Similarly, agricultural soil contains significantly lower (P<0.05) Sb concentrations than all other land-use types in the Basin, with the exception of woodland soil (Fig. 7; Table 9). Interestingly, residential garden soil contains similar concentrations of Sb and Zn to derelict land, schoolyard, industrial, mining (Sb only) and residential open space (Zn only) soil, but is significantly higher (P<0.05) than park and road-verge soil, which may reflect the domestic use of coal and spreading of ash in garden soil.
With the exception of Sb, which is generally considered a toxin, all these elements are essential for either animal or human heath in trace amounts, but can be harmful at higher doses (WHO 1996). In terms of agricultural soil across the region, 5% for Cu, and none for Mo and Zn are below the recommended deficiency thresholds for Scottish soil (Table 3). Conversely, 3% for Cu and 7% for Zn of farmland soil exceed the agricultural MAC of 80 and 200mgkg–1, respectively (Table 3; MAFF 1998), and may be sensitive to sewage sludge application. None of the rural soil samples exceed the most precautionary general assessment criteria (GAC) or suitable-for-use levels (S4ULs) for allotment/residential soil commonly used in the UK environmental assessment sector for Cu, Mo and Sb, and only 0.1% of rural soil samples exceed the S4ULs for Zn (Table 4). Similarly, none of the urban soil exceeds the GAC for Mo or Sb, whereas 1% and 4% of urban soil samples are above the S4ULs for Cu and Zn, respectively (Table 4). The majority (87%) of urban and 56% of rural soil samples exceed the allotment S4UL of 91mgkg–1 for V, as this guideline is rather low compared to the natural abundance of V in most soil. For example, Reimann & Caritat (Reference Reimann and Caritat1998) report a world median soil V concentration of 90mgkg–1 (Table 5). In terms of human-made inputs, on the basis of Scottish peat bog core studies, where the maximum sectional concentration was 27mgkg–1, Cloy et al. (Reference Cloy, Farmer, Graham and MacKenzie2011) reported that the atmospheric deposition of anthropogenic V was greatest (1.3–2.0mgm–2 y–1) in the mid-20th Century, before decreasing to 0.1–0.3mgm–2 y–1 in the early years of the 21st Century. There is a great deal of uncertainty in the derivation of this guideline due to limited studies on the toxicological/exposure effects of V (Nathanail et al. Reference Nathanail, McCaffrey, Gillett, Ogden and Nathanail2015), highlighting, again, the difficulty of regulating substances at levels typically found in many soil types and the need for further studies to improve understanding of dose–response relationships for land-quality risk assessments.
3.9. Controls on soil quality
In summary, the presence of mineralisation and mining in the Clyde Basin enhances the concentrations of Pb (and, to a lesser extent, As and Cd) in rural soil in the area. However, upland peaty soil also exerts a significant control on the distribution of metal elements across the Clyde Basin, exhibiting higher concentrations of As, Cd, Pb and Se, due to the atmospheric deposition of these pollutants and retention in organic-rich soil. By contrast, this organic-rich soil is characterised by lower concentrations of geogenic elements such as Cr, Cu, Ni, Mo, V and Zn. Agricultural and/or woodland soil also contains lower concentrations of these elements and of As, Cd, Sb and Pb than soil collected over typical urban land uses such as industry, derelict land, residential gardens and residential open space. Concentrations of Cd, Pb, Sb and Zn are higher in urban soil over residential garden, industrial and derelict land, probably as a result of current/historical industrial application and processing of metals, and of former industrial and domestic use of coal and Pb-based paint.
4. Conclusions
This study presents, for the first time, a regional-scale assessment of soil chemistry for Glasgow and the Clyde Basin, Scotland. It reveals that the dominant controls on soil metal quality are (i) geology, (ii) urbanisation, (iii) metalliferous mineral extraction and (iv) the presence of upland peaty soil. Anthropogenic impacts on soil metal quality are evident in both urban and rural soils across the region.
In the urban environment, the industrial legacy remains, despite many decades since the major decline in heavy industry and numerous regeneration programmes. Higher concentrations of topsoil As, Cd, Cr, Cu, Ni, Pb and Sb are associated with the former ironstone, clay and coal extraction, and As, Cd, Cr, Cu, Fe, Mn, Mo, Ni, Pb, Sb, Se, V and Zn with former metal-processing industries. Interestingly, residential garden soil contains similar (P<0.05) concentrations of Cd, Pb, Sb and Zn to industrial and derelict land soils, reflecting the former use of coal as a domestic fuel and the spreading of coal ash into garden soil, as well as the former use of Pb in paint. Clusters of high soil Pb concentrations are associated with the city centres in the region, reflecting greater traffic densities and the former use of Pb in petrol.
As a result, concentrations of many metals are elevated in city soil relative to the rural background. Elements that occur in nature in trace amounts in most environments but that are associated with urban and industrial sources, such as Cu, Mo, Ni, Pb, Sb and Zn, show greatest enrichment in urban versus rural soil (1.7–2.1 times, based on median values). Higher soil pH in urban areas, relative to rural soil, is indicative of the presence of building rubble, slag and made-ground materials such as concrete in city soil, which is generally calcareous in nature. This is a typical indicator suite of parameters that is symptomatic of urban anthropogenic pollution, found not only in Glasgow but in other cities in the UK and elsewhere (Fordyce et al. Reference Fordyce, Nice, Lister, Ó Dochartaigh, Cooper, Allen, Ingham, Gowing, Vickers and Scheib2012).
In the rural Clyde Basin, former metalliferous mining activity, particularly at Leadhills in the S of the area, has a significant impact on soil quality, with concentrations of metals (As, Cd, Pb) elevated 3.2–4.3 times the rural background. Soil chemistry in the rural environment is also dominated by the presence of moorland peat on the periphery of the basin, with significantly higher (P<0.05) concentrations of Cd, Pb and Se than over most other land-use types as a result of atmospheric deposition and trapping of these elements in organic-rich soil. Indeed, based on median values, concentrations of Se are significantly higher (P<0.05) in moorland soil than in urban land-use soil, and As, Cd and Pb concentrations in moorland soil are comparable to mining and/or urban land uses. By contrast, concentrations of geogenic elements, such as Cr, Cu, Ni, Mo, V and Zn, are lower in these soil types due to their organic rather than mineralogical composition. This is a typical element association for organic-rich soil and similar relationships have been noted in other upland environments (Paterson Reference Paterson2011; Rawlins et al. Reference Rawlins, McGrath, Scheib, Cave, Lister, Ingham, Gowing and Carter2012; McIlwaine et al. Reference McIlwaine, Cox, Doherty, Palmer, Ofterdinger and McKinley2014).
In terms of soil quality for environmental management, 3% or less of farmland soil exceed the UK agricultural soil MACs for As, Cr, Cu and Pb. However, the MACs are exceeded for 14% (Ni) and 7% (Zn) of farmland soil across the Basin and these may be sensitive to sewage sludge application. Conversely, 5% (Cu) and 17% (Se) of farmland soil is below recommended thresholds for agricultural production, indicating that grazing animals/crops may require Cu or Se supplementation against deficiency. Similarly, 96% of agricultural soil is below the threshold of pH 5.6 that is recommended for grassland soil and may benefit from interventions, such as liming to improve production.
As expected, only a very small proportion (≤1%) of rural soil exceeds the current most precautionary UK human exposure soil guidelines for allotment or residential land use for As, Cd, Cu, Mo, Ni, Sb and Se. At least double that percentage of urban soil exceeds the guidelines, reflecting the impact of anthropogenic pollution on urban soil quality. However, the proportion of urban soil exceeding the guidelines for these elements is also low (≤4%), despite the industrial history of Glasgow.
By contrast, a significant proportion (18% urban and 10% rural) of topsoil exceeds the most precautionary UK total-Cr residential CLEA soil guideline (130mgkg–1; EA 2002). Indeed, median topsoil Cr (102mgkg–1) concentrations in Glasgow are higher than in many other UK cities due to the presence of volcanic bedrock in the area, as well as the history of metal processing. Until 1968, Glasgow was home to the world's largest chromite ore processing plant and Cr waste was dispersed across the city. Recently revised human soil-exposure guidelines implemented in England and Wales centre on the concentration of the more toxic CrVI ionic species, typically associated with industrial sources. Additional evidence from a subset of 27 of the highest total-Cr Clyde urban soils demonstrated that CrVI concentrations in excess of the new residential SSL (21mgkg–1; DEFRA 2014) were present in only three topsoil samples from known Cr-waste sites (Broadway et al. Reference Broadway, Cave, Wragg, Fordyce., Bewley, Graham, Ngwenya and Farmer2010). The Cr-waste sites in Glasgow have undergone significant remediation in recent years to mitigate the impacts on ecosystem and human interaction as part of major urban regeneration programmes.
Only 1% of rural and 6% of urban soil samples exceed the UK CLEA residential 450mgkg–1 SGV for Pb. However, the new DEFRA (2014) SSL guidelines introduced to England and Wales are lower because of concerns about the toxicological effects of low-level exposure to Pb. Nearly half the Clyde Basin rural soil samples (45%) and most of the urban soil samples (76%) exceed the new allotment SSL (80mgkg–1). Under this revised Pb guidance, far fewer sites are likely to be categorised as ‘not contaminated' during the first phase of land-quality risk assessment, and will have to undergo detailed site-specific investigations, adding to the costs of development. Similarly, the majority (87%) of urban and 56% of rural soil samples exceed the allotment S4UL (91mgkg–1) for V, as this guideline is rather low compared to its natural abundance. There is significant uncertainty and limited exposure/toxicological evidence on which to base human health risk guideline values for soil. The significant percentage of rural and urban soil samples exceeding the guidelines for Pb and V in this study highlight the need for further investigations to improve understanding of human-to-soil exposure–dose–response relationships to better inform land contamination policy, development and regeneration.
By understanding the sources, distribution and controls of essential and PHS in soil across Scotland's major conurbation, Glasgow, and the surrounding River Clyde catchment, the G-BASE Clyde Basin dataset highlights areas to target in terms of (i) provision of nutrients and environmental protection in agricultural production, and (ii) mitigating pollution impacts and land contamination during planning and development. With growing needs to reutilise brownfield land, and concerns about the ecological and human health impact of potentially harmful metals in the environment, such data are a valuable tool to aid the understanding of soil-ecology-health systems and inform environmental protection and sustainable development.
5. Acknowledgements
The authors would like to thank the British Geological Survey (BGS) Geochemical Baseline Survey of the Environment (G-BASE) staff and student volunteers and analytical laboratory teams for their invaluable contributions to the Clyde Basin soil survey, including Sarah Nice, Dr Louise Ander, Cathy and Andreas Scheib, Mick Strutt, Andrea Mills, Dr Charlie Gowing, Dr Michael Watts, Dr Chris Milne, Mark Allen, Kevin Barker and Mark Ingham. The local authorities (Glasgow City Council, Renfrewshire Council, East Renfrewshire Council, Inverclyde Council, North Lanarkshire Council, South Lanarkshire Council, East Dunbartonshire Council and West Dunbartonshire Council), farmers and landowners in the Clyde Basin area are greatly thanked for their cooperation during the survey. The authors are grateful to Dr Jo Wragg and Dr Kate Royse (BGS) and two international reviewers for their comments on the text. This paper is published with the permission of the Executive Director of the British Geological Survey. BGS/NERC reference: PRP17/058.