Introduction
The basic meaning of the Greek word ψυχή/psyche is life in the sense of ‘breath of life’ or soul derived from ψύχω (breath, blow). The relationship between breath and mind is also central to the spiritual beliefs in several Asian countries, in which respiration is seen as origin and essence of life and soul, named for example atman, prana, lung and qi. Considering the emphasis many cultures put on the role of respiration for human life not solely in terms of survival, but also with respect to mental processes, the obvious question arises, whether there actually is a biological connection between respiration and mental processes.
Only recently, research has begun to focus on this. So far, a small number of studies with healthy individuals have demonstrated an influence of emotion induction on what we summarizing term respiration pattern variability (RPV). For example, Rainville et al. found a significant increase of the standard deviation of the respiration period during sadness induction (Rainville et al. Reference Rainville, Bechara, Naqvi and Damasio2006). Vlemincx et al. report an increase of respiration variability during negative and highly arousing emotions (Vlemincx et al. Reference Vlemincx, Van Diest and Van Den Bergh2015). In another study, they observed a more variable and less flexible respiration pattern during worry induction compared with a mindfulness condition (Vlemincx et al. Reference Vlemincx, Vigo, Vansteenwegen, Van Den Bergh and Van Diest2013).
The connection between altered respiration and mood has also been investigated in patients with respiratory disorders such as chronic obstructive pulmonary disease (COPD) and asthma. In particular, respiratory disorders are often associated with expiratory problems which have an impact on the respiration regularity during exercise (O'Donnell et al. Reference O'donnell, Guenette, Maltais and Webb2012), but also during rest (Catterall et al. Reference Catterall, Douglas, Calverley, Brash, Brezinova and Shapiro1982). In a sample of more than 1000 patients with COPD, 72% reported elevated depressive symptoms, 38% suffered from a clinical depression (Kunik et al. Reference Kunik, Roundy, Veazey, Souchek, Richardson and Wray2005). Another study also found increased prevalence of depressive symptoms among patients with COPD, asthma and asthmatic bronchitis (44–67%), and revealed an association between psychopathology and severity of pulmonary obstruction (Asnaashari et al. Reference Asnaashari, Talaei and Haghigh2012). Interestingly, the prevalence of depressive symptoms in chronic respiratory diseases is strikingly higher compared with patients with other chronic diseases such as type-II diabetes (18%; Ali et al. Reference Ali, Stone, Peters, Davies and Khunti2006) or during the first year after a myocardial infarction (25%; Spijkerman et al. Reference Spijkerman, De Jonge, Van Den Brink, Jansen, May and Crijns2005). These findings suggest a close connection between respiration irregularity and sad mood. In addition, trainings for COPD patients aiming at respiratory rehabilitation have been proposed to result in improvements of depressive symptoms (Fan & Meek, Reference Fan and Meek2014), potentially not only via an overall increase in well-being.
Given the influence of negative emotions and related cognitions, particularly sadness and worry on respiration variability in healthy individuals, we would assume that depression as a disease often characterized by chronic sadness is associated with increased variability of respiration patterns, too. Research on the connection between respiratory diseases and depression, substantiates this hypothesis. However, so far there is no research on the relation between RPV and depression. We not only expect increased RPV in depression, but also that interindividual differences in RPV might be related to alterations in connectivity as observed in depressed patients, particularly with an increased default mode network (DMN) connectivity (Kaiser et al. Reference Kaiser, Andrews-Hanna, Wager and Pizzagalli2015).
It is well established that brain network connectivity measured with functional magnetic resonance imaging (fMRI) in general, and particularly DMN connectivity is related not only to neural and mental, but also to physiological processes such as respiration (Birn et al. Reference Birn, Diamond, Smith and Bandettini2006), heart rate (Chang et al. Reference Chang, Cunningham and Glover2009) and heart rate variability (HRV) (Chang et al. Reference Chang, Metzger, Glover, Duyn, Heinze and Walter2013). At the same time, there is clear evidence that the covariation of the blood oxygenation level dependent contrast cannot be exclusively attributed to physiological noise but is still observable after correcting for physiological artefacts (Birn, Reference Birn2012). Furthermore, there is increasing evidence for a large overlap between networks identified by functional covariations and structurally defined brain networks (Marrelec et al. Reference Marrelec, Messe, Giron and Rudrauf2016), which excludes the interpretation of large-scale brain networks as exclusively reflecting physiological noise. Alterations of resting state networks have been observed in different mental disorders (Greicius, Reference Greicius2008; Woodward & Cascio, Reference Woodward and Cascio2015). For example, we have recently shown an increase of DMN connectivity to the parahippocampal gyri in formerly depressed individuals during sad mood induction (Zamoscik et al. Reference Zamoscik, Huffziger, Ebner-Priemer, Kuehner and Kirsch2014). In this study, we used the imagination of personal negative autobiographical events to induce sad mood. Consistently, Masoaka et al. found a relation between the retrieval of autobiographical memory, respiration pattern and the activation of the right parahippocampal gyrus (Masaoka et al. Reference Masaoka, Sugiyama, Katayama, Kashiwagi and Homma2012). Several other brain regions have also been related to respiration-related processes. Recently, in mice it was found that the preBötzinger complex, a group of brainstem interneurons involved in the generation of respiration rhythms, was linked to the locus coeruleus, which may connect the respiration rhythm to functions such as arousal, attention, memory, olfactory processing and emotions (Yackle et al. Reference Yackle, Schwarz, Kam, Sorokin, Huguenard and Feldman2017). Furthermore, in humans, posterior cingulate cortex deactivation (Brannan et al. Reference Brannan, Liotti, Egan, Shade, Madden and Robillard2001) and insula activation (Evans et al. Reference Evans, Banzett, Adams, Mckay, Frackowiak and Corfield2002) have been associated with dyspnoea-related unpleasantness, whereas dyspnoea relief was related to activation in the superior and middle temporal cortices (Peiffer et al. Reference Peiffer, Costes, Herve and Garcia-Larrea2008). Even the mere anticipation of dyspnoea seems to activate brain areas involved in dyspnoea perception, and emotion-related areas such as the insula, which might reflect anticipatory unpleasantness or even fear, and boost maladaptive health behaviours in patients with respiratory abnormalities (Stoeckel et al. Reference Stoeckel, Esser, Gamer, Buchel and Von Leupoldt2016). Interestingly, the insula was also found to be related to interoceptive and bodily self-awareness and sense of body ownership (Karnath et al. Reference Karnath, Baier and Nagele2005; Tsakiris et al. Reference Tsakiris, Hesse, Boy, Haggard and Fink2007) which might also be associated with respiration patterns.
Originally, the idea for this investigation arose during scanning based on the observation that the respiration signal of remitted depressed participants showed visually detectable differences compared with healthy controls (HCs). Further literature research formed the hypothesis of altered respiration with higher variability and respiration rate (RR) in remitted participants with recurrent major depressive disorder (rMDD). The present analyses were conducted to investigate RPV and its relation to DMN connectivity in remitted depressed individuals and matched HCs. We used the data of our established paradigm of sad mood induction via personal negative life events to pose an emotional challenge in which differences in RPV can be expected. In addition, since HRV is related to respiration, reduced in depression (Kemp et al. Reference Kemp, Quintana, Gray, Felmingham, Brown and Gatt2010) and also impacts resting state connectivity (Chang et al. Reference Chang, Metzger, Glover, Duyn, Heinze and Walter2013), we tested for the relation between HRV and RPV as we expect RPV to be an important independent somatic factor. We aimed to investigate whether higher RPV during sad mood induction is associated with depression, how this effect predicts worse outcome in terms of symptom course and relapse, and whether RPV is related to alterations in DMN connectivity.
Methods
Participants
For the analyses we used two independent samples. Participants of the main sample (S1) were 30 remitted depressed participants (rMDD) with at least two previous major depressive episodes (n = 28) or a previous chronic major depressive episode of at least 2 years (n = 2), and 30 HCs, who were individually matched to the rMDD participants by age, sex and education level. All rMDD participants had to be in a state of partial or full remission, id est, did not fulfil the criteria of a major depressive episode for at least the previous two months. One rMDD currently fulfilled also criteria for agoraphobia and another participant for social phobia. Participants were recruited using online and newspaper call outs. Sample S1 initially included 64 individuals, however, four cases (two rMDD, two HC) were excluded from analyses due to altered physiological parameters (one rMDD, temporal atrophy; one HC, pituitary gland adenoma) or missing triggers in the physiology files. The second independent sample (S2) comprised 53 rMDD participants fulfilling the same inclusion criteria as S1 and having had at least two previous major depressive episodes. S2 was used to replicate our findings on RPV parameters. Two of the S2 participants fulfilled the criteria for generalized anxiety disorder and ten for partially remitted comorbid disorders: four for social phobia, four for agoraphobia, and two for specific phobias. Six cases were excluded from analyses due to altered physiological parameters (one, falx meningioma which had an impact on normalization; one, thrombosis diagnosis after inclusion; one, heterotopia of grey matter; one, white matter lesions) or missing triggers in the physiology files. For a detailed description of the samples, see Table 1.
Descriptive and psychometric variables of both samples at T1; main sample S1 additionally at follow up 3 years later (T2); independent sample S2 for replication

HC, healthy control; rMDD, remitted recurrent major depressive disorder; s.d., standard deviation; CSE, Certificate of Secondary Education, 8 years; BDI II, Beck Depression Inventory Revised, self-rated; MADRS, Montgomery and Asberg Depression Rating Scale, rated by a trained clinical psychologist; dep-score, z standardized depression sum score of the BDI II and MADRS scores; SOFAS, Social and Occupational Functioning Assessment Scale, rated by a trained clinical psychologist; MDE, major depressive episode; –, no data available (or not tested for MDE T1-T2); %, might not add to 100% as rounded values are used to display.
a χ2 test.
b Two sample t test.
c Selective serotonin reuptake inhibitor (SSRI): n = 6 (rMDD S1: 1).
Serotonin-norepinephrine reuptake inhibitor (SNRI): n = 6 (rMDD S1: 4).
Noradrenergic and specific serotonergic antidepressant (NaSSA): n = 3 (rMDD S1: 2).
Tricyclic antidepressant (TCA): n = 1 (rMDD S1: 1).
Norepinephrine dopamine reuptake inhibitor (NDRI): n = 1 (rMDD S1: 0).
Lithium: n = 2 (rMDD S1: 2).
Atypical antipsychotic medication: n = 2 (rMDD S1: 1).
Melatonin: n = 1 (rMDD S1: 0).
n = 5 participants with multiple prescriptions (rMDD S1: 3).
Exclusion criteria for all groups were bipolar and psychotic disorders, substance dependence, current substance abuse, current obsessive–compulsive, posttraumatic stress and eating disorders as well as contraindications for the fMRI (including hypertension, heart diseases and surgeries and other severe illnesses). For S2, current psychotherapy was also an exclusion criterion. Psychopathology-related in- and exclusion criteria were assessed by a trained clinical psychologist with the Structured Clinical Interview for DSM-IV axis I (SCID; Wittchen et al. Reference Wittchen, Wunderlich, Gruschwitz and Zaudig1997).
The study was approved by the local ethics committee of the University of Heidelberg and conformed to the Declaration of Helsinki. All participants gave written informed consent.
Interview, questionnaire-based and daily life measures
At baseline (T1), depressive symptoms during the previous 2 weeks were assessed with the self-rated Beck Depression Inventory II-Revised (BDI II; Beck et al. Reference Beck, Steer and Brown1996) and the Montgomery and Asberg Depression Rating Scale (MADRS; Montgomery & Asberg, Reference Montgomery and Asberg1979) rated by a clinical psychologist. The mean of z-standardized sum scores of the BDI II and MADRS was calculated and used for subsequent analyses (Huffziger et al. Reference Huffziger, Ebner-Priemer, Zamoscik, Reinhard, Kirsch and Kuehner2013).
Daily life mood was measured using ambulatory assessment (Wilhelm & Schoebi, Reference Wilhelm and Schoebi2007; Trull & Ebner-Priemer, Reference Trull and Ebner-Priemer2013), conducted over two consecutive weekdays with ten pseudorandomized assessments per day using personal digital assistants (Palm Tungsten E2, Palm Inc.). At each subjective assessment, indicated by a beep, participants rated momentary mood (Huffziger et al. Reference Huffziger, Ebner-Priemer, Zamoscik, Reinhard, Kirsch and Kuehner2013). For the present analyses, scores were aggregated per person over the 2 days.
For the main sample after 3 years (T2) a follow-up on depressive symptoms was conducted similar to the procedure at T1, measuring BDI II and MADRS to calculate the depression score T2. In addition, a further SCID interview, particularly to gather information on possible relapses, and the Social and Occupational Functioning Assessment Scale (SOFAS; Morosini et al. Reference Morosini, Magliano, Brambilla, Ugolini and Pioli2000) was assessed by a clinical psychologist. Six participants dropped out between T1 and T2 (one rMDD, five HC).
Analyses of RPV
Respiration was measured during MRI at a sampling rate of 50 Hz using a respiration belt (PMU Wireless Physio Control, Siemens Healthineers, Erlangen, Germany) around the upper abdomen below the chest and analysed with in-house MATLAB scripts (The MathWorks Inc., Natick, USA). Data, representing respiration as a change in amplitude over the time course of the experiment, were smoothed using a 50th order one-dimensional median filter, and normalized to mean 0 with variance 1000.
The typical RR for a healthy adult would be one respiration every 4–5 s (0.2–0.25 Hz). Therefore, to not miss any respirations, we took record of all maximum peaks with a minimal distance of 70 samples, corresponding to one respiration every 1.4 s, which had to have a minimal peak prominence of one-third of the total data variance to count as a respiration. Additionally, we identified all minimal turning points, which protruded with at least 1/100 of the total data variance, which are used for pause detection.
For our analysis, we determined for each subject a set of respiration parameters, related to the concepts of expirations, pause duration (PD) between expiration and inspiration and respiration frequency. The expiration was defined as starting at each maximum peak and ending at the lowest local minimum before the next maximum peak. Correspondingly, inspiration was defined as the time between the lowest minimum and the next maximum peak. Since we expected irregular respiration patterns to manifest also with abnormalities in the exhaling part of the respiration cycle, we calculated the expiration-to-inspiration time ratio.
Respiration patterns are not always as regular as a simple cosine function, and often pauses between respiration cycles occur; therefore we determined the length of pauses between inspiration cycles. For this, we calculated the slope of the respiration curve at a window size of five samples with a cut-off of 2. Clusters of minimum peaks were used to determine coarse temporal markers for a provisional pause onset, which was then recursively extended into both directions based on the slope parameters to determine pause onset and offset.
For spectral analysis, we calculated Welch's power spectral density estimate using Hamming windows with a 50% overlap to transform the data from the time to the frequency domain. We submitted respiratory time/frequency to the spectral analysis. We expected regular respiration to be reflected in a power spectrum with one dominant maximum frequency peak, whereas irregular respiration would result in a broader distribution of power over several frequency bins. To probe this, we counted the number of frequency bins with a cut-off > 10% of the maximum frequency power.
In addition, we calculated coefficient of variance (CV; standard deviation divided by mean) and autocorrelationFootnote †Footnote 1 (AR) of two respiration parameters: mean RR and mean PD. Additional parameters calculated were the maximum peak frequency of the spectral analysis and number of frequency bins above the cut-off. The maximum peak frequency can be seen as main respiration frequency, which we think is an important additional feature to describe respiration variability. To take expiration related problems into account, expiration to inspiration ratio was calculated.
Heart rate variability
We used four HRV parameters: mean size of all beat intervals (mNNI [ms]), standard deviation of all beat intervals (SDNN [ms]), percentage of consecutive beat intervals which differ more than 50 ms (pNN50 [%]) and the root mean square of the successive differences (RMSSD [ms]).
Statistics
Statistical analyses for all analyses not including fMRI were performed with IBM SPSS22 (SPSS Inc., Chicago, Illinois, USA). We conducted χ2 and two sample t tests for the analyses of possible differences between samples in sample parameters (sex, age, education, BDI II T1, MADRS T1, dep-score T1 and daily life mood T1 for both rMDD samples compared with HC; dep-score T2 and SOFAS T2 for rMDD S1 compared with HC only). We calculated ANCOVAS (covariates sex and age) and correlations for the analyses of differences in RPV [RR, RR AR, RR CV, PD, PD AR, PD CV, expiration to inspiration ratio (EIR), the maximum peak frequency and the number of frequency bins above threshold] and HRV (mNNI, SDNN, pNN50 and RMSSD) parameters between rMDD S1 and HC. In addition, we conducted the analyses regarding RPV parameters for the comparison of both rMDD samples to get an impression of the validity of the results of S1 in an independent rMDD sample. The maximum peak frequency, the only parameter which differed significantly between both rMDD groups, was then post hoc tested to see whether it is also different between rMDD S2 and HC. For prediction of outcome (T2 depression score, T2 SOFAS, relapse between T1 and T2) we used regression analyses. To include baseline depression scores in the longitudinal analyses, stepwise regressions with T1 depression score and T2 depression score/T2 SOFAS were applied. For relapse prediction stepwise logistic regression analyses with T1 depression score and relapse using maximum-likelihood estimation and Wald and Hosmer–Lemeshow tests were conducted. Effect sizes were calculated with G*Power 3.1.2 (Faul et al. Reference Faul, Erdfelder, Lang and Buchner2007).
fMRI session
The fMRI experiment was conducted using scanner built-in goggles and the Presentation software package (version 18.1; www.neurobs.com) for stimulus presentation. Scanning was carried out within two weeks after the SCID interview and the ambulatory assessment. The complete experimental procedure comprised six phases of 4.5 min each: two resting states, two sad mood inductions, one rumination phase and one distraction phase (the order of the rumination and distraction phases was counterbalanced across participants). In this paper, we reanalysed the fMRI data of our previous study with a new research question. A more detailed description of the study design can be found in Zamoscik et al. (Reference Zamoscik, Huffziger, Ebner-Priemer, Kuehner and Kirsch2014). In the present analyses, we focus on the first sad mood induction phase, as we expected sad mood induction via personal negative life events to pose a greater emotional challenge for rMDD, and the first sad mood induction phase is not influenced by other phases. Sad mood was induced with three negative life events, which were individually assessed for every participant immediately before the fMRI session started (for example: breakup Nina, death granny, cellar asylum, New Year's Eve 2010), and were later presented consecutively in the scanner via a keyword (each for 1.5 min). In parallel, participants listened to instrumental background music (parts of Adagio in g-minor by Albinoni). Mood was assessed by the Positive and Negative Affect Scale (PANAS; Watson et al. Reference Watson, Clark and Tellegen1988) before and after the sad mood induction and at the end of the experiment. None of the participants fell asleep during the session.
FMRI data acquisition and analyses
6 × 180 T2* weighted EPI images (TR = 1.5 s, α = 80°, TE = 28 ms, using parallel imaging with GRAPPA with iPAT = 2) with 24 slices (slice thickness 4 mm, voxel size 3 × 3 × 4 mm3, FOV 192 mm2) were recorded with a 3 T Trio Tim Scanner with a 12-channel head coil (Siemens Healthineers, Erlangen, Germany). Further, we collected high-resolution three-dimensional T1 weighted anatomical images (MPRAGE; TR = 2.3 s, α = 9°, TE = 3.03 ms) with 192 slices (slice thickness 1 mm, voxel size 1 × 1 × 1 mm3, FOV 256 mm2). In addition, heart rate and RR were sampled at 50 Hz with the scanner built-in equipment (PMU Wireless Physio Control, Siemens Healthineers, Erlangen, Germany). The first 20 images of each phase were discarded. Data were corrected for physiological artefacts using the Aztec software tool (van Buuren et al. Reference Van Buuren, Gladwin, Zandbelt, Van Den Heuvel, Ramsey and Kahn2009) including a high-pass filter of 1/512 Hz. Importantly, this correction removes direct first-order effects of respiration and heartbeat from the fMRI time series. Detrimental effects of small head movements were corrected by wavelet despiking using the BrainWavelet toolbox (Patel et al. Reference Patel, Kundu, Rubinov, Jones, Vertes, Ersche, Suckling and Bullmore2014). Preprocessing included segmentation of the MPRAGE and registration to the SPM8 TPM templates, coregistration of the functional images to the individual MPRAGE, motion correction, slice time correction (13th slice as reference), normalization of the functional images with normalization parameters derived during MPRAGE segmentation, and smoothing with a 9 mm Gaussian kernel. fMRI preprocessing and statistics were conducted with SPM8 v5236 (Wellcome Trust Centre for Neuroimaging, University College London, UK). Seed region for first level functional connectivity analyses was the posterior cingulate cortex (PCC; 10 mm sphere around MNI coordinates −7, −45, 24) as the main posterior part of the DMN (Berman et al. Reference Berman, Peltier, Nee, Kross, Deldin and Jonides2011). The first-level general linear models included the seed region time course, six movement parameters, cerebrospinal fluid and white matter signals and a constant. PCC connectivity maps were then used as input for the second-level analyses. To test for the relationship of respiration parameters with PCC connectivity we conducted independent regression analyses within each group for parameters that showed at least a medium effect size of the difference between HC and rMDD and was related to clinical parameters. The second-level general linear models included the respective respiration regressor, age and sex as covariates, and a constant. Additionally, we tested for group differences in the relationship between individual respiration parameters and PCC connectivity by a moderated multiple regression approach (Jaccard & Turrisi, Reference Jaccard and Turrisi2003). In other words, a moderated multiple regression analysis was used to test for the group × respiration parameters’ interaction effects on PCC connectivity. These models included the respective respiration parameter, group dummy variables for each group, interaction terms between group and respiration, age and sex as covariates, and a constant. To assess group differences, contrasts between the interaction terms were applied and tested for significance. In all imaging analyses, we used either a whole-brain threshold of p < 0.05, family-wise error (FWE) corr., or, when this threshold was not reached, an region of interest (ROI) analysis in the parahippocampal gyri, which we found in our previous analysis of the sample to be relevant during sad mood induction in depression (Zamoscik et al. Reference Zamoscik, Huffziger, Ebner-Priemer, Kuehner and Kirsch2014) and which was recently replicated (Renner et al. Reference Renner, Siep, Arntz, Van De Ven, Peeters and Quaedflieg2017).
Results
Respiration pattern variability
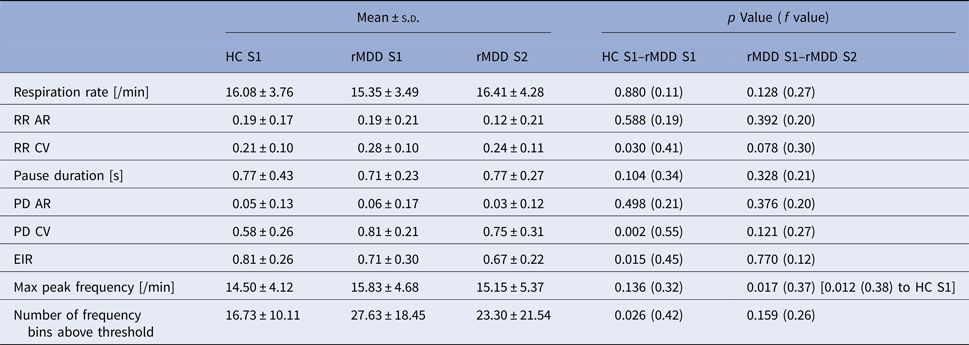
Healthy controls and formerly depressed individuals differed significantly in their respiration patterns with remitted depressed participants showing higher variability in respiration patterns, with higher variability in PD and respiration frequency and lower expiration to inspiration time ratio (see Table 2 and more details in the text below). To provide an impression of these altered patterns, Fig. 1 displays exemplary respiration time courses and corresponding frequency analyses from one HC (upper panel) and one rMDD participant (lower panel).
Exemplary four minutes respiration recordings (left) and corresponding Welch's power spectral density estimates (right) during sad mood induction of a healthy (upper panel, A + C) and a remitted depressed individual (lower panel, B + D); recordings normalized to mean 0 with variance 1000; *: maximum peak frequency, line: threshold 10% of the maximum frequency power.

Respiration parameters during sad mood induction in both samples with statistics from ANCOVAs (covariates sex and age)

HC, healthy control; rMDD, remitted recurrent major depressive disorder; s.d., standard deviation; AR, autocorrelation; CV, coefficient of variance; RR, respiration rate; PD, pause duration; EIR, expiration to inspiration time ratio.
HC and rMDD differed significantly in several RPV parameters with higher variance of the respiratory PD in rMDD showing the largest effect size. Also the variance of the RR was higher in rMDD. In addition, rMDD showed more frequency bins above threshold which can also be seen as a higher variability in the respiration pattern compared with controls. Lower EIR in rMDD points to an expiration-related alteration. When correcting for all nine conducted tests relating to the same question, the Bonferroni-corrected new p threshold would be 0.006. Thus, only differences in PD CV would survive this new strictly corrected threshold.
Between the two rMDD groups, only the maximum peak frequency differed significantly. When correcting for those nine conducted tests the Bonferroni corrected new p threshold would be 0.006 and no test would be significant. The maximum peak frequency differed significantly between S2 rMDD compared with S1 HC. Importantly, RPV parameters were not significantly related to sad mood after sad mood induction (see the Supplemental Material). For additional details, see Table 2.
To reduce the number of executed tests, further analyses were conducted only on those RPV parameters which showed at least a medium effect size for the difference between HC and rMDD (RR CV, PD CV, EIR, the maximum peak frequency and the number of frequency bins above threshold).
RPV related to HRV
In HCs, none of the RPV parameters were correlated with HRV parameters. In formerly depressed participants, RR CV and PD CV were negatively correlated with SDNN (r = −0.47, p = 0.009; r = −0.42, p = 0.021) and EIR was negatively correlated with mNNI (r = −0.38, p = 0.037) and with RMSSD (r = −0.39, p = 0.033). None of these tests are significant after Bonferroni correction for 40 tests (new p threshold 0.001).
RPV related to mood parameters and prediction of 3 years outcome
In HCs, higher maximum peak frequency was associated with lower daily life mood (r = −0.37, p = 0.045). In rMDD, higher RR CV and PD CV were associated with higher depression scores (RR CV: r = 0.36, p = 0.048; PD CV: r = 0.50, p = 0.005) and with lower daily life mood (RR CV: r = −0.43, p = 0.020; PD CV: r = −0.44, p = 0.017, Fig. 2). When correcting for those twenty conducted tests the Bonferroni corrected new p threshold would be 0.003, and thus below the obtained p values.
Higher respiratory pause duration coefficient of variance (CV) in relation to lower daily life mood (rated on a scale from 0/not at all to 6/very much, higher values indicate better mood; two consecutive weekdays with ten assessments per day, scores aggregated over both days) in remitted depressed participants (rMDD, dashed line) and matched healthy controls (HC, solid line).

Furthermore, RPV parameters predicted outcome 3 years later. In rMDD, T2 depression scores were predicted by T1 PD CV (F = 10.76; R 2 = 0.41, B = 2.62, s.e. = 0.62, p < 0.001; T1 depression scores excluded in stepwise regression). Higher T1 EIR predicted higher T2 SOFAS scores in HC (F = 5.32; R 2 = 0.20, B = 10.51, s.e. = 4.56, p = 0.031; T1 depression scores excluded in stepwise regression), whereas in rMDD higher T2 SOFAS scores were predicted by lower T1 PD CV (F = 5.38; R 2 = 0.18, B = −28.17, s.e. = 12.15, p = 0.029; T1 depression scores excluded in stepwise regression). Relapse of rMDD between T1 and T2 was predicted by T1 RR CV (χ2 = 5.23; Nagelkerke R 2 = 0.23, B = 9.69, s.e. = 4.86, p = 0.046; Hosmer–Lemeshow test p = 0.362; T1 depression scores excluded in stepwise regression). When correcting for those 25 conducted tests the Bonferroni corrected new p threshold would be 0.002, so the prediction of T2 depression scores in rMDD based on T1 PD CV remains significant with Bonferroni correction.
The pattern of results stayed the same after excluding all participants with current medication with only small changes in p values (and effect sizes) presumably due to smaller sample size (see online Supplemental Material). Only lower rMDD T2 depression scores and higher T2 SOFAS scores were not predicted by lower T1 PD CV (p = 0.180; p = 0.214) in the reduced sample, which might be an effect of reduced variance in T2 scores after exclusion of medicated participants.
For fMRI analyses we used only those RPV parameters showing associations with mood parameters or outcome prediction (RR CV, PD CV, EIR, maximum peak frequency).
RPV related to DMN connectivity
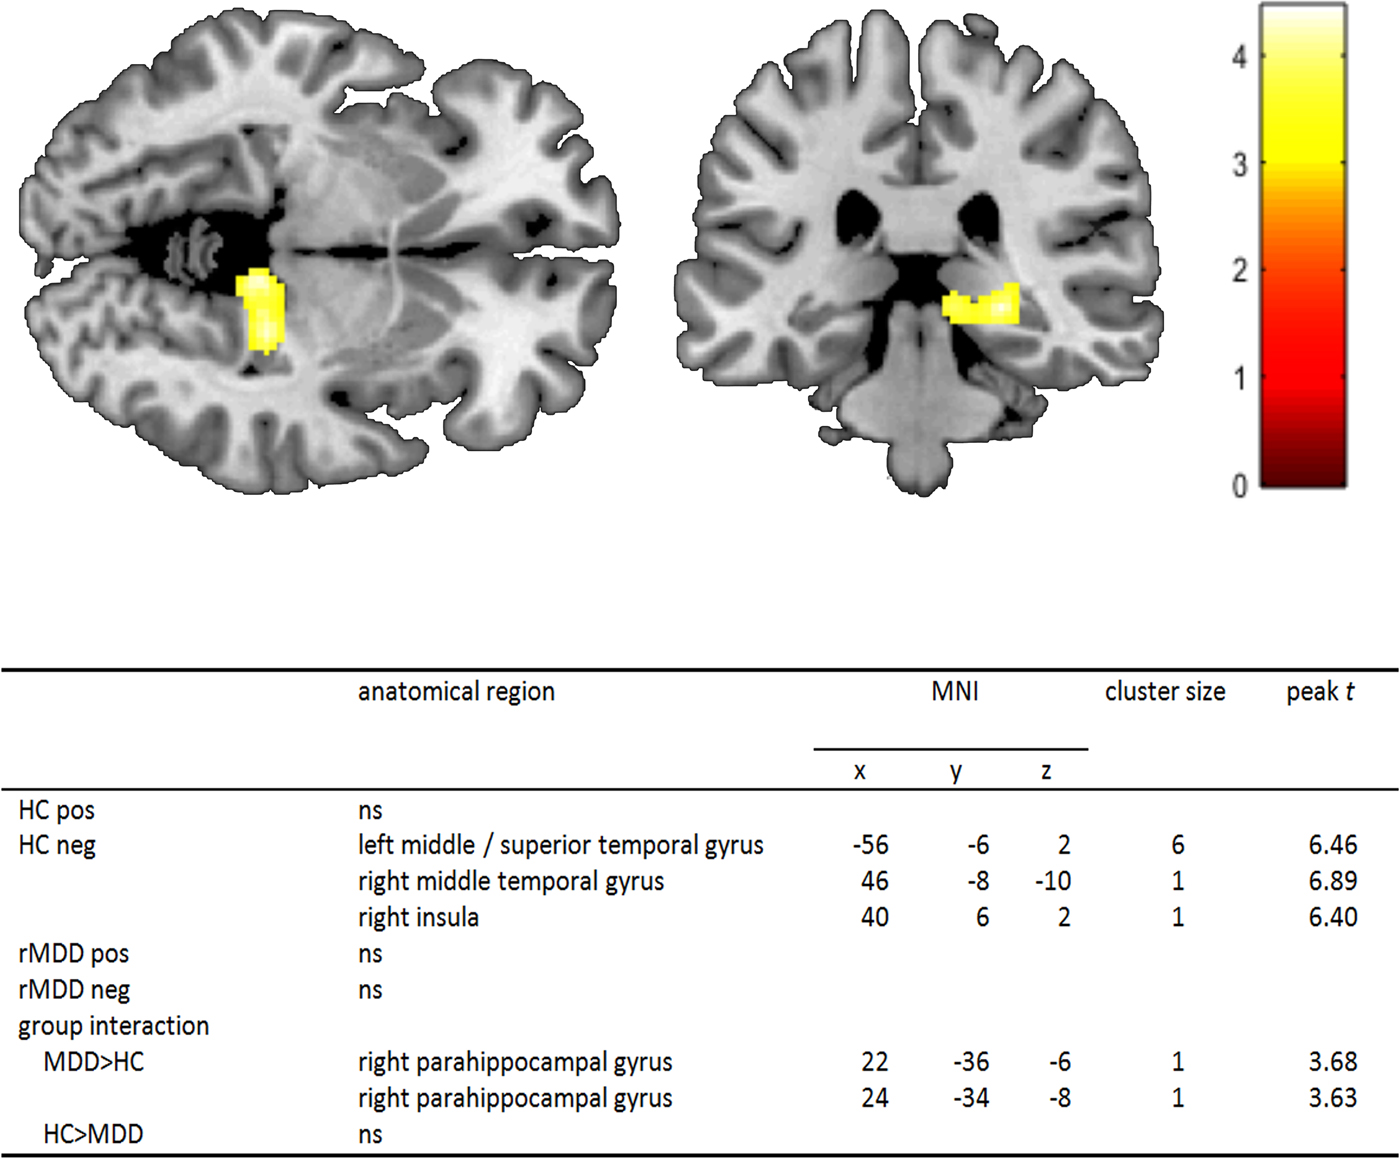
A whole-brain significant effect at a threshold of p < 0.05 FWE corrected was found for the maximum peak frequency in HC. Lower maximum peak frequency was associated with significantly increased connectivity of the PCC to the right insula, the right middle temporal gyrus as well as the left middle/superior temporal gyrus. No significant cluster was found in rMDD. To test for significant group differences in the association between the maximum peak frequency and PCC connectivity (i.e. the group × peak frequency interaction effect on connectivity) we applied a moderated multiple regression model. ROI analysis in the parahippocampal gyrus revealed right PCC – parahippocampal gyrus connectivity being significantly higher with greater maximum peak frequency in rMDD. At an exploratory threshold of p < 0.001unc., this cluster consisted of 269 voxels and was divided into two peaks (peak t 1 = 4.45 and peak t 2 = 4.27), with the second being located within the hippocampus (Fig. 3). As we did not have a hypothesis for this region, we did not test this with an ROI analysis.
Higher association of PCC – right parahippocampal gyrus connectivity with maximum peak respiration frequency during the sad mood induction phase in the depression group (rMDD, n = 30) contrasted to the control group (HC, n = 30). For display purposes only: whole-brain main effect p unc.<0.001, k = 10 voxels, bar indicates t-values; table comprises corrected statistics for relationship of maximum peak respiration frequency to PCC connectivity p < 0.05 FWE corrected, group interaction ROI analyses p < 0.05 FWE corrected, ns: no significant clusters.

The pattern of the fMRI results also stayed the same when including medication as a covariate, as well as when excluding all medicated participants (see online Supplemental Material).
Discussion
To study the relation between RPV during sad mood induction, depression and their neural underpinnings, we investigated a sample of remitted depressed individuals (rMDD) together with a matched sample of HCs in regard to RPV, different clinical parameters such as depression scores and daily life mood, and alterations in DMN connectivity with fMRI. We further assessed an independent replication sample of rMDD individuals with respect to their RPV patterns.
Our results suggest an association between RPV, mood and depression on the behavioural but also on a neural level in HC and to a greater extent in rMDD. Further, the results show that RPV parameters may even be used to predict depressive symptoms, global functioning and relapse over periods as long as 3 years.
Healthy and formerly depressed individuals showed clearly different respiration patterns. Especially respiratory expiration PD and EIR exhibited prominent differences between the groups. Both could be an indicator that rMDD show maladaptive expiration behaviour. It seems that the altered respiration pattern consists amongst other things of an incomplete expiration part of the respiration cycle and shorter expiration pauses. The importance of the expiration phase during sad mood induction for emotional well-being is also reflected by the fact that in HC, EIR predicted global functioning after 3 years. Therefore, it can be concluded that RPV is also an important factor in healthy populations.
The maximum peak frequency might be seen as main RR in relation to other frequencies, which derived from frequency analyses. Higher main respiration frequency in rMDD might hint to higher emotional strain in those participants during sad mood induction. The finding that higher main respiration frequency was also associated with lower daily life mood in HC is consistent with this interpretation as one might experience lower daily life mood with more negative emotional challenge. Furthermore, the higher number of bins above threshold in frequency analyses gives an additional hint to more irregular respiration behaviour in rMDD, as it indicates a tendency away from one dominant breathing frequency towards a more widespread distribution of breathing frequencies, i.e. greater variability. Higher RPV was associated with higher depression scores and lower daily life mood in rMDD. This implies that higher RPV is maladaptive and related to unpleasant outcome. These findings also conform to higher depression rates among somatic respiration disorders (Kunik et al. Reference Kunik, Roundy, Veazey, Souchek, Richardson and Wray2005; Asnaashari et al. Reference Asnaashari, Talaei and Haghigh2012).
The second, independent rMDD sample showed similar RPV parameters compared with the other rMDD group. Only the maximum peak frequency was significantly lower. Importantly, it was still significantly higher than in the HC group. In combination with the depression scores and other respiration and symptom-related scores, these results indicate that the second rMDD group might be, in clinical terms, an intermediate group between the healthy group and the rMDD group from our first study. Therefore, we conclude that RPV parameter results could be replicated in the independent second sample.
Another informative aspect of the present study is the possible relation of the respiration pattern and HRV. Higher HRV is seen as adaptive and healthy, whereas lower HRV is related to depression and sad mood (Hamilton & Alloy, Reference Hamilton and Alloy2016). One important HRV parameter, the respiratory sinus arrhythmia, is related to respiration. It reflects the increase of the heart rate during inspiration and its decrease during expiration as an expression of parasympathetic activity. Two studies on healthy participants used controlled breathing tasks to investigate the influence of inspiratory/expiratory time ratio on HRV. Whereas one study found larger respiratory sinus arrhythmia in trials with short inspiration and long expiration compared with trials with long inspiration and short expiration (Strauss-Blasche et al. Reference Strauss-Blasche, Moser, Voica, Mcleod, Klammer and Marktl2000), the other study found no association between respiration patterns and HRV parameters (Klintworth et al. Reference Klintworth, Ajtay, Paljunite, Szabados and Hejjel2012). Interestingly, altered respiratory sinus arrhythmia was found to be related to relapse in adolescents with depression (Kovacs et al. Reference Kovacs, Yaroslavsky, Rottenberg, George, Kiss and Halas2016) which might hint at respiration-related factors being a vulnerability mechanism in depression. As we found only few associations between RPV and HRV in rMDD and none in HC, we assume that RPV represents a different aspect than HRV does. Furthermore, our results show that in those cases in which HRV was related to RPV in rMDD, the parameters were negatively correlated. This completely fits the hypothesis as we consider high RPV maladaptive and related to worse outcome.
Remarkably, RPV parameters predicted clinical outcomes 3 years later. PD CV in rMDD explained 41% of the variance of the depression scores 3 years later. The predictive value of PD CV was even higher than that of baseline depression scores. In addition, PD CV could predict global functioning in rMDD and the expiration to inspiration ratio predicted global functioning in HC. Further, RR CV, which was predictive for relapse in rMDD, was not related to the number of depressive episodes (r = 0.08, p = 0.695). These results suggest that respiration behaviour during sad mood induction represents a phenotype that may not only be related to the present emotional state but also to the general ability of the individual to cope with critical life events. Therefore, increased RPV could be a vulnerability factor for major depressive episodes as it was proposed for adverse cognitive styles like rumination (Figueroa et al. Reference Figueroa, Ruhe, Koeter, Spinhoven, Van Der Does and Bockting2015). The role of RPV as a vulnerability mechanism is also supported by the fact that not only in rMDD but also in HC daily life function and well-being seems to be related to RPV. Therefore, respiration might be an important target in future interventions or prevention programmes.
Of note, PCC connectivity to several brain regions was significantly associated with respiration parameters even after correction of the fMRI time series for physiological effects. This highlights the importance of RPV also on a neural level. Our analyses in the HC identified the insula and the temporal gyri to be significantly more strongly connected to the PCC with lower maximum peak frequency. These brain areas have been described to be involved in interoceptive awareness, bodily self-awareness and sense of body ownership and might further be related to unpleasant feelings during respiration (Karnath et al. Reference Karnath, Baier and Nagele2005; Tsakiris et al. Reference Tsakiris, Hesse, Boy, Haggard and Fink2007; Stoeckel et al. Reference Stoeckel, Esser, Gamer, Buchel and Von Leupoldt2016). However, the insula was also found activated during passive listening to music (Brown et al. Reference Brown, Martinez and Parsons2004) and therefore different respiration while listening to atmospheric music could be related to this finding as well. As we identified a cluster located more in the posterior part of the insula, our finding might be more related to bodily-self-awareness and body ownership as these concepts were found to be related to the posterior insula (Karnath et al. Reference Karnath, Baier and Nagele2005; Tsakiris et al. Reference Tsakiris, Hesse, Boy, Haggard and Fink2007). Furthermore, the more positive association of main respiration frequency with connectivity of the PCC to the parahippocampal gyrus in rMDD compared with HC adds to our previous findings of a neural ‘scar’ of higher PCC – parahippocampal connectivity in the same sample (Zamoscik et al. Reference Zamoscik, Huffziger, Ebner-Priemer, Kuehner and Kirsch2014) and further suggests that such connectivity might be maladaptive and related to worse outcome in depression. Therefore, it can be assumed that RPV may also be indicative of neural processes during the experience of sad mood, which are both related to the course of the disorder.
A limitation of the study is that not all results from the respiration analyses remain significant after correction for multiple testing with the strict Bonferroni correction. However, due to the exploratory nature of the study, we think it is justified to report all differences. In addition, we restricted subsequent analyses to those variables showing at least a medium effect size and relations to our variables of interest. Finally, it is encouraging that for those analyses where the effects survived Bonferroni correction, the same variable PD CV was found, emphasizing its reliability.
The fMRI analyses are based on a reanalysis of the data in Zamoscik et al. (Reference Zamoscik, Huffziger, Ebner-Priemer, Kuehner and Kirsch2014), with a few more subjects included and an updated SPM8 processing pipeline. We had to choose this data set for our analyses because the follow-up study did not include HC participants, and thus a comparison between groups would not have been possible. However, the analysis targets a completely different research question, which is complementary to the results reported in Zamoscik et al. (Reference Zamoscik, Huffziger, Ebner-Priemer, Kuehner and Kirsch2014) and thus does not lead to circular reasoning. Here, we used an interaction analysis to additionally test whether the relationship of the formerly identified phenotype with respiration parameters differed between the groups. It is also important to note that we used a relatively large anatomical mask of the parahippocampal gyri rather than a functional mask for regional analyses, which minimizes double-dipping. In addition, Renner et al. (Reference Renner, Siep, Arntz, Van De Ven, Peeters and Quaedflieg2017) found similar effects in the parahippocampal gyri which can be seen as replication of our findings in 2014 and emphasizes the use of the parahippocampal gyri as ROI. A potential source of artefacts are cerebrospinal fluid pulsations (Strik et al. Reference Strik, Klose, Erb, Strik and Grodd2002), which are known to be related to respiration (Yamada et al. Reference Yamada, Miyazaki, Yamashita, Ouyang, Yui and Nakahashi2013; Yildiz et al. Reference Yildiz, Thyagaraj, Jin, Zhong, Heidari Pahlavian and Martin2017). We corrected the data for physiological signals prior to connectivity analyses and used the CSF signal as a nuisance variable in all first level analyses, but it is unclear whether this adequately controls for the putative effect of CSF pulsations. In the future, it will be an important task to better understand the relevance of such artefacts in fMRI analyses and how they are best controlled for.
Further, we did not check for depressive episodes in relatives of our control group participants. This would be interesting to check in future studies as higher risk HCs might show slightly altered breathing as well, which would hint towards a genetic contribution on respiration patterns. In the current analyses, however, assuming a linear relationship possibly included higher risk HC would reduce our effects rather than accentuating them. A further limitation of the present analyses is that they are based on data acquired with a simple setup with only one respiration belt that prohibited including, e.g. variations in respiratory volume which would make it also easier to find pauses more accurately. However, already this limited setup provided sufficient information to detect the reported associations. Future directions should include two respiration belts to allow a more complete look on RPV. In addition, it would be very informative to also apply the present paradigm to a sample of acutely depressed participants. We expect those to have even higher variability in respiration patterns compared with remitted individuals, presumably already during a resting state, whereas remitted individuals might ‘need’ triggers like emotional challenge to show the reported alterations in respiration. Our results emphasize the use of respiration based interventions as an additional tool in the treatment of depression and maybe also other stress-related disorders.
Supplementary material
The supplementary material for this article can be found at https://doi.org/10.1017/S0033291717003890
Acknowledgements
This work was supported by the German Research Foundation/DFG (P.K., grant number KI 576/12-1/2), (C.K., grant number KU 1464/4-1/2); and the Federal Ministry of Education and Research/BMBF (P.K., grant number 01EA1605).
Declaration of Interest
None.
Ethical standards
The authors assert that all procedures contributing to this work comply with the ethical standards of the relevant national and institutional committees on human experimentation and with the Helsinki Declaration of 1975, as revised in 2008.