





Dietary patterns are linked to numerous diseases, particularly non-communicable diseases such as CVD, diabetes and obesity, which are increasingly prevalent globally(Reference Popkin1). However, accurately measuring dietary consumption remains a significant challenge and is considered one of the most complex methodological issues in nutritional epidemiological studies(Reference Gibson, Ferrucci and Tangrea2). Several subjective and objective methods are used to assess food consumption. The duplicate diet method is an example of an objective approach, while subjective methods include the 24-h dietary recall (24HR), dietary record, dietary history and FFQ, all of which evaluate an individual’s consumption. Data are typically collected through self-report or with the assistance of a trained interviewer(Reference Shim, Oh and Kim3).
The FFQ is designed to assess the typical frequency of food item or food category consumption over a specified period. Originally, it was created to provide detailed qualitative information about typical food consumption patterns(Reference Gibson4). The FFQ can assess habitual food intake, reducing variability between individuals and from day to day. Additionally, it is cost-effective and can capture long-term eating habits. While the FFQ has inherent measurement errors, it is still a valuable tool for large-scale studies(Reference Cade, Thompson and Burley5).
The method has evolved into a semi-quantitative approach, incorporating portion-size estimates and the use of more advanced computerised self-administered questionnaires. This allows for the calculation of energy and nutrient intakes(Reference Gibson4). The semi-quantitative FFQ (SFFQ) has gained significant popularity and is widely used in nutritional assessments(Reference Macedo-Ojeda, Vizmanos-Lamotte and Márquez-Sandoval6–Reference Shahar, Shai and Vardi9). For example, the European Prospective Investigation into Cancer and Nutrition (EPIC) study employed country-specific SFFQ containing 130–300 food items to assess individuals’ typical food consumption(Reference Margetts and Pietinen10,Reference Bingham, Welch and McTaggart11) . Shorter versions of the questionnaire, with only sixty food items, are also available and can be completed in less time(Reference Block, Hartman and Naughton12). In Australia, a set of online-validated SFFQ consisting of 120 items, known as the Australian Eating Surveys, has been developed(Reference Williams13).
When developing a new tool for dietary assessment, particularly a new FFQ, it is crucial to conduct methodological research to evaluate the tool’s accuracy and consistency. Validation studies for FFQ are essential, as an FFQ with low validity could provide erroneous dietary information, undermining the accuracy and reliability of diet-disease relationships(Reference Cade, Thompson and Burley5). Therefore, it is necessary to validate any newly designed, modified or adapted FFQ in the specific population it is intended for(Reference Cade, Burley and Warm14). The FFQ is typically validated against reference methods such as a weighted dietary record, estimated dietary record and 24HR(Reference Cade, Thompson and Burley5).
Food-based dietary guidelines aim to synthesise a large body of research on the relationships between diet, food and health into recommendations that are actionable, culturally relevant and precise. These guidelines seek to influence consumer behaviour and, in some countries, serve as the foundation for national food, nutrition and health policies and initiatives(Reference Herforth, Arimond and Álvarez-Sánchez15). Food preferences vary across nations and cultures, which is why national dietary guidelines often serve as the basis for FFQ that are specifically tailored to local contexts. In this regard, FFQ have been developed based on dietary guidelines in various countries(Reference Henriksen, Knudsen and Hjartåker16,Reference De Rijk, Slotegraaf and Brouwer-Brolsma17) .
In this study, we aimed to develop and validate a SFFQ for assessing the dietary intake of Turkish adults. A distinctive feature of this study is the development of the SFFQ based on the recommended portion sizes for food groups for adults, as outlined in the Türkiye Dietary Guideline(18).
Methods
Participants and study design
This study was conducted with participants aged 19–64 years living in Ankara, the capital city of Türkiye, between October 2022 and September 2023. In order to determine the sample size, the analysis was performed by taking alpha (α) = 0·05, power (1 – β) = 0·95 via the G*Power 3 software programme. The number of samples determined as a result of the analysis was 400.
Participants were recruited through digital announcements on social media platforms and professional networks. Interested individuals were screened for eligibility based on the study’s inclusion criteria. A snowball sampling strategy was employed, where initial participants recruited via digital channels encouraged others within their social circles to participate in the physical interview sessions to allow for a broad reach through digital recruitment while maintaining the rigorous oversight of in-person data collection. Participants between the ages of 19–64 years were included in this study. The exclusion criteria for this study were (1) being pregnant or breastfeeding, (2) having a chronic disease (taking medication also) and (3) daily energy intake of <500 and >3500 kcal for women(Reference Willett19) and <800 and >4200 kcal for men(Reference Willett19).
The research was conducted according to the ethical principles of the Declaration of Helsinki. The study was approved by the Ethical Committee of Gazi University (19.04.2022, Decision no: 2022-514). In addition, participants signed a consent form stating that they participated voluntarily.
Socio-demographic characteristics and anthropometric measurements
The participants’ socio-demographic characteristics included age, education level and marital status via the survey form prepared by the researchers. Among the anthropometric measurements, height and body weight were taken and evaluated. Participants’ body weight measurements were taken using a Tanita BC 532 brand device, and height measurements were taken using a Leicester brand stadiometer. The evaluation of the obtained BMI values was made according to the BMI classification of the WHO. Accordingly, BMI < 18·5 kg/m2 was considered underweight, 18·5–24·99 kg/m2 was considered normal, 25–29·99 kg/m2 was considered pre-obesity and >30·0 kg/m2 was considered obesity(20).
Study protocol
First, an SFFQ based on the Türkiye Dietary Guideline (TDG-SFFQ) form was created using the Türkiye Dietary Guideline (TUBER). Afterwards, the survey form was administered via a face-to-face interview method to determine the socio-demographic characteristics of the participants. In addition, anthropometric measurements (body weight and height) of the participants were taken. In order to analyse the validity of the TDG-SFFQ form, 420 people were reached, and both TDG-SFFQ and 24HR (with a standardised photographic food catalogue to minimise portion-size estimation errors utilised during the interviews)(Reference Rakıcıoğlu, Tek and Ayaz21) were applied simultaneously to these people. To evaluate its reliability, on the other hand, TDG-SFFQ was re-administered to fifty-six people selected via a random number table from 420 people 4 weeks later using the test-retest method. The research steps are summarised in Figure 1.
Research steps. TDG-SFFQ, semi-quantitative FFQ based on the Türkiye Dietary Guidelines; SFFQ, semi-quantitative FFQ; 24HR, 24-h dietary recall.

Development of semi-quantitative FFQ
TUBER, which was prepared by taking into account the findings of national nutrition and health research in Türkiye, is a guide for the society’s adequate and balanced nutrition(22). In this study, a TDG-SFFQ form was created using the portion sizes of food groups recommended for adults (19–64 years) in TUBER. As in other TDG-SFFQ, the recommended medium portion sizes of each food were specified in the survey. Half and less of these medium portion sizes were considered small, and 1·5 times and more were considered large portions. For example, considering the 1 cup (240 mL) measurement, which is one portion for cow’s milk, those consuming ≤120 mL were considered small portions, and those consuming ≥360 mL were considered large portions.
Nine possible frequency options were created to question the frequency of individuals’ consumption of the specified foods during the previous month. These options can be listed as follows: never or less than once a month, once a month, 2–3 times a month, once a week, 2 times a week, 3–4 times a week, 5–6 times a week, once a day, twice a day and more(Reference Akpınar and Köksal23). A total of 120 types of food were grouped into seven: (1) milk and dairy products; (2) meat, chicken, fish, egg, legume, oilseeds and nuts; (3) bread and cereals; (4) vegetables; (5) fruits; and (6) oils; sugary foods and (7) beverages.
Dietary intake
Daily intake value was calculated using portion size and frequency for each food included in the TDG-SFFQ. Nutrition Information System (BeBis) 9.0 programme was used to evaluate the average energy and nutrient intake values of the consumed foods obtained from both TDG-SFFQ and 24HR.
Statistical analysis
All statistical data were analysed using IBM SPSS 22.0 (The Statistical Package for Social Sciences-SPSS Inc.). The frequencies (%), mean values and sd were calculated to present socio-demographic profiles and anthropometric measurements of the participants. The suitability of the data for normal distribution was examined with all of the Kolmogorov–Smirnov, skewness and kurtosis values. In the study, Pearson correlation coefficient (r), Bland–Altman limits (lower limit-upper limit), Bland–Altman significance value (p) and Independent-samples t test were used to test the compatibility of FFQ and 24HR. The strength of the linear relationship between variables was assessed using Pearson’s correlation coefficient (r). Correlation strength was classified as negligible (0·00–0·10), weak (0·10–0·39), moderate (0·40–0·69), strong (0·70–0·89) and very strong (0·90–1·00)(Reference Schober, Boer and Schwarte24).
The Bland–Altman method is widely used to evaluate the compatibility between the two measurement methods. It is expected that 95 % of the paired differences between the measurements made with the two methods will be between the mean minus 1·96 sd and the mean plus 1·96 sd limit values(Reference Lu, Zhong and Liu25). In order to assess reliability, the intraclass correlation coefficient (ICC) was calculated after the test-retest application.
Results
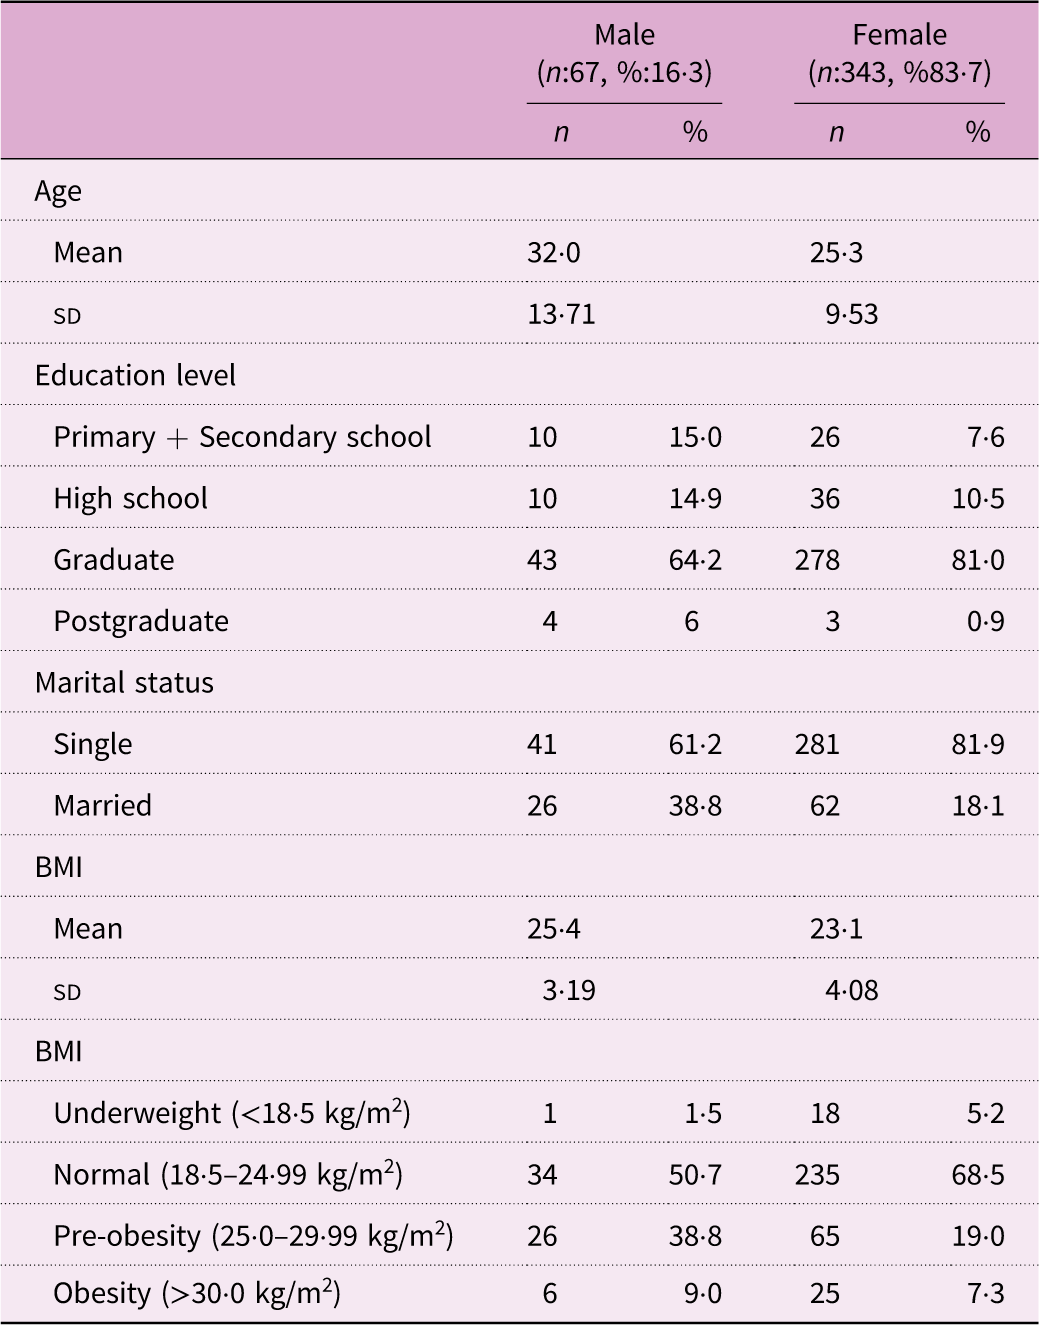
Table 1 shows the demographic characteristics and anthropometric measurements of the individuals participating in the study (n 420). The sample consists of 16·3 % males and 83·7 % females. The mean age of males is 32·0 ± 13·71, while the mean age of females is 25·3 ± 9·53, indicating that the population primarily consists of young adults. It was found that 81·0 % of females and 64·2 % of males have a bachelor’s degree, and more than half of the study population is single. The majority of males (50·7 %) and females (68·5 %) fall within the normal BMI range.
Distribution of participants’ demographic characteristics and anthropometric measurements

Table 1. Long description
A table comparing demographic characteristics and anthropometric measurements of male and female participants. The table has 11 rows and 6 columns. Column headers are Age, Education level, Marital status, and BMI. Row labels include Mean, SD, Primary + Secondary school, High school, Graduate, Postgraduate, Single, Married, Underweight, Normal, Pre-obesity, and Obesity. Row 1: Age, Mean, 32.0, 25.3; Row 2: Age, SD, 13.71, 9.53; Row 3: Education level, Primary + Secondary school, 10, 15.0, 26, 7.6; Row 4: Education level, High school, 10, 14.9, 36, 10.5; Row 5: Education level, Graduate, 43, 64.2, 278, 81.0; Row 6: Education level, Postgraduate, 4, 6, 3, 0.9; Row 7: Marital status, Single, 41, 61.2, 281, 81.9; Row 8: Marital status, Married, 26, 38.8, 62, 18.1; Row 9: BMI, Mean, 25.4, 23.1; Row 10: BMI, SD, 3.19, 4.08; Row 11: BMI, Underweight (<18.5 kg/m^2), 1, 1.5, 18, 5.2; Row 12: BMI, Normal (18.5-24.99 kg/m^2), 34, 50.7, 235, 68.5; Row 13: BMI, Pre-obesity (25.0-29.99 kg/m^2), 26, 38.8, 65, 19.0; Row 14: BMI, Obesity (>30.0 kg/m^2), 6, 9.0, 25, 7.3.
Table 2 presents the validity statistics of the TDG-SFFQ, compared with the 24HR components. The mean daily total energy and nutrient intakes obtained from the TDG-SFFQ were higher than those from the 24HR method, with the exception of fat (g), MUFA (g), PUFA (g), B12 (µg), vitamin E (mg) and Se (µg). The agreement between the two methods was assessed, and energy per kilogram (kcal/kg) showed a high level of agreement (r = 0·711). Daily total energy (kcal), carbohydrates (g), protein (g), protein per kilogram (g), fat (g), MUFA (g), thiamine (mg), phosphorus (mg) and Zn (mg) exhibited moderate agreement between the two methods (0·40 < r < 0·69). SFA (g), PUFA (g), fibre (g), soluble fibre (g), insoluble fibre (g), vitamin E (mg), riboflavin (mg), niacin (mg), vitamin B6 (mg), Ca (mg), Mg (mg) and Fe (mg) showed weak correlations (0·20 < r < 0·39). Folate (µg), vitamin C (mg) and Se (µg) had negligible correlations (0·00 < r < 0·19), and there was no correlation for vitamin A (µg) and vitamin B12 (µg) (p > 0·05).
The validity and reliability statistics of TDG-SFFQ according to the 24HR components

Table 2. Long description
A table comparing nutrient intake measured by 24-hour recall and semi-quantitative food frequency questionnaire. The table has 30 rows and 12 columns. Columns are variables, 24HR mean, 24HR standard deviation, TDG-SFFQ mean, TDG-SFFQ standard deviation, Pearson’s correlation coefficient, p-value, Bland-Altman’s analyses mean difference, Bland-Altman’s analyses upper limit, Bland-Altman’s analyses lower limit, and intraclass correlation coefficient. Variables include energy, energy per kilogram, carbohydrate, protein, protein per kilogram, fat, saturated fatty acids, monounsaturated fatty acids, polyunsaturated fatty acids, fiber, soluble fiber, insoluble fiber, vitamins, minerals, and others. The table shows Pearson’s correlation coefficients ranging from 0.213 to 0.711, with most p-values less than 0.001. Bland-Altman’s analyses show varying mean differences and limits. Intraclass correlation coefficients range from 0.666 to 0.949.
TDG-SFFQ, semi-quantitative FFQ based on the Türkiye Dietary Guidelines; 24HR, 24-h dietary recall; ICC, intraclass correlation coefficient; d, mean difference, * p > 0·05.
Additionally, Bland–Altman analyses were conducted to assess the concordance between the two methods for energy and nutrients. These analyses revealed that 95 % of the data fell within the limits of agreement (Figures 2–4). Graphically, the scatter plots for energy (kcal), energy per kilogram (kcal/kg), protein (g), SFA (g), MUFA (g), PUFA (g), vitamin E (mg), phosphorus (mg), Fe (mg) and Zn (mg) were diffuse, while the scatter plots for other nutrients were concentrated around the mean.
Bland–Altman graphs of energy and macronutrients. 24HR, 24-h dietary recall; TDG-SFFQ, semi-quantitative FFQ based on the Türkiye Dietary Guidelines.

Figure 2. Long description
Panel A: Scatter plot of energy (kcal) difference (24HR-TDG-SFFQ) vs. mean energy (24HR+TDG-SFFQ/2). Panel B: Scatter plot of energy per kg (kcal/kg) difference vs. mean energy per kg. Panel C: Scatter plot of protein (g) difference vs. mean protein. Panel D: Scatter plot of protein per kg (g/kg) difference vs. mean protein per kg. Panel E: Scatter plot of carbohydrate (g) difference vs. mean carbohydrate. Panel F: Scatter plot of fat (g) difference vs. mean fat. Panel G: Scatter plot of saturated fatty acids (g) difference vs. mean saturated fatty acids. Panel H: Scatter plot of monounsaturated fatty acids (g) difference vs. mean monounsaturated fatty acids. Panel I: Scatter plot of polyunsaturated fatty acids (g) difference vs. mean polyunsaturated fatty acids. Panel J: Scatter plot of fiber (g) difference vs. mean fiber. Panel K: Scatter plot of insoluble fiber (g) difference vs. mean insoluble fiber. Each scatter plot includes data points representing individual comparisons, with axes labeled accordingly.
Bland–Altman graphs of vitamins. 24HR, 24-h dietary recall; TDG-SFFQ, semi-quantitative FFQ based on the Türkiye Dietary Guidelines.

Figure 3. Long description
Panel A: A scatter plot shows the relationship between Vitamin A (micrograms) measured by 24HR and TDG-SFFQ. The x-axis represents Vitamin A mean (24HR+TDG SFFQ)2, and the y-axis represents the difference (24HR-TDG SFFQ). Panel B: A scatter plot shows the relationship between Vitamin E (milligrams) measured by 24HR and TDG-SFFQ. The x-axis represents Vitamin E mean (24HR+TDG SFFQ)2, and the y-axis represents the difference (24HR-TDG SFFQ). Panel C: A scatter plot shows the relationship between Thiamine (milligrams) measured by 24HR and TDG-SFFQ. The x-axis represents Thiamine mean (24HR+TDG SFFQ)2, and the y-axis represents the difference (24HR-TDG SFFQ). Panel D: A scatter plot shows the relationship between Riboflavin (milligrams) measured by 24HR and TDG-SFFQ. The x-axis represents Riboflavin mean (24HR+TDG SFFQ)2, and the y-axis represents the difference (24HR-TDG SFFQ). Panel E: A scatter plot shows the relationship between Niacin (milligrams) measured by 24HR and TDG-SFFQ. The x-axis represents Niacin mean (24HR+TDG SFFQ)2, and the y-axis represents the difference (24HR-TDG SFFQ). Panel F: A scatter plot shows the relationship between Folate (micrograms) measured by 24HR and TDG-SFFQ. The x-axis represents Folate mean (24HR+TDG SFFQ)2, and the y-axis represents the difference (24HR-TDG SFFQ). Panel G: A scatter plot shows the relationship between Vitamin B12 (micrograms) measured by 24HR and TDG-SFFQ. The x-axis represents Vitamin B12 mean (24HR+TDG SFFQ)2, and the y-axis represents the difference (24HR-TDG SFFQ). Panel H: A scatter plot shows the relationship between Vitamin C (milligrams) measured by 24HR and TDG-SFFQ. The x-axis represents Vitamin C mean (24HR+TDG SFFQ)2, and the y-axis represents the difference (24HR-TDG SFFQ).
Bland–Altman graphs of minerals. 24HR, 24-h dietary recall; TDG-SFFQ, semi-quantitative FFQ based on the Türkiye Dietary Guidelines; DR, dietary record.

To evaluate the reliability of the TDG-SFFQ, a test-retest procedure was performed, showing strong correlation coefficients for energy and most nutrients (ICC > 0·826, except for Se: ICC = 0·666, indicating moderate agreement). This finding is consistent with previous literature and can be attributed to the high intra-individual day-to-day variation in Se intake. Selenium is typically concentrated in specific food groups, such as certain seafood and organ meats, which are often consumed episodically rather than daily(Reference Willett19). These results suggest that the TDG-SFFQ is a reliable method. Considering the Pearson correlation coefficients and Bland–Altman graphical analyses, the concordance between the two methods was found to be statistically moderate or higher for energy and macronutrients. The graphical analyses for micronutrients were also concentrated around the mean and within the 95 % CI. These findings indicate that the TDG-SFFQ is both valid and reliable for assessing dietary intake.
Discussion
Evaluating dietary intake accurately is a significant challenge both in clinical practice and nutritional epidemiology, especially when considering long-term dietary patterns(Reference Hébert, Hurley and Steck26). Despite the use of standardised and validated tools, errors in estimation are inevitable(Reference Thompson, Subar, Coulston, Boushey, Ferruzzi and Delahanty27). Especially in epidemiological studies, there is a need for more reliable and simple tools to establish associations between diet and chronic diseases. The SFFQ is recognised for its enhanced accuracy in assessing food and nutrient intake. It better captures individual variations in consumption amounts compared with an FFQ, which does not include portion-size questions. Apart from being accurate, SFFQ are also considered to be easy to use, practical and low cost, which makes them suitable as dietary assessment tools for cohort and population studies. In this study, we assessed the reproducibility and validity of energy and nutrient intakes measured by a new SFFQ specifically for Turkish adults. The TDG-SFFQ includes 159 food types commonly eaten in Türkiye, featuring both traditional and culturally specific dishes. Our goals were to create a detailed food questionnaire that reflects current Turkish eating habits, improve the use of recommended portion sizes and convert them into daily nutrient intake. Moreover, the use of SFFQ developed with standard portion sizes is essential for achieving accurate results, as this ensures the tool’s broader applicability and reliability.
In our study, the TDG-SFFQ’s validity was confirmed by comparing it with 24HR, showing significant correlations between the two assessment methods for energy intake, nine macronutrients and fifteen micronutrients. Similar to the findings of Athanasiadou et al.(Reference Athanasiadou, Kyrkou and Fotiou28), where Mediterranean-oriented SFFQ were validated with positive correlations ranging from 0·35 to 0·77, our study found positive correlations between the TDG-SFFQ and 24HR ranging from 0·12 (vitamin C) to 0·71 (energy per kg). These results underscore the robustness of the TDG-SFFQ, particularly for energy and macronutrient intake. Moreover, the Bland–Altman plots demonstrated a strong agreement between the SFFQ and 24HR for estimating energy and nutrient intake (Figures 2–4). Another study conducted on a large-scale group (n 500) aimed to evaluate the validation of the SFFQ in comparison with the 24HR like our study. Their findings indicated that the SFFQ is valid for assessing energy and macronutrient intake(Reference Bountziouka, Bathrellou and Giotopoulou29). In a study validating the SFFQ for the Italian population, the intake of twenty-three nutrients was assessed against 24HR and 3-d dietary records. The positive correlations ranged from 0·22 (sodium) to 0·74 (alcohol). These correlations were classified as significant and substantial (≥0·50) for seven nutrients and acceptable (0·20–0·49) for sixteen nutrients(Reference Zanini, Simonetto and Bertolotti30). Recovery biomarkers of dietary intake are considered the definitive ‘gold standard’ for validating other dietary assessment techniques. The accuracy of three dietary assessment tools – the SFFQ, 24HR and 7-d dietary records – has been assessed by comparing them with biomarkers in estimating nutrient intakes among 627 women in the Women’s Lifestyle Validation Study. They have also demonstrated that the SFFQ offer reasonably valid measurements of various energy-adjusted nutrient intakes(Reference Yuan, Spiegelman and Rimm31). While our study did not include biomarker validation, the demonstrated correlation and agreement between the TDG-SFFQ and 24HR indicates that the SFFQ can reliably estimate nutrient intake. Future research could incorporate biomarker analysis to further enhance the accuracy of our findings.
We evaluated the reproducibility of the TDG-SFFQ by comparing the daily intake of energy, macro-and micronutrients at baseline (TDG-SFFQ1) and again 4 weeks later (TDG-SFFQ2) with ICC. The reproducibility of the TDG-SFFQ measured using ICC was >0·826. Cui et al. conducted a meta-analysis on the reproducibility of SFFQ, identifying factors that influence their consistency. The pooled crude ICC ranged from 0·499 to 0·803 for macronutrients and from 0·499 to 0·723 for micronutrients(Reference Cui, Xia and Wu32). The higher reproducibility observed in our study may be attributed to the use of standardised and accurate portion sizes, which likely improved the consistency of dietary intake measurements.
Our study has several strengths. This study involved a comprehensive process undertaken to develop a detailed food list and accurately define the appropriate portion sizes and food groups, in accordance with the Türkiye Dietary Guidelines in 2022. A tool with validity and reliability will enable the evaluation of the relationship between nutrition and non-communicable diseases in our population. The development and validation of the TDG-SFFQ represent a preliminary yet essential step in assessing dietary patterns within the Turkish population. Since this initial study was specifically conducted among Turkish adults aged 19–64, the current findings and the psychometric properties of the instrument should be interpreted within this specific context.
Our study has also a few limitations. Using the 24HR as the reference method to validate SFFQ is a limitation and potential source of error, given that both TDG-SFFQ and 24HR are susceptible to similar measurement errors(Reference Yuan, Spiegelman and Rimm31). Although Cade et al. (2002)(Reference Cade, Thompson and Burley5) suggest multi-day records to capture seasonal and day-to-day variability, implementing such a protocol in a cross-sectional study with 420 individuals presented substantial logistical constraints. To minimise participant burden and ensure high response rates, a single 24HR was adopted as a feasible reference method, a trade-off acknowledged in the same literature. Furthermore, the robust sample size (n 420) helps mitigate the impact of intra-individual variation at the group level, providing a reliable basis for evaluating the TDG-SFFQ’s capacity to rank participants by their dietary intake(Reference Yuan, Spiegelman and Rimm31). Surely, future validation studies incorporating multi-day recalls across different seasons are recommended to further refine the precision and confirm the long-term reliability of the TDG-SFFQ. Additionally, the higher proportion of female participants in our sample may limit the direct generalisability of the results to the entire Turkish adult population. The literature suggests that females may be more susceptible to reporting errors (such as overestimation or underestimation) in food intake measurements due to factors such as more complex dietary structures or social desirability. Specifically, it has been reported that correlations between FFQ and reference methods (such as 24HR) can differ by sex, with higher validity coefficients sometimes obtained in males(Reference Procter-Gray, Olendzki and Kane33–Reference Liu, Yu and Xu35). Future studies with a more balanced sex distribution are recommended to confirm the TDG-SFFQ’s validity across all demographic segments.
Conclusion
In conclusion, the validated TDG-SFFQ shows potential as a useful instrument for characterising dietary intake of Turkish adults (19–64 years), provided its inherent limitations are carefully considered. It enables a thorough assessment of energy, macro-and micronutrient intake, which is crucial for epidemiological studies and public health interventions in Türkiye. Moreover, incorporating standard portion sizes into SFFQ, as seen in the TDG-SFFQ, offers a practical approach to minimising assessment variability. This methodological consistency may support more comparable dietary data across similar adult cohorts and potentially support its future exploration in wider contexts. Additionally, to ensure broader generalisability and confirm the instrument’s robustness, further validation studies across diverse age groups (e.g. children, adolescents or the elderly) and different demographic segments of the Turkish population are strictly required for this TDG-SFFQ.
Acknowledgements
There is no acknowledgement to declare.
Financial support
There is no funding or sponsorship.
Competing interests
The authors declare that they have no conflict of interest.
Authorship
Conceptualisation: Ş.A.Ş., Ş.A., M.E.Ç.D., N.E.G., E.K.
Methodology: Ş.A.Ş., Ş.A., M.E.Ç.D., N.E.G., E.K.
Data curation: Ş.A.Ş., Ş.A., M.E.Ç.D., N.E.G.
Writing – review & editing: Ş.A.Ş., Ş.A., M.E.Ç.D., N.E.G., E.K.
Supervision: E.K.
Ethical standards
This study was conducted according to the guidelines laid down in the Declaration of Helsinki and was approved by the Ethical Committee of Gazi University (19.04.2022, Decision no: 2022-514). Written informed consent was obtained from all participants. Participation in this research was entirely voluntary, and participants were informed about the study’s purpose and procedures. They were also informed that they could withdraw from the study at any time without any consequences.



 Open access

