
I. INTRODUCTION
Titanium dioxide (TiO2) has been widely used as pigments,Reference Pfaff and Reynders1 paints,Reference Harrison and Walton2 and sunscreens,Reference Salvador, Pascual-Marti, Adell, Requeni and March3 for photocatalysisReference Liu and Chen4,Reference Wen, Li, Liu, Fang, Xie and Xu5 and photocatalytic fuel generation,Reference Ma, Wang, Jia, Chen, Han and Li6 and to form efficient dye-sensitized solar cells (DSSCs).Reference O’Regan and Gratzel7 DSSCs are directly under active examination as alternatives to silicon-based photovoltaic devices for solar energy use.Reference Grätzel8,Reference Hagfeldt, Boschloo, Sun, Kloo and Pettersson9 They are thought to be a promising renewable source of nonpolluting energy as a result of their low-cost manufacturing process and high-power conversion efficiency.Reference O’Regan and Gratzel7,Reference Horiuchi, Miura, Sumioka and Uchida10 The performance of DSSCs has been based on the properties of semiconducting oxide layers.Reference Palomares, Clifford, Haque, Lutz and Durrant11,Reference Grätzel12 The coated semiconducting metal oxide layers increases the surface area which in turn increases the light harvesting. Among the different semiconductor materials used in DSSCs, nanocrystalline anatase TiO2 has been proven to be the best semiconductor photoanode material in DSSCs.Reference Serpone, Lawless and Khairutdinov13 Many efforts have been made to improve the power conversion efficiency (η) of TiO2-based DSSCs. Lots of new dye sensitizers have been designed and synthesized. Fine tuning of the conduction band (CB) edge of TiO2 positively is a feasible strategy to improve the incident photon-to-electron conversion efficiency (IPCE). To achieve a high incident IPCE on TiO2, doping of metal atoms into TiO2 semiconducting materials is commonly adopted.
In recent years, TiO2 nanoparticles (NPs) are utilized as a working electrode for DSSCs because of their most astounding proficiency than some other metal oxide semiconductors. It appears that one of the conceivable approaches to manufacture more proficient cell is improvement in charge transfer in TiO2 and the doping would be the most promising solution for that. Doped TiO2 nanocrystalline materials (NPs/films) have been seriously examined over the past decade,Reference Ling, Wang, Wheeler, Zhang and Li14–Reference Kakiage, Tokutome, Iwamoto, Kyomen and Hanaya22 and it was found that characteristics of DSSCs fabricated with doped TiO2 were strikingly better than those with immaculate TiO2. Doping of nonmetal elements like N, S, I, and BReference Ma, Akiyama, Abe and Imai23–Reference Tian, Hu, Zhang, Chen, Sheng, Mo, Liu and Dai26 in TiO2 introduces the energy states in the band gap, impacting the light absorbance and the electron transport of the TiO2. MgReference Zhang, Chen, Mo, Huang, Tian and Hu16 and SnReference Duan, Fu, Liu, Fang, Zhou and Zhang15 doping adversely change the CB position of the TiO2, so the photovoltage is effectively improved. Amongst these metal dopants, magnesium (Mg) has exhibited significant improvement in the open circuit voltages (V oc) of DSSC with Mg-doped TiO2 anodes.Reference Zhang, Chen, Mo, Huang, Tian and Hu16,Reference Kakiage, Tokutome, Iwamoto, Kyomen and Hanaya22,Reference Iwamoto, Sazanami, Inoue, Inoue, Hoshi, Shigaki, Kaneko and Maenosono27 Zhang et al.Reference Zhang, Chen, Mo, Huang, Tian and Hu16 reported a higher value of V oc for DSSC with Mg-doped TiO2 anodes than with pristine TiO2 anodes by 71 mV, due to negative shift of the CB edge in respect of undoped TiO2. However, the rate of electron injection from the dye was shown to be slower for Mg-doped TiO2 than for pure TiO2. Iwamoto et al.Reference Iwamoto, Sazanami, Inoue, Inoue, Hoshi, Shigaki, Kaneko and Maenosono27 examined Mg2+-doped nanostructure TiO2 electrodes with a higher CB position and the results obtained show that the solar cells could deliver high open circuit voltage (V oc) together with an organic dye with the highest lowest unoccupied molecular orbital. Recently, KakiageReference Kakiage, Tokutome, Iwamoto, Kyomen and Hanaya22 conveyed a V oc of 1.2 V for Mg-doped TiO2 anodes with a more positive redox potential electrolyte (+4 V) Br3−/Br− redox couple, but with a lower short circuit current density (J sc) in respect of pure TiO2 anodes. However, a lower V oc for Mg-doped TiO2 photo anodes relative to DSSCs with pure TiO2 has also been reported.Reference Liu28 Another fascinating metal dopant in TiO2 that has significantly improved J sc values in DSSC is lanthanum (La).Reference Zhang, Zhao, Wang, Yu, Guan, Yu, Li and Zou29,Reference Yahav, Rühle, Greenwald, Barad, Shalom and Zaban30 As an insulating oxide material, MgO with band gap 7.8 eVReference Tamboli, Patil, Kamat, Puri and Puri31 is significantly more extensive than anatase TiO2 (3.2 eV), which has also been utilized to improve the efficiency of TiO2-based solar cells.Reference Jung, Lee, Nastasi, Lee, Kim and Park17,Reference Kumara, Okuya, Murakami, Kaneko, Jayaweera and Tennakone18 For example, Jung et al.Reference Jung, Lee, Nastasi, Lee, Kim and Park17 found the efficiency of MgO-coated TiO2 increased by 45% as compared to the pure TiO2. Kumara et al.Reference Kumara, Okuya, Murakami, Kaneko, Jayaweera and Tennakone18 detailed that an MgO shell on TiO2 can retard the recombination of holes and back-transferred electrons, and then improve the cell efficiency. Recently, copper-doped TiO2 NPs were applied as the photoanode material in DSSCs and found that moderate doping concentration of the copper (x = 0.06) in Ti(1−x)CuxO2 constructed cell produces the energy conversion efficiency of 6.51%.Reference Manju and Joseph Jawhar32
There are many commercially available nanosized TiO2 particles and many methodsReference Chen and Mao33–Reference Challagulla and Roy36 to synthesize TiO2 nanostructures. On the other hand, not many commercial nanostructured TiO2 particles and methods are suitable for highly efficient DSSCs. The differences between the particles can be crystal structure, crystallinity, crystal size, surface structure, and the density and distribution of charge traps. These parameters influence electron diffusion coefficient (D), electron life time (τ), and charge injection efficiency, and the efficiency of DSSCs is poor. Therefore, searching for a simple and low cost method for the synthesis of pure and metal ion-doped TiO2 NPs with a good structural, optical, and electrical property is still a huge challenge to materials scientists. In particular, the solvothermal microwave irradiation (SMI) technique is an accomplished and elegant synthesis technique capable of producing inexpensive, high quality NPs with lesser crystallite sizes at industrial scale. An added benefit of the SMI technique is being able to utilize a wide range of liquid and solid precursors so that pure and either single-doped or co-doped NPs can be quickly made in one step.Reference Saravanan, Pukazhselvan and Mahadevan37,Reference Saravanan, Meena, Pukazhselvan and Mahadevan38 However, studies on the composition dependent optical and electrical properties of Mg-doped TiO2 NPs and their improved V oc and IPCE are rather sparse.
In this work, we have attempted to prepare, stress reduced pure and different concentrations (3, 6, and 9 mol%) of Mg-doped TiO2 NPs by the simple SMI technique using comparatively cheaper reactant materials without the need of any sophisticated instruments. We also investigated the properties of the Mg-doped TiO2 surface and understood how Mg doping changes surface properties. And finally, Ti(1−x) MgxO2 (x = 0.0, 0.03, 0.06, and 0.09) NPs were successfully applied as the photoanode material in DSSCs and studied their photovoltaic performance.
II. EXPERIMENTAL DETAILS
A. Materials
All the precursors used were of analytical reagent grade purity and purchased from Sigma-Aldrich (Hyderabad, India), Central Drug House (P) Ltd. (New Delhi, India), and Merck India Ltd. (Mumbai, India) without additional purification. The precursor materials used for the preparation of Mg2+-doped TiO2 NPs are titanium tetra chloride (TiCl4), magnesium nitrate hexahydrate [Mg(NO3)2·6H2O], urea (CO(NH2)2), ethylene glycol (C2H6O2), and acetone [(CH3)2CO]. Ethylene glycol (C2H6O2) was used as a solvent, whereas double distilled water and acetone ((CH3)2CO) were used to remove any unreacted reactants and unwanted organic byproducts present in the synthesized nanocrystalline materials.
B. Synthesis
Mg-doped TiO2 NPs of different concentrations (0, 3, 6, and 9 mol%) were synthesized by the SMI technique. For the synthesis of undoped TiO2, 0.1 M CO(NH2)2 was dissolved in 100 mL ethylene glycol under vigorous stirring condition for 1 h at 30 °C. Subsequently 0.1 M TiCl4 solutions were added in 100 mL ethylene glycol and stirred well at room temperature. Both the solutions were mixed slowly and stirred for another 2 h at a temperature of 50 °C to get a deep blue colored stack solution. This stack solution was transferred into a microwave safe container placed in a domestic microwave oven IFB 23BC4 23 L (IFB, Haryana, India) operated with output power 900 W and operating frequency 2.45 GHz. The microwave output power can be controlled from 0 to 900 W (10 levels, in steps of 100 W) and the temperature of this unit varied from 110 to 220 °C (10 levels). In our synthesis procedure, microwave irradiation was carried out at 300 W power in air medium about 5 min. The colloidal precipitate thus obtained was cooled to room temperature and then centrifuged at 14,000 rpm for 30 min. The resultant precipitate was washed with double distilled water and acetone to remove the unreacted precursors and organic byproducts and finally dried in a heating oven at 60 °C for 2 h. The final product was weighed accurately and collected as the yield. To prepare 3, 6, and 9 mol% Mg2+-doped TiO2 NPs, the corresponding mole% of the TiCl4 reactant was replaced by the Mg(NO3)2·6H2O precursor and the above procedure was repeated.
C. Cell fabrication and photovoltaic measurements
Fluorine-doped tin oxide glass substrates (fluorine-doped SnO2, 15–20 Ω/sq) was cleaned with surfactant and swilled with deionised water then coated with Mg2+-doped TiO2 (0, 3, 6, and 9 mol%) NP paste by the doctor-blade method.Reference Burnside, Shklover, Barbé, Comte, Arendse and Brooks39 It was then sintered at 450 °C for 30 min to form a nanostructured TiO2 electrode. The film thickness was about 10 μm measured by using thickness measuring unit model US M probe Vis spectroscopic reflectometer. After being cooled to about 90 °C, the electrodes were immersed in a dye bath containing 0.5 mM N3 {cis-Ru(H2dcbpy)2(NCS)2(H2dcbpy = 4,4′-dicarboxy-2,2′-bipyridyl)} in ethanol for 24 h. The platinized counter electrode and the dye-sensitized photoanode films were placed each other to form the test cell. The electrolyte was composed of a mixture of 0.05 M I2, 0.5 M LiI, 0.6 M 1-hexyl-3-methylimidazolium iodide in 3-methoxypropionitrile, and 0.6 M 4-tert-butylpyridine in acetonitrile. The electrolyte solution was then injected into a hole made on the counter electrode, later sealed by a glass cover and thermal adhesive film. The total active electrode area of the DSSC was about 0.25 cm2. Photocurrent density–voltage (J–V) measurement was performed by using AM 1.5 solar simulators with the incident light intensity of 100 mW/cm2 calibrated with a standard Si solar cell. The energy conversion efficiency (η) can be estimated as
 $$\eta = {{{V_{{\rm{oc}}}} \times {J_{{\rm{sc}}}} \times {\rm{FF}}} \over {{P_{{\rm{in}}}}}}\quad ,$$
where V oc is the open-circuit voltage, J sc is the integral photocurrent density, FF is the fill factor, and P in is the intensity of the incident light. The fill factor (FF) can be calculated as
 $$F = {{{V_{{\rm{mpp}}}} \times {J_{{\rm{mpp}}}}} \over {{V_{{\rm{oc}}}} \times {J_{{\rm{sc}}}}}}\quad ,$$
where V mpp and J mpp are the maximum power point voltage and maximum power point current density, respectively.
D. Instrumentation
XRD patterns were collected on an automated PANalytical X-ray powder diffractometer (Malvern PANalytical, Royston, United Kingdom) operating at 40 kV and 30 mA with monochromated Cu Kα radiation (λ = 1.54056 Å) and the scanning 2θ range from 20 to 80° to investigate the crystalline structure of undoped and Mg2+-doped TiO2 electrodes. By using the Scherrer formula, the crystallite size of each sample was calculated. Transmission electron microscopy (TEM) observation was performed with a TEM-FEI Technai G2 300 kV (FEI Company, Beijing, China) to investigate crystallite sizes, phases, and shapes of pure and Mg2+-doped samples. The composition of the materials was estimated using energy dispersive X-ray (EDX) analysis with an EDX-System OXFORD INCA Energy 200 (Oxford Instruments, Shanghai, China). The optical properties (UV-Vis spectrum in the wave length range 190–1100 nm) of pure and Mg2+-doped TiO2 films were recorded at room temperature using a SHIMADZU UV-1800 PC spectrometer (Effem Technologies, New Delhi, India) with a medium scan speed sampling interval of 1 nm. The short-circuit photocurrent density (J sc) and open-circuit photo voltage (V oc) measurements were derived with a Keithley 2611 source meter (Keithley Instruments, Inc., Karnataka, India) under a light source of AM 1.5 solar simulator (91160A, Newport Co., Bozeman, Montana) with the incident light intensity of 100 mW/cm2.
III. RESULTS AND DISCUSSION
Sections III.A–III.E deal with the results and discussion of Ti(1−x)MgxO2 (where x = 0.00, 0.03, 0.06, and 0.09) NPs and also discuss the effect of the electrode morphology in solar cell performance.
A. Structural properties
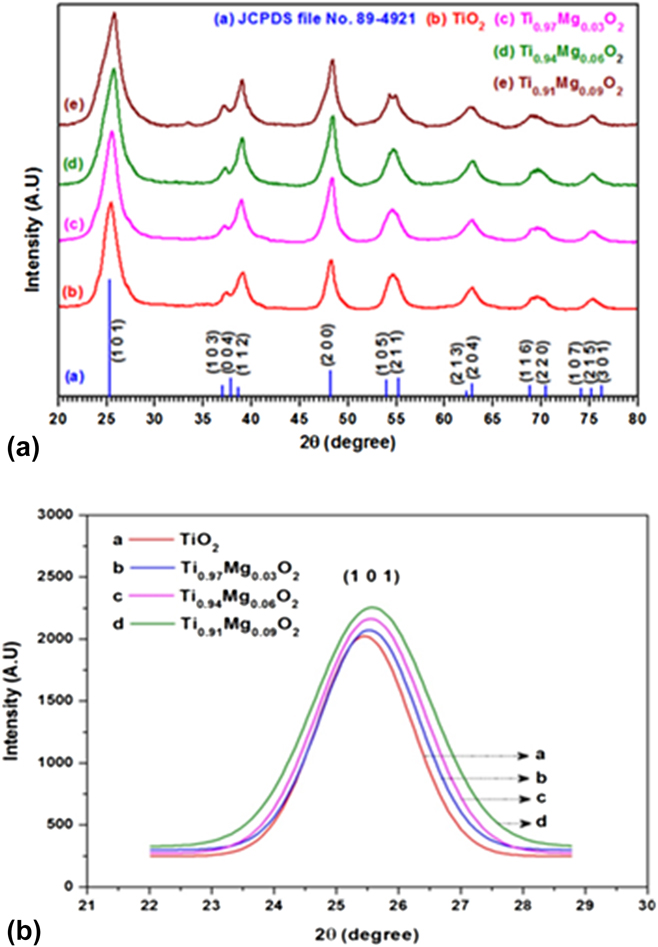
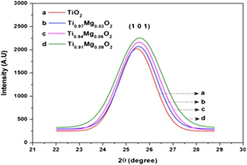
The XRD pattern analysis of pure and Mg-doped TiO2 NPs of three different concentrations (3, 6, and 9 mol%) are shown in Fig. 1(a). All peaks in the pattern show an excellent match with standard JCPDS data (JCPDS file No. 89-4921) and confirm the formations of the anatase TiO2 (tetragonal) phase with space group I41/amd. It is clear from the XRD information that there are no additional diffraction peaks comparing to Mg or its related phases, which indicates that Mg-incorporated anatase titania has invariably formed in all the compositions. The intensities of the diffraction peak in patterns for Ti(1−x)MgxO2 NPs were higher than that of pure TiO2. This behavior indicates that the addition of Mg increases the crystallinity of Ti(1−x)MgxO2 nanocrystals. The addition of Mg affects the diffraction peak intensity of the XRD spectra also the dominant peaks marginally gets expanded, the broadening of the dominant peaks likewise marginally expanded. From Fig. 1(a), we observed that the high intensity peak (1 0 1) position is slightly shifted into higher angle side with respect to dopant concentration.
(a) X-ray diffraction spectra of Ti(1−x)MgxO2 (x = 0.00, 0.03, 0.06, and 0.09) NPs. (b) Gaussian fitted peaks for the plane (1 0 1) of Ti(1−x)MgxO2 (x = 0.00, 0.03, 0.06, and 0.09) NPs.

To verify the crystallinity and peak broadening due to the incorporation of dopant, the Gaussian fitted peaks for the plane (1 0 1) are demonstrated in Fig. 1(b). It suggests that the full-width at the half-maximum (FWHM) of the most intense diffraction peak (1 0 1) of Ti(1−x)MgxO2 increases gradually with the increasing doping concentration from x = 0.0 to x = 0.09. Note that the ionic radii of Ti4+ and Mg2+ are 0.68 Å, 0.72 Å,Reference Anmadi and Fattahi40 respectively. As the radius of Ti4+ is very closer to the radius of Mg2+, Ti4+ ions in the lattice structure can be well replaced by Mg2+ ions and as the consequence, the position of the (1 0 1) peak is marginally shifted to higher angle side. More interestingly, when Mg is added into the pure TiO2 lattices, no diffraction peaks corresponding to MgO have been observed in the obtained XRD patterns. From the obtained XRD patterns of Mg-doped TiO2 NPs, we observed that the broadening and the intensity of the peaks are conspicuously changed. The increasing diffraction peak intensity of the Mg-doped samples reveals that the crystallinity of Ti(1−x)MgxO2 NPs is higher than that of pure TiO2.
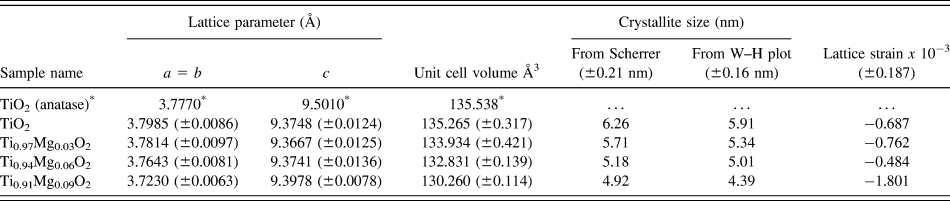
The lattice parameters were calculated by using UNITCELL program developed by Holland & Redfern (Department of Earth Science, University of Cambridge, United Kingdom)Reference Holland and Redfern41 and presented in Table I. As can be seen from Table I, irrespective of changes in ‘a’ and ‘c’ parameters with respect to dopant concentration, the overall unit cell volume of Ti(1−x)MgxO2 (x = 0.03, 0.06, and 0.09) decreases with the increasing dopant (Mg) concentration and also always less than that of TiO2 (x = 0.0). The average crystallite sizes (D) of all the synthesized nanocrystals considered in the present examination were ascertained by measuring the FWHM of the most intense diffraction peaks (1 0 1), (1 1 2), (2 0 0), (2 0 4), (1 1 6), and (2 1 5) using Debye–Scherrer equationReference Patterson42 and Williamson–Hall plots.Reference Williamson and Hall43 The average crystallite sizes of Ti(1−x)MgxO2 (x = 0.0, 0.03, 0.06, and 0.09) NPs are shown in Table I.
Calculated lattice parameters of Ti(1−x)MgxO2 (x = 0.0, 0.03, 0.06, and 0.09) NPs.

* JCPDS file no. 89-4921.
From Table I, it is visible that the crystallite size of pure and Mg-doped TiO2 NPs get reduced with the increase in dopant concentration. The W–H plot analysis also reveals that the synthesized NPs possess very less value of strain and are negative, which indicates that the lattice strain present in the prepared NPs is a compressive strain.Reference Tripathi, Mathpal, Kumar, Singh, Soler and Agarwal44 Therefore, we concluded that most of the dopant ion (Mg) replaces Ti4+ sites rather penetrates into Ti4+ positions; however, it generates distortion of the parent TiO2 structure thus the crystallinity of the Ti(1−x)MgxO2 NPs is slightly modified with the increasing concentration. In our case, the addition of dopant (Mg) in TiO2 NPs does not prompt more oxygen imperfections on the grain limit locale. Thus the lattice strains on the Ti(1−x)MgxO2 (x = 0.03, 0.06, and 0.09) NPs are high when compared with pure TiO2 (x = 0.0) NPs. This reveals that the addition of Mg2+ perfectly replaces the Ti4+ sites in the host TiO2 lattices and the dopant does not change the crystalline phase (anatase) of the parent material (TiO2).
B. TEM analysis
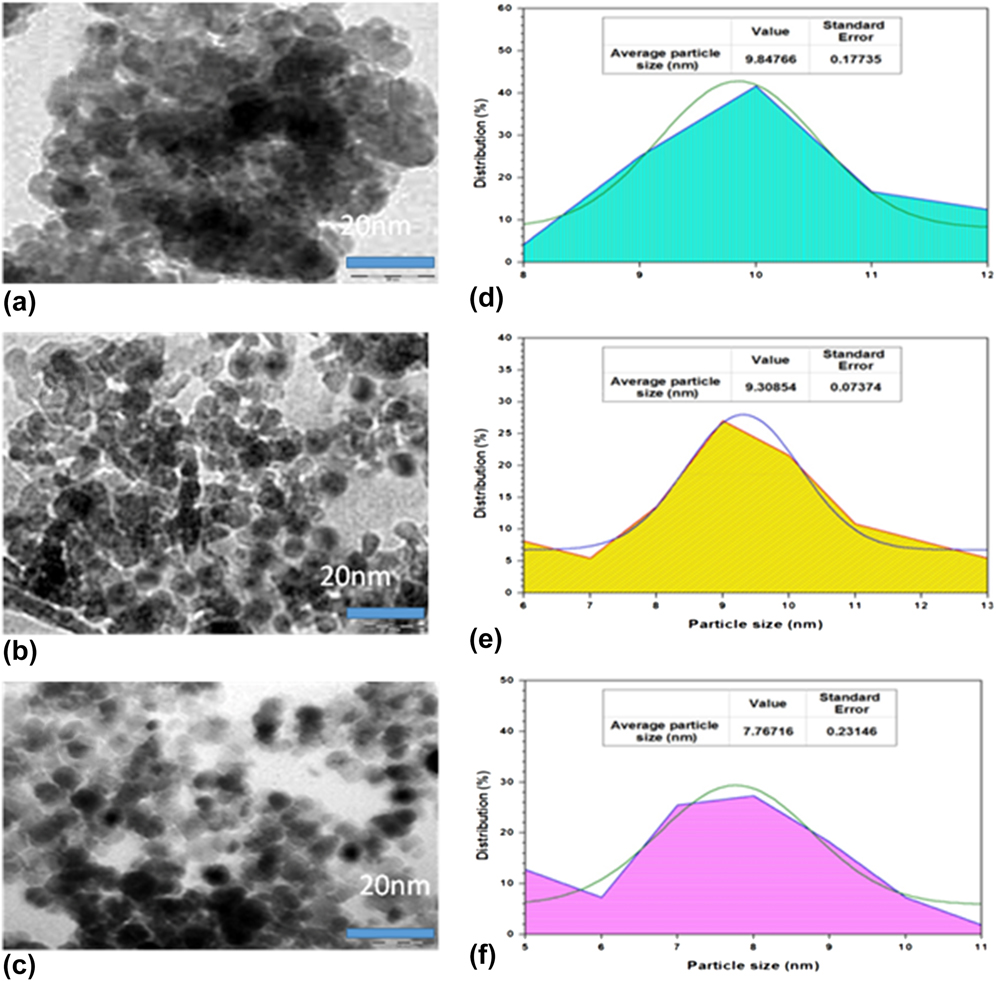
The microstructural features of the as-prepared samples were explored by the TEM study. TEM spectra were recorded for selected NP samples and the obtained spectra are shown in Figs. 2(a)–2(c). From the spectra, it reveals that the morphologies of all the NP samples considered in the present study are found to be uniformly well-dispersed and nearly spherical in nature with the diameters ranging from 4 to 20 nm. Also TEM investigations give the evidence of no segregated secondary phases of magnesium oxides and support homogeneous substitution of Mg in the titania matrix/TiO2 lattice. The observed TEM micrographs clearly showed that the average particle sizes of these spherical samples are in nanoscale concord with the XRD data calculated using Scherrer’s formula. The average particle sizes of Ti(1−x)MgxO2 (x = 0.00, 0.03, and 0.09) have been estimated from the particle size distribution percentage histogram shown in Figs. 2(d)–2(f). The obtained average particle sizes of pure TiO2, Ti0.97Mg0.03O2, and Ti0.91Mg0.09O2 NPs are 9.84 ± 0.18 nm, 9.31 ± 0.07 nm, and 7.76 ± 0.23 nm, respectively.
TEM microstructure of (a) pure TiO2 (x = 0.0), (b) Ti0.97Mg0.03O2, and (c) Ti0.91Mg0.09O2 NPs. Particle size histogram of (d) TiO2, (e) Ti0.97Mg0.03O2, and (f) Ti0.91Mg0.09O2 NPs.

C. Elemental compositional analysis
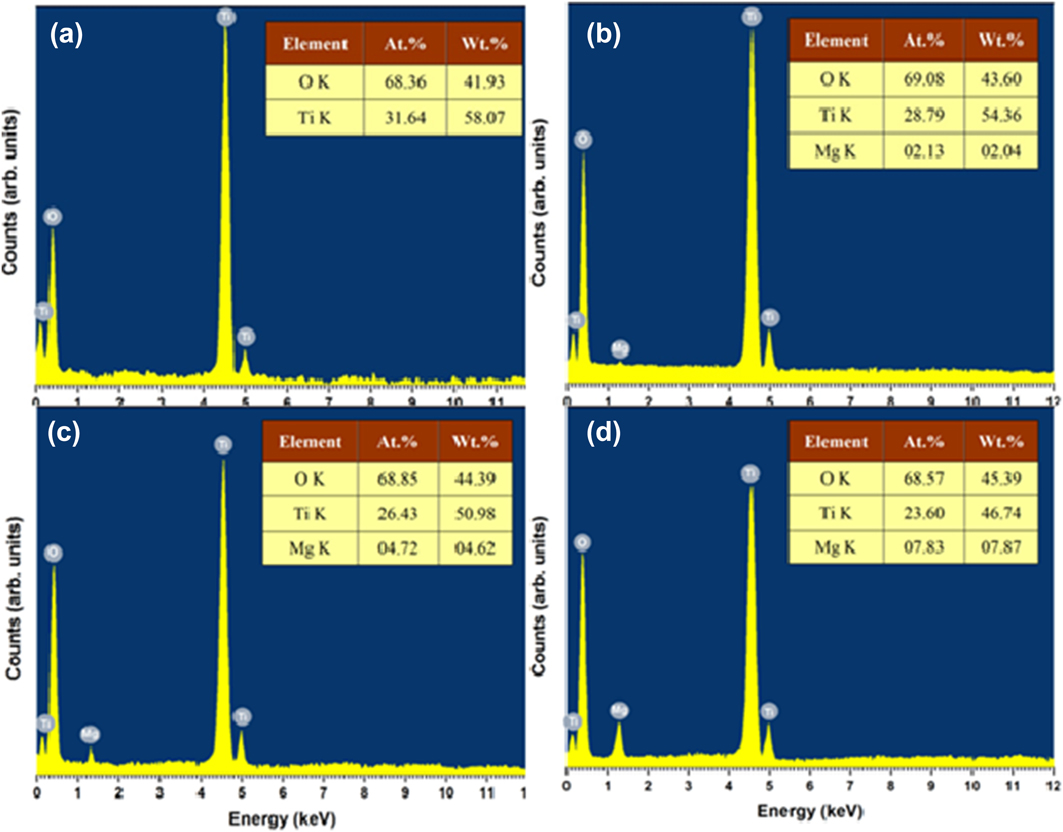
To explore the at.% and stoichiometric level, the samples of pure and doped TiO2 NPs were enlightened with EDX analysis shown in Figs. 3(a)–3(d). The result reveals the peak belonging to the Ti, Mg, and O. It is clear from the EDX analysis that increasing dopant concentration results in a systematic increase in Mg at.% and decrease in Ti percentage, which suggests that the dopant element is homogeneously distributed in substitutional sites of the anatase structure of TiO2. Also it is noticed that the atomic ratios of Ti(1−x)MgxO2 NPs are nearly same as the initial at.% taken in the solid solutions. The observed at.% of the prepared samples is given in the inset of Figs. 3(a)–3(d).
EDX diffractogram of (a) pure TiO2, (b) Ti0.97Mg0.03O2, (c) Ti0.94Mg0.06O2, and (d) Ti0.91Mg0.09O2 NPs.

D. Ultraviolet-visible near infrared spectral analysis
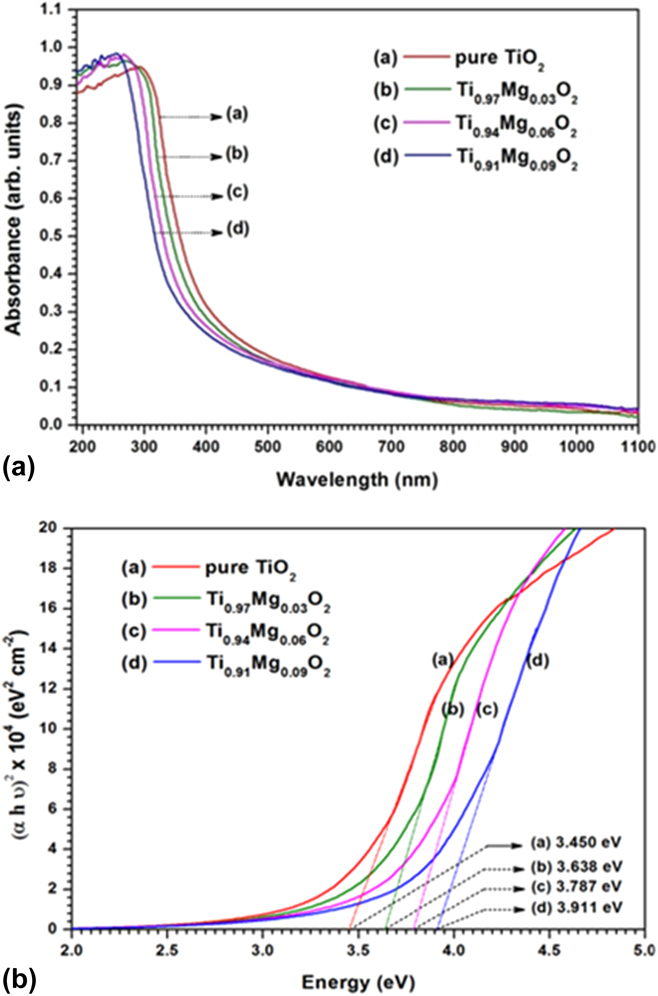
Ultraviolet-Vis absorption spectra recorded for Ti(1−x)MgxO2 (x = 0.0, 0.03, 0.06, and 0.09) NPs are shown in Fig. 4(a). The absorption coefficient of Mg-doped TiO2 NPs are lesser than that of undoped TiO2 (x = 0.0) NPs from 320 to 1100 nm. From the absorbance spectra, it is comprehended that Mg doping shifts the absorption edge from visible to UV region, i.e., the absorption onset appears blue-shifted with the increasing concentration of Mg. This might be identified with the substitution of Mg in Ti sites, which can modify the band structure,Reference Johnson45 thus the absorption edge shifted to higher photon energy (hν) for Ti(1−x)MgxO2 NPs.
(a) UV-Vis absorbance spectra of Ti(1−x)MgxO2 (x = 0.0, 0.03, 0.06, and 0.09) NPs. (b) Tauc plot of Ti(1−x)MgxO2 (x = 0.0, 0.03, 0.06, and 0.09) NPs.

The band gap (E g) of anatase phase bulk TiO2 or TiO2 NPs is commonly believed to be indirectReference Chetri, Basyach and Choudhury46–Reference Nagaveni, Hegde, Ravishankar, Subbanna and Madras49; also few reports were available for direct band gap anatase TiO2 NPs.Reference Serpone, Lawless and Khairutdinov13,Reference López and Gómez50,Reference Madhusudan Reddy, Manorama and Ramachandra Reddy51 The absorption data were analyzed and the optical energy gap was estimated using the Tauc’s relationship between the absorption coefficient (α) and the photon energy (hν).Reference Tauc, Grigorovici and Vancu52 TiO2 exhibits both direct and indirect band gaps. In the present study, we have considered direct transition only and have analyzed the changes in the band gap of Mg-doped TiO2 NPs of three different concentrations (3, 6, and 9%). The direct band gap of the semiconductor samples is usually determined by plotting (αhν)2 versus hνReference Saravanan, Meena, Pukazhselvan and Mahadevan38 and the optical band gaps (E g) were directly obtained from the point of the extrapolation of the linear part that meeting the abscissa of the Tauc plot shown in Fig. 4(b). From Fig. 4(b), it is observed that the band gap increases from 3.450 to 3.911 eV with the increasing concentration from x = 0.0 to 0.09. In our case, the observed average crystallite size of the prepared NPs for pure TiO2 (x = 0.0) and Mg-doped TiO2 is 6.26 nm and less than 10 nm, respectively. These values are much less than that of the respective bulk counterpart. Hence, the band gap energy of the TiO2 nanocrystals is always higher than that of the bulk TiO2 (3.2 eV). For most of the semiconductors, an increase in energy gap with a decrease in particle size leads to a blue shift of the optical absorption edge. Furthermore, the band gap energy value obtained in the present study for anatase TiO2 (x = 0.0) is higher than those reported in the literature. Several authors have reported the E g values from 3.16 to 3.4 eV.Reference Khan, Ansari, Pradhan, Ansari, Han, Lee and Cho53–Reference Tripathi, Singh, Mathpal, Mishra and Agarwal55
E. J–V analysis
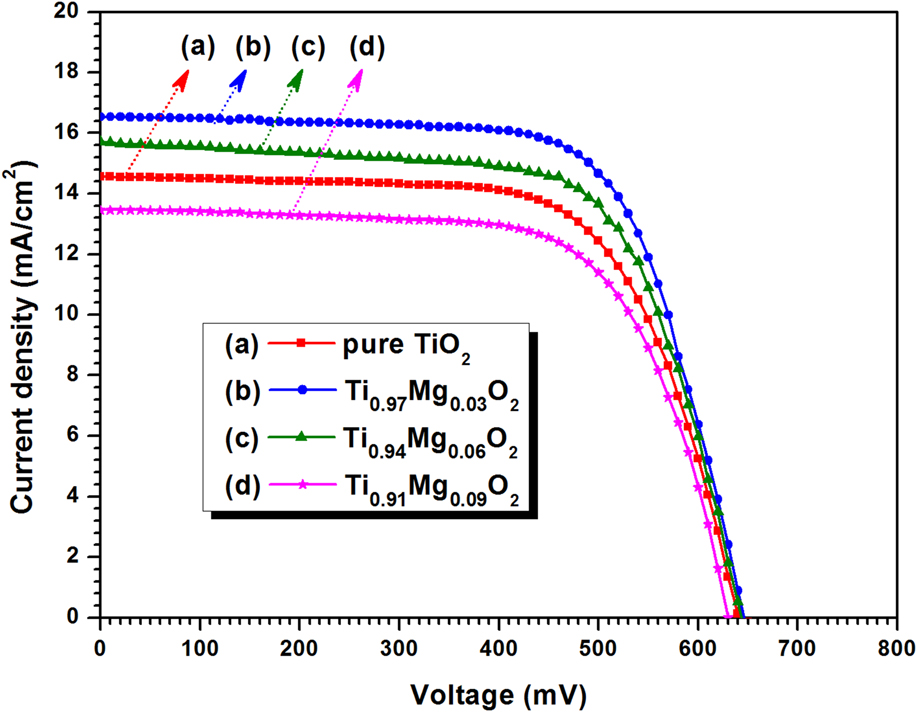
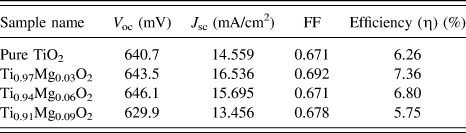
Figure 5 shows the photocurrent density (J) versus photo voltage (V) curves of Ti(1−x)MgxO2 (x = 0.00, 0.03, 0.06, and 0.09) NPs under illumination with the light intensity of 100 mW/cm2 at AM1.5. The photovoltaic parameters of open-circuit photovoltage (V oc), short-circuit photocurrent density (J sc), FF of the cell, and the overall conversion efficiency (η) are listed in Table II. It can be seen from Table II that the device constructed by using Ti0.97Mg0.03O2 NPs shows a higher value of J sc. This might be because 3 mol% concentration of dopant is high enough to improve the pore size of TiO2.Reference Gondala, Ilyas, Baiga and Fasasia56 Also it is obvious from the result that the value of short circuit current density decreases with the increase in dopant concentration and Ti0.91Mg0.09O2 NPs attain a short circuit photocurrent density of 7.5% lower than pure TiO2. This might be because the higher concentration of dopant may create defects that increase charge recombination and the electron transport proficiency therefore gets diminished quickly at high defect concentration.Reference Xie, Huang, You, Liu, Sebo and Liang57 The DSSC based on 3.0 mol% Mg-doped composite photoanode exhibited the highest photoelectric conversion efficiency of 7.36% which is enhanced by 17.6% compared with undoped TiO2 (6.26%). The enhanced value of conversion efficiency could be due to the fact that Mg2+ ions were doped into the TiO2 lattice occupied the quadivalent Ti4+ causing an excited state electron injection, although a decrease in recombination rate and increased the electrical conductivity.Reference Liu28
Comparison of the J–V characteristics of DSSCs fabricated with Ti(1−x)MgxO2 (x = 0.0, 0.03, 0.06, and 0.09) NPs.

Photovoltaic parameters of DSSCs constructed with Ti(1−x)MgxO2 (x = 0.0, 0.03, 0.06, and 0.09) NPs.

IV. CONCLUSIONS
In summary, Mg-doped TiO2 NPs of different concentrations (3, 6, and 9 mol%) were synthesized by the SMI method and investigated on their photoelectric properties. XRD results suggested that Mg-incorporated anatase titania has invariably formed in all the compositions and more importantly, there is no evidence of secondary or impurity-related peaks detected for all the doped-TiO2 samples. EDX analysis reveals that the increase in the dopant concentration increases the dopant’s at.% and decreases Ti percentage and this suggests that the doped ions may substitute into the lattice position of TiO2. The microstructural features of the as-prepared samples were further analyzed by TEM supported the result of XRD analysis. The DSSC based on a 3.0 mol% Mg-doped composite photoanode exhibits much higher photovoltaic performance. Because Mg2+ ions were doped into the TiO2 lattice they will occupy the quadivalent Ti4+, causing an excited state electron injection and thereby increased the electrical conductivity of the Mg-doped TiO2 photoelectrode.
ACKNOWLEDGMENT
The authors are cordially thankful to Dr. V.N. Praveen and Dr. Sakthi Sudar Saravanan for their helpful discussions.