Clostridium difficile is the most common microorganism associated with death in persons with gastroenteritisReference Hall, Curns, McDonald, Parashar and Lopman 1 , Reference Lessa, Mu and Bamberg 2 and the single most common organism responsible for US healthcare-associated infections.Reference Magill, Edwards and Bamberg 3 Although C. difficile infection (CDI) is clearly associated with morbidity and mortality, the incremental impact of CDI on mortality is not clear. In a 2015 review of CDI outcomes, all-cause mortality ranged from 11.8% to 38%, and attributable mortality ranged from 0% to 16.7%, depending on the time frame to assess mortality, statistical methods, and whether the investigations were conducted during endemic or epidemic periods of CDI.Reference Kwon, Olsen and Dubberke 4 A prior review of European studies found similar heterogeneity in all-cause hospital mortality (4%–37%) and CDI-attributable mortality (0%–23%).Reference Wiegand, Nathwani, Wilcox, Stephens, Shelbaya and Haider 5
Variation in all-cause and attributable CDI mortality is also likely due to differences in patient populations. Because CDI incidence and risk of complicated infection are much higher in the elderly than in younger persons,Reference Lessa, Mu and Bamberg 2 , Reference Abou Chakra, McGeer and Labbe 6 , Reference Abou Chakra, Pepin, Sirard and Valiquette 7 focus on outcomes in the elderly is important. Recently, 2 studies reported CDI mortality in the elderly using Medicare data. Drozd et alReference Drozd, Inocencio and Braithwaite 8 found 1.9% 30-day attributable mortality after hospital-onset CDI, although their analysis included younger beneficiaries (ie, end-stage renal disease, disabled). Shorr et alReference Shorr, Zilberberg, Wang, Baser and Yu 9 reported attributable CDI mortality of 14.9% at 60 days and 19.2% at 1 year in the elderly. Prior studies estimating the risk of mortality due to CDI have not considered the possibility of effect modification, in which the risk is not uniform but varies depending on other factors.Reference Rothman and Lash 10
The data on CDI-attributable morbidity are even more limited than data for mortality. Adults with CDI in a managed care plan were at higher risk of subsequent hospitalization, intensive care unit stay, and emergency department utilization than enrollees without CDI, particularly if they had recurrent CDI.Reference Kuntz, Baker and Kipnis 11 Patients with CDI have been shown to be at increased risk of short- and longer-term hospital readmission,Reference Drozd, Inocencio and Braithwaite 8 , Reference Nanwa, Kwong and Krahn 12 – Reference Barbut, Bouee, Longepierre, Goldberg, Bensoussan and Levy-Bachelot 14 and discharge to a nursing care facility after hospitalization.Reference Khanna, Gupta, Baddour and Pardi 15
We used Medicare data to better understand the impact of CDI on all-cause mortality, short-term morbidity, and long-term morbidity in the elderly. We performed 2 different analyses to estimate differential risk of outcomes in CDI compared to uninfected persons, pooled across all persons and within strata of CDI risk. We used this approach to determine whether heterogeneity in risk of poor outcomes exists because it may impact how CDI prevention efforts should be targeted.
Methods
We obtained data for CDI patients from 2010–2012 Medicare claims data for all persons coded for CDI in 2011. For control patients, we used the 2010–2012 5% random sample Medicare data, excluding persons coded for CDI in 2011. 16 Long-term care facility (LTCF) stays were identified using the 2010–2012 minimum data set (MDS), which includes standardized assessments of patients in nursing facilities that accept federal payment.Reference Intrator, Hiris, Berg, Miller and Mor 17
Eligible patients were those aged ≥66 years with complete Medicare fee-for-service enrollment during the 12 months prior to the CDI (and control) index date. Persons with no claims in 2010 and 2011 were excluded to ensure use of health benefits. Patients coded for CDI in the last quarter of 2010 were excluded to restrict the population to individuals newly diagnosed in 2011.
Index date
Patients coded for CDI (International Classification of Disease, Ninth Revision, Clinical Modification [ICD-9-CM] diagnosis code 008.45) were identified from January 1, 2011, through December 31, 2011, in the inpatient, outpatient, carrier (ie, physician), or skilled nursing facility (SNF) files. The CDI onset date was assigned as described previously,Reference Olsen, Young-Xu and Stwalley 18 and an analogous index date was randomly selected for control patients such that the distribution of index dates among control patients mirrored the distribution of CDI index dates.Reference Dubberke, Olsen and Stwalley 19 The first episode of CDI in 2011 was used for all analyses.
Outcomes
All-cause mortality within 1 year was identified using the death date in the Beneficiary Summary file. Secondary outcomes included new transfer to an LTCF, new transfer to an SNF, and 1 or more hospitalizations within 30 days, 90 days, and 1 year after the index date. New transfer to a SNF was identified using the Medicare SNF file. LTCF residence was identified using method 2 described by Goodwin et al,Reference Goodwin, Li, Zhou, Graham, Karmarkar and Ottenbacher 20 that is, using the SNF file and MDS to distinguish long-term from short-term SNF encounters.Reference Intrator, Hiris, Berg, Miller and Mor 17 , Reference Goodwin, Li, Zhou, Graham, Karmarkar and Ottenbacher 20 For new transfers to SNF and LTCF, patients were excluded if they met the definition for these encounters in the year prior to the index date.
Acute-care hospitalizations with admission date after the index date were identified using the inpatient file. For individuals hospitalized on their index date, same-day transfers to another hospital were excluded because they were not new hospitalizations. A subsequent hospitalization to treat CDI in patients diagnosed as an outpatient was considered a new hospitalization.
Covariates
Risk factors for CDI in the year prior to the index date were identified using ICD-9-CM diagnosis, Current Procedural Terminology, 4th edition, and uniform billing revenue codes. Risk factors included comorbidities, infections, and healthcare exposures, as defined previously,Reference Dubberke, Olsen and Stwalley 19 and acute noninfectious conditions and frailty indicators (Appendix Table 1). Acute noninfectious conditions included conditions expected to require hospitalization or outpatient treatment that may result in antibiotic exposure (Appendix Table 1). Frailty indicators were conditions associated with declining health (eg, decubitus ulcer, difficulty walking) (Appendix Table 1). Comorbidities were identified as recommended by Klabunde et al,Reference Klabunde, Potosky, Legler and Warren 21 whereas acute conditions required only a single code.
Statistical analysis
Descriptive statistics were performed using the χ2 and Mann–Whitney U tests. To create the propensity score, we used multivariable logistic regression with the dependent variable CDI and independent variables in Appendix Table 2. To calculate the probability of CDI at the index date, the independent variables were assessed in the year prior. The logit of the propensity score was used to match cases and controls 1:1 without replacement, using a caliper of 0.2 times the standard deviation of the logit of the propensity score.Reference Austin 22 , Reference Coca-Perraillon 23 Standardized differences for all covariates were calculated before and after matching, with values >0.1 indicating imbalance (Appendix Fig. 1).Reference Austin 24 , Reference Yang and Dalton 25
We used the McNemar test to compare mortality, LTCF, and SNF transfer, with calculation of odds ratios for matched pairs. For the LTCF analysis the population was restricted prior to matching to exclude individuals previously residing in a LTCF and individuals hospitalized at their index date who died during the hospitalization, because they would not have the opportunity for an LTCF transfer. The population was restricted similarly for the SNF analysis. Attributable risk was calculated in the matched pairs by subtraction of the percentage of controls with outcome from the percentage of CDI cases with outcome. For analysis of subsequent hospitalizations, Cox proportional hazards models were performed with a robust variance estimator to account for the matching.Reference Austin 26
For stratified analyses, the probabilities were divided into 20 strata (ie, ventiles), based on the propensity score in the CDI group to obtain approximately equal numbers of CDI cases across strata for analysis of mortality, which resulted in variable numbers of control patients per stratum. For secondary analyses, because individuals were excluded based on specific criteria, the numbers of CDI cases were no longer equal across strata. Analyses were performed using Cox proportional hazards models, with CDI the only independent variable, stratified by the propensity score ventiles. SAS version 9.4 software (SAS Institute, Cary, NC) was used for all analyses. The Washington University Human Research Protection Office approved this research with a waiver of informed consent.
Results
The population of fee-for-service Medicare beneficiaries aged 66 and older included 1,510,046 persons. Of these, 16,605 were excluded due to CDI diagnosed in the last quarter of 2010, resulting in a final population of 1,493,441 persons for analysis: 174,903 coded for CDI and 1,318,538 control patients. Extrapolation to the entire 2011 fee-for-service Medicare population with at least 1 healthcare claim in 2010–2011 resulted in a comparison population of ~26.4 million and an estimated CDI incidence of 663 per 100,000 elderly persons.
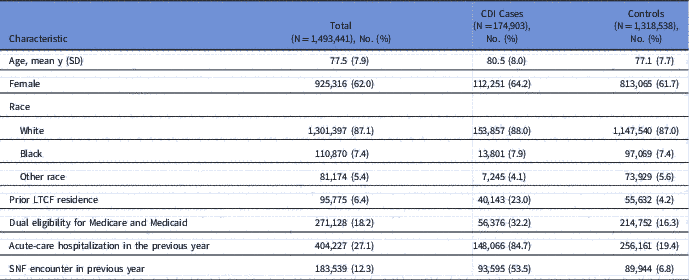
The mean age of the study population was 77.5 years; 925,316 patients (62.0%) were women; and 1,301,397 patients (87.1%) were white (Table 1). Also, 271,128 patients (18.2%) had dual eligibility in Medicare and Medicaid, indicative of low socioeconomic status. Residence in an LTCF prior to the index date was identified in 95,775 (6.4%), and 404,227 (27.1%) had been hospitalized at least once in the prior year.
Demographics and Other Characteristics of the Medicare Elderly Population

Note. LTCF, long-term care facility; SNF, skilled-nursing facility.
A total of 169,073 patients (11.3%) died within 1 year of the CDI (control) index date. The all-cause mortality rates were 40.9% among CDI patients and 7.4% for control patients. Of the persons eligible for new LTCF and SNF, 23,700 of 1,381,830 (1.72%) became residents in an LTCF (7.39% of CDI and 1.17% of control patients) and 119,780 of 1,429,750 (8.38%) entered an SNF (37.52% of CDI and 5.48% of control patients) within 1 year. Of the patients who newly entered an LTCF, 5,598 (23.6%) were also resident in an SNF before transitioning to the LTCF. Of patients newly resident in an LTCF, 23% died within 1 year of the CDI (control) onset date; of patients newly resident in an SNF, 33.4% died within 1 year. The population eligible for subsequent hospitalization(s) included individuals whose CDI or control index dates occurred as outpatients, or for those hospitalized at their index date, those patients who were alive at hospital discharge (n=1,474,999). At least 1 hospitalization within 30, 90, and 365 days after the index date occurred in 76,691 patients (23.21% of CDI and 3.03% of control patients) within 30 days after the index date, in 162,022 patients (39.91% of CDI and 7.50% of control patients) within 90 days, and in 369,931 patients (58.93% of CDI and 21.00% of control patients) within 1 year.
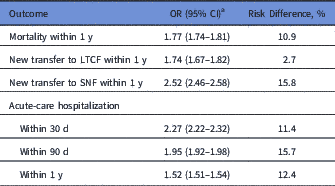
CDI was associated with a 1.77-fold increased risk of 30-day all-cause mortality (95% confidence interval [CI], 1.74–1.81) in the propensity-score matched pairs analysis, and attributable mortality risk of 10.9% (Table 2 and Appendix Table 3). In secondary analyses, CDI was associated with a 1.74-fold increased risk of new LTCF transfer (95% CI, 1.67–1.82; attributable risk, 2.7%) and a 2.52-fold increased risk of new SNF entry (95% CI, 2.46–2.58; attributable risk, 15.8%) within 30 days (Table 2). Matching was successful in 128,406 of 174,903 of the CDI cases (73.4%). The standardized differences and distribution of propensity scores are shown in Appendix Figures 1 and 2. Unmatched CDI cases were older and had higher frequencies of virtually all risk factors, consistent with the propensity score distribution for CDI cases (Appendix Table 2 and Figure 2).
Outcomes Attributable to CDI in Propensity Score-Matched Pairs Analyses in the Elderly Medicare Population

Note. CDI, Clostridium difficile infection; OR, odds ratio; CI confidence interval; LTCF, long-term care facility; SNF, skilled nursing facility.
a Hazard ratios presented for acute-care hospitalizations.
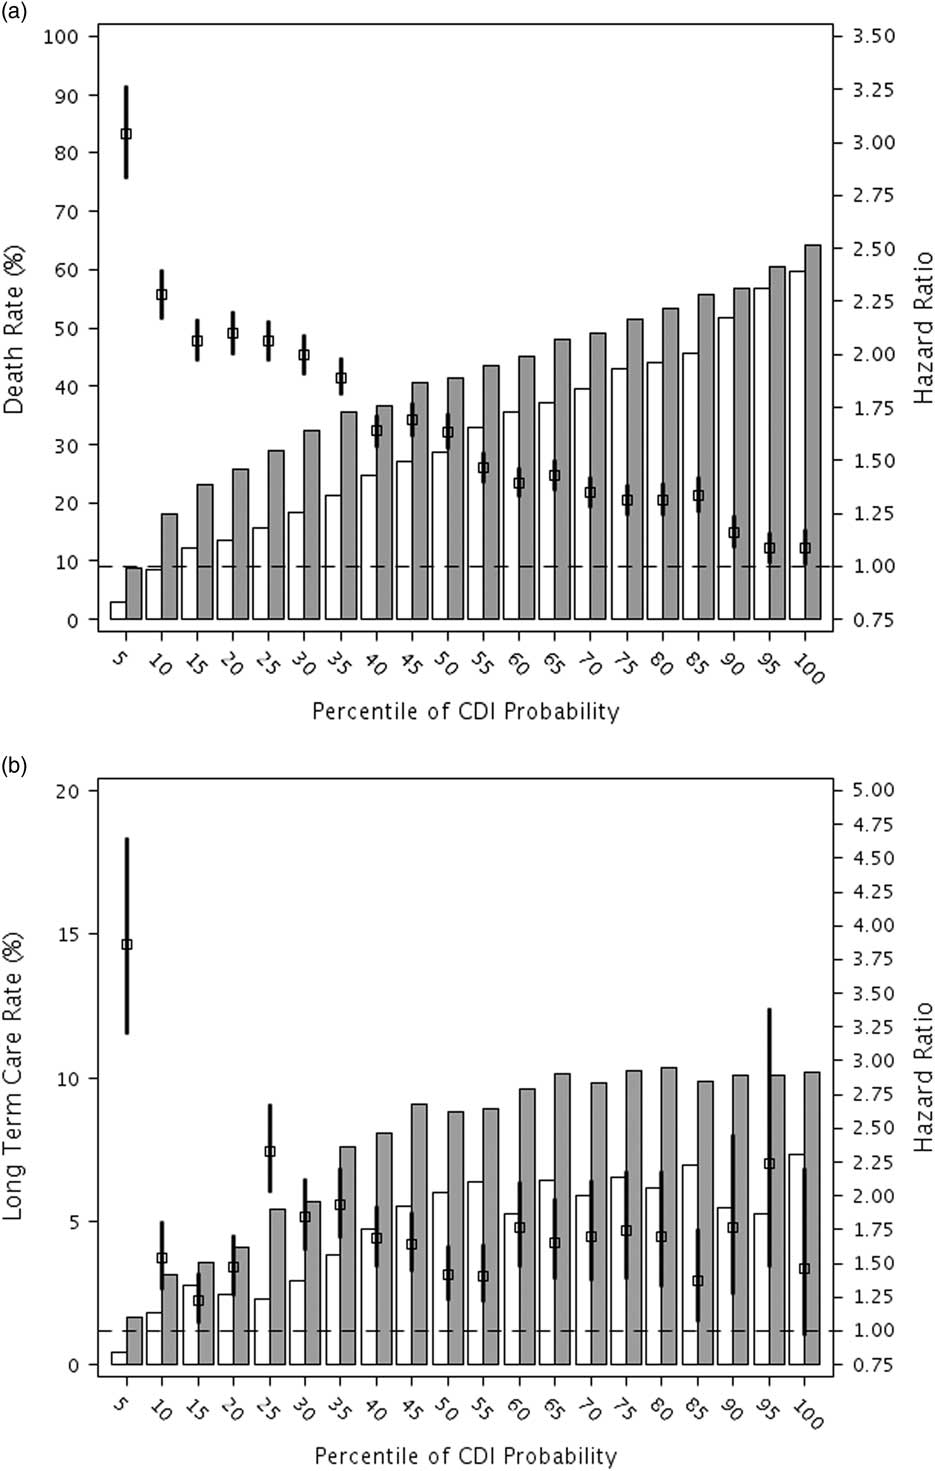
The results of the stratified analysis for all-cause mortality are shown in Figure 1. The risk of mortality was highest in patients with the lowest likelihood of CDI (ventile 1: HR, 3.04; 95% CI, 2.83–3.26), and this risk progressively decreased as the probability of CDI increased. In the highest-risk stratum, the risk of mortality was much lower but was still statistically significant (ventile 20: HR, 1.09; 95% CI, 1.01–1.17). As can also be seen in Figure 1, the percentage of CDI and control patients who died within 1 year progressively increased with increasing probability of CDI, from 8.8% of CDI cases and 3.0% of control patients in ventile 1, to 64.2% of CDI cases and 59.7% of control patients in ventile 20 with the highest probability of CDI.
Stratified hazard ratios and rates of outcomes within 1 year after Clostridium difficile infection (CDI) or control index date. Outcomes are (A) mortality, (B) new entry into a long-term care facility. The bars represent the respective event rates in controls (open bars) and CDI cases (grey bars). Hazard ratio and 95% confidence interval.

The same pattern was identified for new LTCF (Fig. 1) and SNF transfers (Appendix Fig. 3). The highest risk of both outcomes occurred in the first stratum with lowest likelihood of CDI (LTCF: HR, 3.86; 95% CI, 3.20–4.65 and SNF: HR, 4.51; 95% CI, 4.17–4.89). The risk of both outcomes decreased with increasing likelihood of CDI, albeit not as dramatically as mortality.
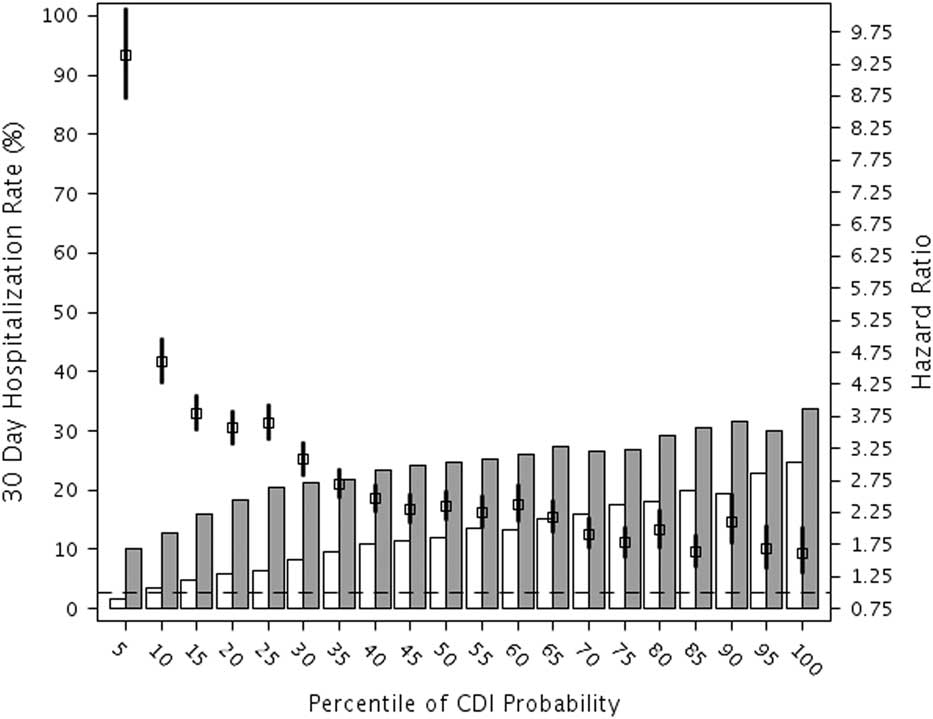
We analyzed 121,830 matched pairs for risk of acute-care hospitalizations. CDI was associated with increased risk of hospitalization within 30 days (HR, 2.27; CI, 2.22–2.32), within 90 days (HR, 1.95; CI, 1.92–1.98), and within 1 year (HR, 1.52; CI, 1.51–1.54), with attributable risk ranging from 11.4% to 15.7% (Table 2, Appendix Table 4). Similar results were obtained in the stratified analyses (Fig. 2 and Appendix Fig. 4). The percentage of cases with at least 1 subsequent hospitalization was consistently higher for CDI cases across all strata compared to control patients. The risk of hospitalization was highest in individuals in the lowest risk stratum and progressively decreased with increasing baseline probability of CDI. The magnitude of difference with increasing baseline CDI probability was greatest for 30-day hospitalization.
Stratified hazard ratios and rates of hospitalization within 30 days after Clostridium difficile infection (CDI) or control index date. The total number of patient included in the hospitalization analyses was 1,475,045 (158,558 CDI case patients and 1,316,487 control patients) after excluding 18,396 persons who died during the index hospitalization. The bars represent the hospitalization rates in control patients (open bars) and CDI case patients (grey bars). Hazard ratio and 95% confidence interval. The null hazard ratio of 1.0 is indicated by the horizontal dashed line.

Discussion
Using 2011 Medicare data, we found 10.9% excess 30-day mortality in CDI cases matched on the probability of CDI to control patients, with odds of mortality of 1.8. In stratified analysis, the risk of mortality was highest in persons with lowest probability of CDI, with progressively decreased risk of mortality as the probability of CDI increased. The minimal contribution of CDI to risk of mortality in the strata with highest baseline CDI probability makes clinical sense because patients at very high risk of CDI also have very high underlying severity of illness, with 60% 1-year mortality among the control uninfected patient population in the highest stratum. In contrast, patients in the lowest baseline CDI stratum had a 3-fold increased risk of 1-year all-cause mortality if they developed CDI. The stratified analysis demonstrates that the increased risk of mortality associated with CDI is not uniform in all elderly persons.
In matched-pairs analysis, the attributable risk of 30-day LTCF transfer due to CDI was 2.7%, and the attributable risk of 30-day SNF transfer due to CDI was much higher at 15.8%. In contrast to prior studies, we developed algorithms to distinguish long-term care residence (ie, nursing home) from short-term care stays to determine the impact of CDI on these distinct outcomes. SNF stays (median, 29 days), which reflect acute-care events requiring additional medical care before patients can return home, are reimbursed by Medicare for the purpose of rehabilitation following a hospitalization.Reference Bowblis, Horowitz and Brunt 27 In contrast, LTCF implies continual residence with no transition back to the community. The increased risk of 30-day SNF admission is suggestive of acute CDI-attributable morbidity and is further supported by the increased risk of 30- and 90-day hospitalizations in CDI patients. The increased risk of LTCF transfer suggests that CDI also contributes to chronic morbidity from which patients are unable to fully recover. This increased risk of transition to a LTCF has additional implications in terms of quality of life and economics; these costs are largely borne out of pocket or by the Medicaid program. The reduced impact of effect modification on these outcomes suggests that CDI-attributable morbidity impacts patients regardless of their underlying CDI risk.
The pooled CDI attributable mortality of 10.9% we calculated using propensity score matched pairs is similar to the results reported by Nanwa et alReference Nanwa, Sander and Krahn 28 in a Canadian population. In that study, the attributable risk of mortality due to community-onset CDI was 13% at 1 year, although they did not report mortality specifically in the elderly. In contrast, Kuntz et alReference Kuntz, Baker and Kipnis 11 reported much lower attributable mortality risk of 4% due to nonrecurrent CDI in adult Kaiser Health Plan members. One possible explanation for the lower CDI mortality risk in the Kuntz et al study was the requirement of a negative CDI test in control patients, thus selecting for control patients suspected of having CDI with likely higher underlying severity of illness than a nontested group.
Our results also differ from those of Shorr et alReference Shorr, Zilberberg, Wang, Baser and Yu 9 in the Medicare elderly population, in which they reported higher attributable mortality due to CDI of 10% at 30 days and 19% at 1 year.Reference Shorr, Zilberberg, Wang, Baser and Yu 9 Although Shorr et al also used propensity scores and matched pairs, they included fewer variables in their model and less stringent methods for matching than we did in this study. Because we were able to match only 73% of CDI cases to controls (vs 99% by Shorr), our analysis consisted of patients likely more similar in baseline characteristics, resulting in lower attributable risk than that reported by Shorr et al.
The limitations of this study include use of administrative data, which lack clinical detail concerning some CDI risk factors (eg, antibiotic utilization), CDI verification, and medications used to treat CDI in the hospital. Previously, we found the CDI ICD-9-CM diagnosis code reported by hospitals to have a sensitivity of 78% and a specificity of 99.7% compared to C. difficile toxin assay results.Reference Dubberke, Butler and Yokoe 29 Although identification of CDI using claims data is imperfect, the impact on our findings should be minimal because the net effect of this misclassification results in bias toward the null hypothesis. The use of older Medicare data is also a limitation, and our results should be confirmed with more recent data in which the incidence of CDI is lower. Despite the imperfection of claims data, the CDI incidence of 663 per 100,000 we calculated is almost identical to that reported by Lessa et alReference Lessa, Mu and Bamberg 2 (628 per 100,000 elderly persons) using 2011 EIP surveillance data and laboratory tests to identify CDI. To mitigate the lack of clinical detail concerning prior antibiotic utilization, we included variables for a wide range of infections and classified them by expected type and duration of antibiotic therapy.Reference Dubberke, Olsen and Stwalley 19 We also included variables for numerous acute and chronic conditions that may result in antibiotic treatment and healthcare exposure. We calculated risk of outcomes based on exposures prior to the CDI (control) index date to quantify the probability of CDI. Although we have not considered subsequent exposures in this study, variation in CDI treatment, and other conditions after the index date, we used this method because we aimed to calculate differing risks of outcomes after balancing baseline exposures between the CDI and uninfected groups.
Strengths of this study include the very large population size, including all elderly beneficiaries coded for CDI in 2011, and generalizability of results to the Medicare fee-for-service population. We included a comprehensive set of variables into the propensity score model and achieved good balance in baseline characteristics, ensuring comparable case and control patients for the matched-pairs analyses. We performed a stratified analysis of outcomes based on the propensity score; it demonstrated heterogeneity in the impact of CDI on mortality depending on baseline CDI risk.
Overall, CDI was associated with increased risk of mortality, new LTCF, and short-term SNF transfer within 30 days and 1 year in elderly persons. The increased mortality risk associated with CDI was much greater in persons with low baseline CDI risk and progressively decreased as the baseline risk of CDI increased. The increased risk of SNF and LTCF admissions, as well as 30-day and 1-year hospitalization, demonstrates that CDI negatively impacts patients in both the short and long terms. Our findings suggest that CDI prevention strategies should not be limited to just high-risk populations; lower-risk elderly populations may have the greatest benefit. New strategies to prevent CDI focused on the elderly need to be developed to reduce mortality, morbidity, and decline resulting in loss of independence and institutionalization.
Acknowledgments
We thank Cherie Hill for support with the CMS data files.
Financial support
E.R.D. received support for this study from Sanofi Pasteur. The sponsor participated in study design, interpretation of data, and final review of the manuscript. M.A.O and E.R.D had full access to all of the data in the study and final responsibility for the decision to submit for publication. Additional funding for access to data and services through the Washington University Center for Administrative Data Research was provided by the National Center for Advancing Translational Sciences of the National Institutes of Health (grant no. UL1 TR002345) and the Agency for Healthcare Research and Quality (grant no. R24 HS19455).
Conflicts of interest
M.A.O. reports consulting and speaking fees from Pfizer. C.D. reports that she is an employee of Sanofi Pasteur. E.R.D. reports grant funding from Pfizer, Rebiotix, and Merck, and consulting fees from Sanofi Pasteur, Pfizer, Synthetic Biologics, Valneva, Abbott, Biofire, Rebiotix, and Merck. D.S. reports no conflicts of interest relevant to this manuscript.
Supplementary material
To view supplementary material for this article, please visit https://doi.org/10.1017/ice.2018.280