The extremes in the lactation period may challenge dairy farmers and industry because of alleged low stability and thermal resistance. Transitional milk has low pH and higher ionic calcium values, and only after 15 d of lactation can milk be processed for UHT (Tsioulpas et al., Reference Tsioulpas, Lewis and Grandison2007a, Reference Tsioulpas, Lewis and Grandison2007c). According to Shew (Reference Shew1981), cow's milk must be stable at least 76% in the alcohol test to be able to withstand UHT treatment. On the other hand, there is evidence that milk from cows at the end of lactation is also less stable (Barros et al., Reference Barros, Denis and Gonzalez1999; Marques et al., Reference Marques, Fischer, Zanela, Stumpf Júnior, Ribeiro, Vidal, Rodrigues and Peters2010), although this remains far less documented. Moreover, limitations in reproductive efficiency caused by food shortage, heat stress and diseases or even recent concerns about cow welfare may lead to the extension of lactation beyond the standard 305–315 d (Van Knegsel et al., Reference Van Knegsel, Burgers, Ma, Goselink and Kok2022). Extended lactation favors cow's health, and may not decrease milk yield, especially for confined primiparous cows compared with multiparous cows grazing or not. In 18-months lactation, as lactation progressed, protein and fat percentages increased and lactose percentage decreased (Sorensen et al., Reference Sorensen, Muir and Knight2008). In 22-months extended lactations, milk had higher concentrations of fat and protein than cows undergoing 10-mo lactations. Moreover, the ratio of casein to true protein was not affected by lactation length and neither were the proportions of individual caseins (Auldist et al., Reference Auldist, Grainger, Houlihan, Mayes and Williams2010). However, the effects of extendedc lactation are less documented on milk composition (Sehested et al., Reference Sehested, Gaillard, Lehmann, Maciel, Vestergaard, Weisbjerg, Mogensen, Larsen, Poulsen and Kristensen2019), especially for the functional or processing characteristics.
In Brazil, according to Normative Instruction No. 76, milk should be stable at least 72% v/v of ethanol (Brasil, 2018), but industries require higher stability, ranging between 76 and 82% v/v. Several countries still use the alcohol test on industry platforms to accept raw milk. The value of 68% is accepted in African countries (Kassa et al., Reference Kassa, Yilma, Assefa, Bekele, Gojam, Nebiyu and Kassa2013; Rathnayake et al., Reference Rathnayake, Mangalika, Adikari and Nayananjalie2016), while in Chile, Uruguay and Argentina, the value of 70% is accepted (Chavez et al., Reference Chavez, Negri, Taverna and Cuatrín2004). Among the variables that usually affect thermal stability are iCa concentration, acidity and pH (Horne and Parker, Reference Horne and Parker1981; Chavez et al., Reference Chavez, Negri, Taverna and Cuatrín2004; Horne, Reference Horne2016). Ionic calcium values present high values in milk at early (Tsioulpas et al., Reference Tsioulpas, Grandison and Lewis2007b; Schmitz et al., Reference Schmitz, Costa, Fluck, Borba, Rangel and Fischer2024 in press) and late lactation (Barros et al., Reference Barros, Denis and Gonzalez1999; Magan et al., Reference Magan, Lamichhane and Tobin2022). Horne and Parker (Reference Horne and Parker1981) reported that mixing milk samples with different profiles (ethanol stability curve as a function of pH) will result in a profile more similar to that of the sample with the highest milk volume, evidencing that the factors which affect stability are mainly in the aqueous fraction of the milk. pH and acidity are considered to be challenging in the beginning of lactation (Tsioulpas et al., Reference Tsioulpas, Lewis and Grandison2007a, Reference Tsioulpas, Grandison and Lewis2007b; Costa et al., Reference Costa, Brito, Souza, Pereira, Pinto and Martins2014), but scarce information are reported at the end of lactation. This study aimed to characterize the functional characteristics of milk and evaluate the effect of including 0, 2, 5, 10, 20, 40 and 100% of individual milk from cows at extended lactation (more than 315 DIM) on MES, pH, acidity and ionic calcium (iCa) of the bulk tank milk.
Material and methods
The study was carried out from June 2021 to December 2023, on commercial dairy farms in the city of Dois Vizinhos, PR. Milk samples were collected from individual cows at the morning milking and from the bulk tank. Milk samples were kept refrigerated at up to 4°C and sent to the laboratory of animal bromatology at the Federal Technological University of Paraná. A total of 398 milk samples were analyzed, individual (57), tank (57) and mixtures (285) to determine stability in the alcohol test, pH, acidity and iCa concentration. Individual animal data were recorded, including days in lactation, parity and breed.
Farm management
Milk samples were collected in three commercial herds, composed of cows of the following breeds: Jersey (n = 21), Holstein (n = 7), Jersey × Holstein crossbreds (n = 6) and Holsteins × Gyr – Girolando crossbred animals (n = 3). All sampled cows were in extended lactation, here defined as >315 d in milk. The three farms used the semi-confinement system where the animals grazed in paddocks, composed of Cynodon dactylon and Cynodon nlemfuensi. Cows were milked twice a day. After milking cows were fed with commercial concentrate, soybean meal, corn silage and minerals. Water was permanently available. Animal health management followed the vaccination schedule proposed by the responsible veterinarian. On all farms, dry-off takes place 60 d before the expected calving date, gestational diagnosis is carried out at most every 3 months through ultrasound.
Milk characteristics
Milk samples were collected from individual cows at the morning milking using whole milking sampler units. Samples were aliquoted into two 40-ml plastic flasks with lid, without conservative, and were cooled at 4 °C for 12 h. Afterwards, different percentages of milk from cows at extended lactation were mixed with tank milk, and the volumes of milk given in online Supplementary Table S1 were mixed to achieve levels of extended lactation milk equivalent to 2, 5, 10, 20 and 40% Milk from the individual cow, bulk tank milk and these mixtures were subsequently analyzed for pH, acidity, ethanol stability (MES), acidity ionic calcium (iCa).
pH was determined by potentiometry and MES was determined by mixing, in a Petri dish, 2 ml of milk and 2 ml of alcoholic solutions with incremental ethanol concentrations (2% increments) between 64 and 90%, inclusive (Tronco, Reference Tronco2003). The results were expressed as the minimum concentration of ethanol in the alcoholic solution that induced visually detectable milk coagulation. Acidity determination was performed by titration (Vidal and Saran Netto, Reference Vidal and Saran Netto2018). Acidity was expressed as °D. Ionic calcium was determined by ion-selective potentiometry (Thermo Scientific Orion® potentiometer, Dual Star model) according to the methodology described by Ribeiro et al. (Reference Ribeiro, Barbosa, Fischer, Junior Stumpf and Barros2010). The potentiometer had a combined reference electrode and a selective electrode for calcium ions. The iCa concentration values were expressed in mg/l.
Statistical analysis
Individual milk samples were blocked in three groups, comprising MES higher than, lower than or equal to bulk tank. Milk samples of individual cows were classified as low (≤74%), intermediate (76–78%) and high (≥80%) stability classes based on MES. Due to small number of replicates per genetic group, we did not consider the effect of genetic group in the model. Data on individual cow milk were submitted to Anova for testing the differences between stability classes. Milk samples of individual cows, bulk tank and mixtures were submitted to multiple linear regression analysis within blocks 1 and 2 (testing the % of inclusion of individual milk into bulk milk and DIM), and dependent variables were pH, acidity, iCa and MES. Further we applied logistic regression to test the odds of % of inclusion of individual milk on low stability (MES ≤74%) and broken line regressions (PROC NLIN) to verify the inflexion point between MES and the inclusion of individual cow milk into bulk tank milk. Statistical significance was declared at P < 0.05.
Results
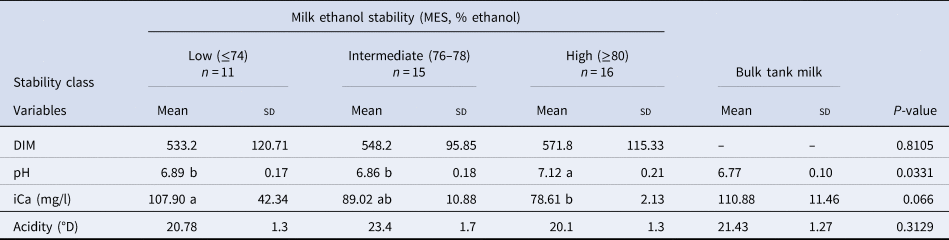
Cows at extended lactation (353–725 DIM) produced milk with overall mean (± sd) values 77.4 ± 5.8%, 6.89 ± 0.21, 96.31 ± 28 mg/l and 22.3.02 ± 3.9 °D for MES, pH, iCa and acidity, respectively. Milk classified as low (MES ≤74%), intermediate (MES = 76–78%) and high (MES ≥80%) stability showed significant difference in pH (P < 0.05) and numerical (non-significant) difference in iCa (P = 0.066). Ionic calcium was higher for low than high stability milk, while pH was lower for low than high stability milk. No differences in DIM and acidity were detected between stability classes (Table 1).
Characterization of milk samples of groups of individual cows at extended lactation according to its MES

Within a row, different superscripts indicate significant difference, P<0.05
Considering the individual milk of cows and the isolated effect of each milk characteristic on MES, MES decreased linearly with iCa (y = −0.14x + 89.91, P < 0.05, R 2 = 0.39), while it increased with pH (y = 13.45x − 16.21, P < 0.05, R 2 = 0.22). However, acidity and DIM did not affect MES. The odds of individual milk to present low stability (MES ≤74%) was not affected (P > 0.05) by DIM, pH and acidity, while it showed a numerical (non-significant) increase with iCa (odds ratio = 1.040(0.992–1.09), P < 0.10).
When milk from individual cows presented higher MES than bulk tank milk, MES and pH increased linearly and significantly with individual milk inclusion and DIM:
MES = 64.72 + 0.055 inclusion + 0.018 DIM, P < 0.0001, R 2 = 0.23
pH = 6.5 + 0.003 inclusion + 0.0004 DIM, P < 0.0001, R 2 = 0.22
By contrast, acidity (mean value 22.08 °D) was not affected by either inclusion or DIM whilst iCa decreased:
iCa = 100.8–0.21 inclusion + 0.0008 DIM, P < 0.0001, R 2 = 0.24)
The odds of bulk milk presenting low stability (MES ≤74%) decreased with individual milk inclusion and DIM:
Inclusion odds ratio = 0.975, (CI95: 0.961–0.99), P < 0.001
DIM odds ratio = 0.994 (CI95: 0.99–0.997, P < 0.001).
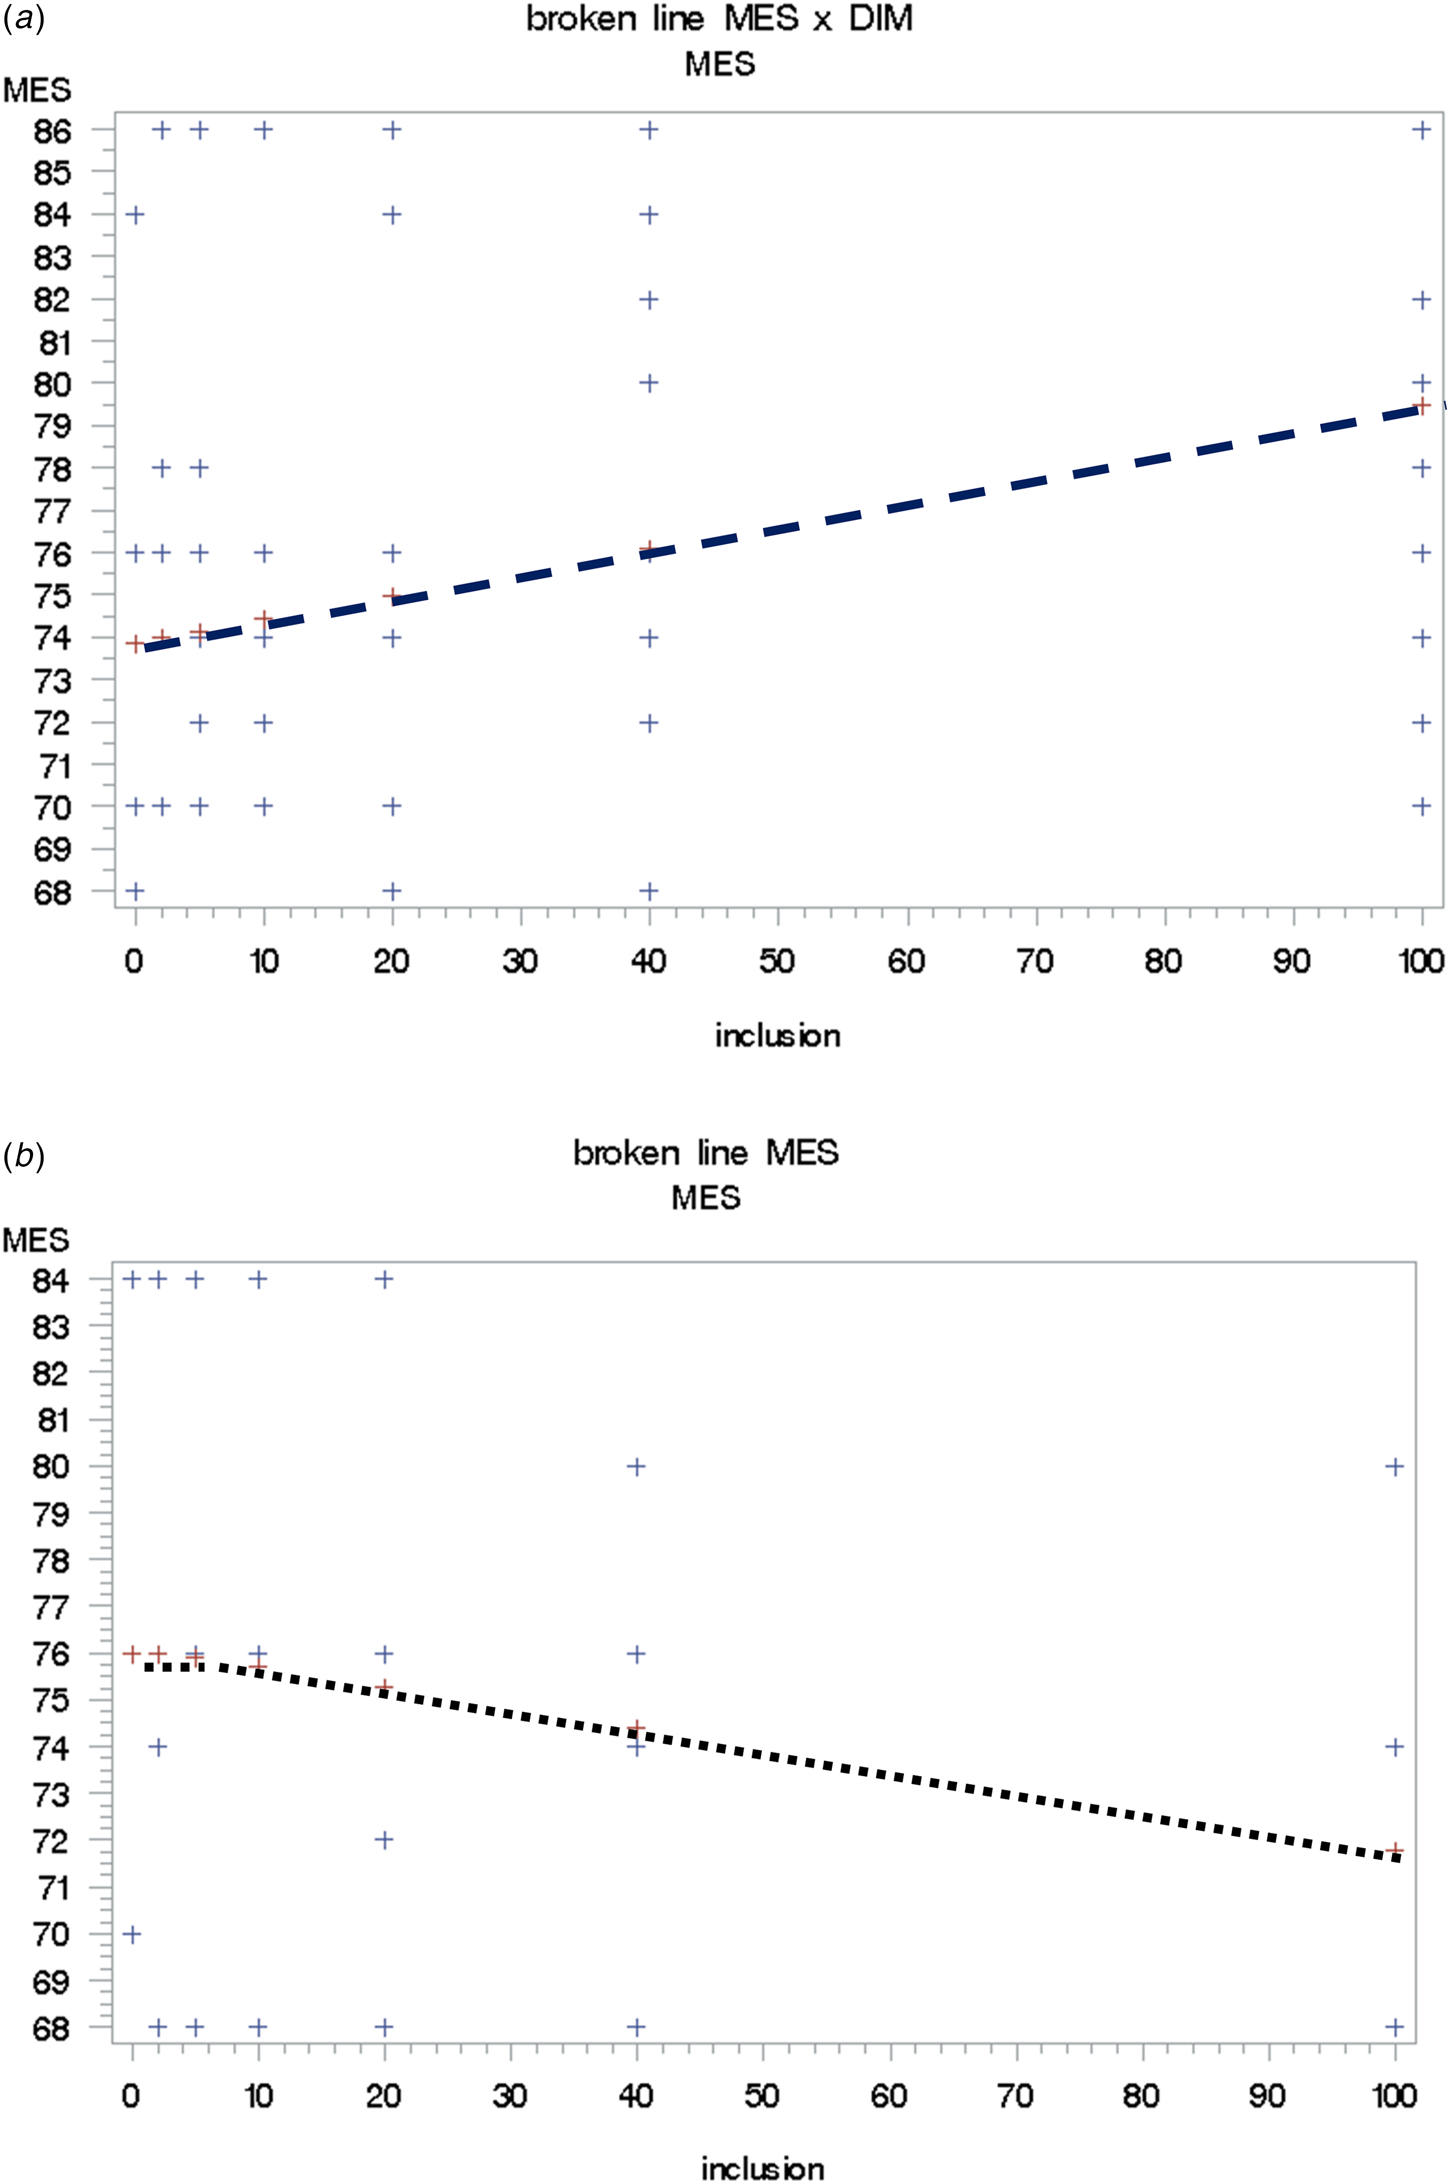
Figure 1 shows the inflection points of inclusion of individual milk with lower and higher MES than the bulk tank. MES of mixture increased linearly with the volume of individual milk added, althought no inflection point was detected. The visual inspection of the regression line revealed that a mixture of at least 20% of individual milk was necessary to express any increase in ethanol stability of bulk tank (Fig. 1a).
Variation of milk ethanol stabilty (MES, % of ethanol to induce coagulation of milk) following inclusion (%) of individual milk with higher (a) and lower (b) MES than raw milk bulk tank.

When the milk of individual cows presented lower MES than bulk tank milk, iCa (119.08 mgdl), pH (6.84) and acidity (20.92 °D) did not vary, but MES decreased significantly with inclusion:
MES = 73.63–0.044 inclusion + 0.0004 DIM, P = 0.0282, R 2 = 0.11)
The odds of bulk milk presenting low stability (MES ≤74%) increased with individual milk inclusion and DIM:
Inclusion odds ratio = 1.03, (CI95: 1.005–1.055), P < 0.05
DIM odds ratio = 1.01 (CI95: 1.00–1.01), P < 0.05.
MES of the mixtures decreased linearly with the volume of individual milk added, the inflection point was set at 2.9% of individual inclusion, albeit the visual inspection of the regression line revealed that mixture of at least 20% of individual milk was necessary to express any reduction in ethanol stability of bulk tank (Fig. 1b).
Discussion
The main contribution of this study is the evaluation of the milk functionality and processing characteristics of cows at extended lactation as well as the effect of adding milk from these cows on bulk tank milk functional characteristics. There is increasing interest in extending the calving interval, from 12 to 18 or 22 months, reducing the number of challenging periods during the cow's life or adapting cows to less optimal feeding conditions (Van Knegsel et al., Reference Van Knegsel, Burgers, Ma, Goselink and Kok2022). Previous studies showed small differences in milk production during two or more lactations between conventional lactation (10-months) and extended lactation (Van Knegsel et al., Reference Van Knegsel, Burgers, Ma, Goselink and Kok2022). There is less information on composition, especially functional characteristics, of cows at extended lactation (Sorensen et al., Reference Sorensen, Muir and Knight2008; Auldist et al., Reference Auldist, Grainger, Houlihan, Mayes and Williams2010; Sehested et al., Reference Sehested, Gaillard, Lehmann, Maciel, Vestergaard, Weisbjerg, Mogensen, Larsen, Poulsen and Kristensen2019). Here we define extended lactation simply as >315 DIM, as no management interventions designed to improve lactation persistency were implemented. Others have used the term to apply specifically to longer lactations (18 months calving interval, for example) where manipulations such as frequent milking or nutritional supplementation were employed to improve lactation persistency and the processing quality of the late-lactation milk (Sorensen et al., Reference Sorensen, Muir and Knight2008). Previously, grazing cows at extended lactation produced milk with low MES and did not respond to increase in supplementation, despite increasing their milk production (Marques et al., Reference Marques, Fischer, Zanela, Stumpf Júnior, Ribeiro, Vidal, Rodrigues and Peters2010). In another study, low thermal stability in late lactation was attributed to reduced consumption of fresh pasture, generating less substrate for tricarboxylic acid cycle that leads to lower milk urea and citrate contents, and consequently increased ionic calcium activity. Moreover, these changes in the ratio of ionic to colloidal calcium reduce micellar charge, destabilizing the casein micelle and reducing thermal stability. A further decline in casein micelle stability is linked to a slight increase in milk pH in late lactation, from approximately 6.7 to 6.9, the point at which minimum heat stability values are typically observed (Magan et al., Reference Magan, Lamichhane and Tobin2022).
Overall, our cows produced milk with acceptable functional characteristics as MES was equal or above 76% v/v in almost 70% of cows and pH was close to the usual accepted range for bulk milk, 6.6–6.8 (Tsioulpas et al., Reference Tsioulpas, Lewis and Grandison2007a). On the other hand, acidity was above the usual range for bulk tank milk (14–18°D), but individual milk may show acidity higher, up to 22–23 °D without presenting high total bacterial count (Neves, Reference Neves2021; Martins et al., Reference Martins, Marinho, Fischer, Pereira, Los and Martins2024; Schmitz et al., Reference Schmitz, Costa, Fluck, Borba, Rangel and Fischer2024). Ionic calcium was at the upper threshold of the reported values for high stability milk between 80 and 100 mg/l (Tsioulpas et al., Reference Tsioulpas, Grandison and Lewis2007b, Reference Tsioulpas, Lewis and Grandison2007c; Lewis, Reference Lewis2011).
Our study evaluated cows grazing, supplemented with concentrate and silage and calving throughout the year, so not necessarily coincident with pasture's end of cycle or low pasture allowance or season of the year. We acknowledge the well described negative effect of low pasture allowance and/or nutritional quality on milk stability and season of the year (Martins et al., Reference Martins, Marinho, Fischer, Pereira, Los and Martins2024; Garcia et al., Reference Garcia, Bettencourt, Aires, Andretta and Fischer2023a, Reference Garcia, Bettencourt, Aires, Andretta and Fischer2023b), but these factors cannot fully explain our findings.
High-stability milk presented lowest iCa, close to 80 mg/l, while in low-stability milk iCa was above the upper threshold of 100 mg/l, in agreement with a previous report (Lewis, Reference Lewis2011) for stable milk. Ionic calcium and pH were the variables that differed between stability classes. Moreover, iCa was retained by logistic regression as increasing the odds of low stability, in agreement with others (Chavez et al., Reference Chavez, Negri, Taverna and Cuatrín2004; Lewis, Reference Lewis2011; Horne, Reference Horne2016) who pointed out its pivotal role on milk stability. We also confirmed the positive relation between MES and pH, and the fact that low stability was evidenced in pH values around 6.9, as previously reported (Barros, Reference Barros2002; Chavez et al., Reference Chavez, Negri, Taverna and Cuatrín2004; Magan et al., Reference Magan, Lamichhane and Tobin2022).
In an expected way, when an individual milk sample was more stable than bulk tank milk, its inclusion increased stability and reduced the odds of having low stability milk not suitable for severe thermal processing, such as UHT. The reverse occurred when individual milk was less stable than bulk tank milk, and iCa was the only variable that increased as MES progressively reduced (pH and acidity did not vary). Previously, mixing two milk samples with different profiles resulted in a profile in the ethanol stability curve according to the sample with the largest volume, and this effect is determined by serum phase factors (Horne and Parker, Reference Horne and Parker1981). To our knowledge, this is the first study conducted at farm level examining the effects of adding millk from individual cows on bulk tank milk functional characteristics. As a limitation of our study, milk samples were collected in typical smallholder farmers, with small herds and with few and unbalanced animals per genetic group per farm. Therefore, we could not evaluate the effect of genetic group. Nevertheless, Schmitz et al. (Reference Schmitz, Costa, Fluck, Borba, Rangel and Fischer2024) evidenced the lower MES and higher iCa in Jersey × Holstein crossbreds compared with Jersey and Holstein cows during the extended lactation period.
As extended lactation practice becomes more frequent, dairy farmers, technicians and the dairy industry might have concerns about the impact of addition of extended-lactation milk into the bulk tank. The present study showed that nearly 66% of cows produced milk with higher stability than the bulk tank milk, and 75% of cows produced milk with intermediate or high MES. Therefore, an evaluation of the milk from each individual cow might be necessary to support the decision of whether to mix it with the whole milk of the farm. The present study showed that milk inclusion of low-stability milk decreased the stability of the whole bulk tank, mainly due to the increase in iCa.
In conclusion, dairy cows at extended lacation may produce milk with adequate values for functional characteristics. Ionic calcium was the main variable affecting MES, and milk should present values between 80 and 100 mg/l. Inclusion of low-stability milk decreased linearly MES of the bulk tank, depending on the volume included. Inclusion of more than 20% of individual milk with low stability should be avoided or considered wirh caution.
Supplementary material
The supplementary material for this article can be found at https://doi.org/10.1017/S0022029925000196
Acknowledgments
Authors acknowledge the Bromatology Laboratory of the Universidade Tecnológica do Paraná (UTFPR) for facilities used in this study and Associação Paranaense de Criadores de Bovinos da Raça Holandesa (APCBPR) for granting the milk analysis. Scholarships were granted by National Council for Scientific and Technological Development (Conselho Nacional de Desenvolvimento Científico e Tecnológico- CNPq) and the Coordination of Superior Level Staff Improvement (Coordenação de Aperfeiçoamento de Pessoal de Nível Superior – CAPES).