Introduction
The role of potassium (K) for crop growth and metabolism is important because it significantly affects enzyme activity, phloem transport, reduction of chlorophyll concentration, lower leaf turgor and transpiration (White and Greenwood, Reference White and Greenwood2013); (White and Karley, Reference White and Karley2010). Thus, crop K deficiency can lead to reduced grain yields (Scanlan et al., Reference Scanlan, Bell and Brennan2015) or reduced grain quality (Gremigni et al., Reference Gremigni, Wong, Edwards, Harris and Hamblin2001). For many years, a large proportion of arable soils in Australia have had significant K reserves (Williams and Raupach, Reference Williams and Raupach1983), but recently, there have been some concerns about the status of soil K availability and renewed interest in the estimation of soil K test values for crop grain yield (Brennan and Bell, Reference Brennan and Bell2013). In fact there have been indications that soil K is being ‘mined’ in wheat crops especially through grain/hay removal and leaching (Bell et al., Reference Bell, Moody, Harch, Compton and Want2009).
Past research on the use of proximal sensing for nutrient management focused mostly on nitrogen (N) because of its environmental impacts and volatility in price. For example, the use of spectral reflectance to derive vegetation indices for the estimation of wheat N (Cammarano et al., Reference Cammarano, Fitzgerald, Casa and Basso2014). A technique of crop nutrient detection involves fluorescence sensing which has been applied in a variety of different applications, including: the anthocyanin content of grapes (Ghozlen et al., Reference Ghozlen, Cerovic, Germain, Toutain and Latouche2010), crop disease detection (Yu et al., Reference Yu, Leufen, Hunsche, Noga, Chen and Bareth2013) and the identification of water stressed plants (Peteinatos et al., Reference Peteinatos, Korsaeth, Berge and Gerhards2016). Recent findings using fluorescence techniques for detection of crop N content have shown encouraging results (Perry and Fitzgerald, Reference Perry and Fitzgerald2015). Major opportunities for precision agriculture exist to apply fluorescence sensing to estimate other nutrients such as K to inform management practices and to forecast grain yield or grain quality.
The objectives of this study were: (i) to quantify the effect of K rate, lime and inter-row management on crop biomass, grain yield and grain quality attributes for barley and wheat and (ii) to determine the relationship between fluorescence channels and indices and grain yield and quality (including variables such as protein and grain nutrient content).
Materials and Method
The experiment was located (37.80o S, 142.80o E) approximately 12 km south of Lake Bolac, Victoria, Australia. The soil and landscape form of this site is similar to the surrounding area that is mostly used for cropping. The soil had a sandy loam texture in the A horizon (0–0.27 m) and high clay content deep (>0.6 m) in the B horizon. It was classified as a Luvisol (IUSS Working Group WRB, 2014).
This experiment was conducted on a field that had experienced an extended period of continuous cropping (>20 years) and had a serious K deficiency. Based upon this background data there were four treatment factors which were imposed: two management factors (windrow and inter-row), two crop species (wheat and barley), four fertilizer K levels and two lime treatments (nil and one lime rate). The windrow (the area where crop was laid) and inter-row (area between the swaths) treatments relate to the previous management in the harvest of a canola crop. Each treatment plot was 3.5×1.6 m with buffer space between plots. The fertilizer K treatments were: K1=control (no added K), K2=25, K3=50 and K4=100 kg K ha−1 and the lime treatment was applied (29 April 2015) before crop establishment at 1 t ha−1. The K was applied as KCl by hand on 23 July 2015 after the crop had emerged. The experiment had a randomised block design with four replicates in a single block. The crops were sown on 28 May 2015 with the following sowing rates: 86 kg seeds ha−1 for wheat (Cv. Trojan) and 96 kg seeds ha−1 for barley (Cv. Navigator).
The experiments were operated according to local conventional management practices to ensure optimal crop growth. The climate at the experiment was described as temperate with cool winters and warm summer temperatures. The total 2015 rainfall was 427 mm which was well below the long-term average. Dry conditions during spring (October – 11 mm, November – 28 mm) caused crop moisture stress and limited grain yield potential.
Field samplings were made on the 16 October 2015 when the wheat was at mid-flowering (GS 61-65), while the barley was at mid stem elongation (GS 53-55). Sampling was undertaken at a developmental stage when remote sensing is often used to forecast yield, and in this study we used it to forecast grain quality and crop nutrient content (Lobell et al., Reference Lobell, Asner, Ortiz-Monasterio and Benning2003). At the same time fluorescence data were collected using a hand-held multi-parameter optical sensor (Multiplex 3.6, FORCE-A, Orsay, France) which was described in detail elsewhere (Agati et al., Reference Agati, Foschi, Grossi, Guglielminetti, Cerovic and Volterrani2013). Measurements were made with 250 light excitation flashes per individual measurement, using four light sources (UV, blue, green and red) and three detection channels: yellow or blue, red and near-infrared. These measurements produced data on the following variables: 12 fluorescence signals and several derived indices (such as for chlorophyll: SFR_R, SFR_G) including one index developed by (Agati et al., Reference Agati, Foschi, Grossi and Volterrani2015). The crops were harvested for grain yield at physiological maturity on 8 January 2016.
Above-ground crop biomass was measured by sampling (2×0.8 m) whole plants on 16 October 2015. Samples were oven dried at 70°C for 48 h weighed for determination of the whole crop biomass. Each sample was then ground and mineral (K, Ca, Mg) analysis was done on a HNO3 digestion. These solutions were diluted and analysed using Atomic Absorption Spectrometry (Agilent 280FS-AA) (Zarcinas et al., Reference Zarcinas, Cartwright and Spouncer1987). The plant mineral (K, Ca, Mg, Na) concentration is reported on % basis. Grain samples were cleaned and analysed for the following: protein (%), thousand grain weight (g) and grain mineral (K, Ca, Mg) concentration (%).
For the crop response variables measured after all treatments were applied the following linear mixed model was fitted in ASReml 3.0 (Gilmour et al., Reference Gilmour, Gogel, Cullis and Thompson2009). Fixed effects included the following treatment factors: inter-row/windrow, crop species (triticale, wheat), K fertiliser (four levels) and lime (Nil/Plus) and all 2-way, 3-way and 4-way interactions of these terms. Random effects included the vertical design structure (vertical block/vertical mainplot), the horizontal design structure (rep/mainplot/subplot/sub-subplot) and the interaction of these 2 blocking structures. The residual variance for inter-row and windrow were estimated separately. The significance of fixed effects was assessed using approximate F-tests using established techniques (Kenward and Roger, Reference Kenward and Roger1997). For variables measured before all treatments were applied only applicable blocking structure were included in the model. A Pearson correlation analysis was undertaken between selected crop and fluorometer variables. This was done in order to quantify the degree of association (r) between directly measured data (crop variables i.e. DM and DM nutrient content; grain yield and grain quality) and proximal sensed data (fluorometer variables) and identify the most suitable relationships to investigate further.
Linear regression analysis was performed in order to find a functional relationship between individual fluorometer variables (channels/ indices) and crop variables. The relationships between fluorometer variables and crop variables were evaluated using the k-fold cross-validation (Harrell, Reference Harrell2001). The model was calibrated using a training dataset which was evaluated on a testing dataset. Given the availability of only one dataset, it was randomly divided into k equal-sized sub-datasets for calibration and evaluation. This procedure was repeated k times, with each of the k sub-datasets used as the validation dataset. Finally, after all the iterations a single prediction is produced. We used the 10-fold (k=10) cross-validation and from the results of the cross-validation, the ability of index estimation was evaluated by calculating the Relative Mean Squared Relative Error (RMSRE) in which values are expressed as percentage of the observation. The RMSRE was calculated as follows:
 $$RMSRE\,{\equals}\,100\,{\asterisk}\, \sqrt {{1 \over N}\mathop{\sum}\limits_{i{\equals}1}^N {} \left( {{{y_{i} {\minus}y_{s} } \over {y_{i} }}} \right)^{2} } $$
where y i was the observed value, y s the predicted value, N the total number of observation.
The predictive ability of the cross-validation was evaluated by analyzing the changes in the Q2 values which is equivalent to the R2 of the cross-validation for the evaluation stage. When a cross-validation did not predict well the observed variable then Q2 showed negative values because the sum of squares of the estimations were greater than the total sum of squares from the dataset (Consonni et al., Reference Consonni, Ballabio and Todeschini2010).
Results and Discussion
Crop biomass and crop nutrient response to K rate, lime and inter-row management
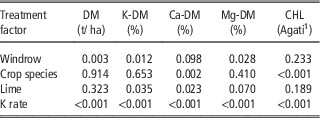
There were significant increases in crop biomass (P<0.05) for windrow and K rate, but no difference detected from liming or between the wheat and barley crops (Table 1). The crop K concentration was significantly increased for windrow compared with the inter-row, significantly increased the lime compared to the nil treatment and significantly increased with K rate, but there was no crop species treatment effect. For the crop Ca concentration there was a significant decrease due to K rate, while the nil treatment was greater compared to lime and barley was significantly greater than the wheat. In contrast, in the crop Mg concentration the inter-row was significantly greater than the windrow and K rate significantly reduced the Mg concentration. There was a significant treatment effects for crop species and K rate for chlorophyll index (Agati et al., Reference Agati, Foschi, Grossi, Guglielminetti, Cerovic and Volterrani2013), but no windrow or lime effects were detected.
The significance levels (P values) of the effect of treatment factors (Windrow/ inter-row, Crop species, Lime, K rate) on crop dry matter biomass (t/ ha), plant nutrient (K-DM, Ca-DM and Mg-DM) concentration (%) and a chlorophyll index (CHL)

Crop grain yield and grain quality response to K rate, lime and inter-row management
Table 2 shows the treatment effects on grain yield and grain quality variables. There was a significant (P<0.05) grain yield effects for windrow, lime and K rate, but there was no crop species effect. The windrow grain yield was significantly greater than the inter-row, the lime treatment was greater than the nil treatment and the K rate increased grain yield. The test weight was significantly greater for the windrow than the inter-row, the wheat was significantly greater than the barley and K rate was significantly increasing effect. Protein content was significantly greater for the windrow than the inter-row, barley had greater protein than the wheat and increasing K rate resulted in decreased protein content. For grain K content the windrow was significantly greater than the inter-row, while both grain Ca and Mg content were reduced with increasing K rate.
The significance levels (P values) of the effect of treatment factors (Windrow/ inter-row, Crop species, Lime, K rate) on crop grain yield (t/ ha) and grain quality variables (thousand grain weight – TGW, protein %, grain K %, grain Ca % and grain Mg %)

Evaluation of the relationship between crop and fluorescence variables
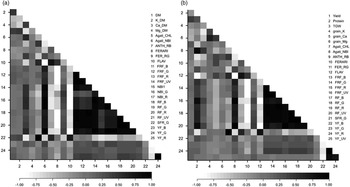
Correlation analysis was undertaken on all of the data in order to identify the degree of association between the different crop and fluorometer variables (Figure 1). The correlation matrix was separated into two: according to crop variables which relate to the above-ground biomass measurements (Figure 1a) and with crop variables from the grain harvest (Figure 1b). The strongest correlation was found for the crop Ca concentration (Ca_DM) (Figure 1a). For crop biomass (DM) and crop K concentration the best fluorometer parameter was SFR_R which is a simple chlorophyll ratio (FRF_R/RF_R) under a red light source. SFR_R has been used and proven successful in field studies investigating crop N status (Tremblay et al., Reference Tremblay, Wang and Cerovic2012). Figure 1b revealed some interesting correlation results with the highest correlation (r>0.8) among the grain variables was found for protein content (%). For grain yield the greatest correlation (r=0.25) was for very similar for two chlorophyll-related indices (Agati_CHL and SFR_R). For TGW the best correlation was with Agati_NBI which is N balance index and has proven to be a responsive fluorescence index in previous studies (Agati et al., Reference Agati, Foschi, Grossi, Guglielminetti, Cerovic and Volterrani2013). Grain Ca concentration had the highest correlation values (r>−0.4) for different red and far red channels. In contrast, both the grain K and grain Mg concentration were mostly comparatively low correlation values (r<+/−0.2).
Correlation matrix between crop variables and fluorometer variables (Agati_CHL, Agati_NBI, ANTH_RB, FERARI, FER_RG, FLAV, FRF_B, FRF_G, FRF_R, FRF_UV, RF_B, RF_G, RF_R, RF_UV, SFR_R, YF_B, YF_G, YF_R, YF_UV) at two crop growth stages (a) above-ground crop biomass variables (DM, K-DM, Ca-DM, Mg-DM) and (b) grain variables (Yield, Protein, TGW, grain-K, grain-Ca, grain-Mg); where all treatment factors are grouped together (i.e. wheat and barley combined) and no grouping according to the different treatment factors (windrow, crop species, lime, K rate).

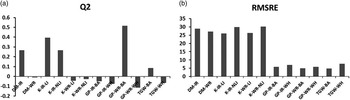
Based upon evaluation of the significant treatment effects in the different crop variables (Tables 1 and 2) and also with careful consideration of the values in correlation matrix (Figure 1). Next we selected 12 variables for further analysis of the crop-fluorometer relationship. A cross validation technique was used to analyse these relationships, their strength (Q2 values) and the associated uncertainty (RMSRE) is reported (Figure 2).
The range of cross validation output (a) Q2 values from selected treatment factor combinations; (b) Root Mean Square Error, with different treatment combinations (IR=inter-row, WR=windrow, LI=lime, NLI=nil lime, WH=wheat, BA=barley) for selected crop variables (DM=dry matter, K=potassium % in DM, GP=grain protein, TGW=thousand grain weight) modelled with different fluorometer variables (SFR_R for DM and FLAV for grain quality).

First, there were large variations in the predictive ability as observed the differences in the Q2 values (Figure 2a). Because the crop biomass was sampled on the same day as the fluorometer measurements were taken it was expected that the crop variables (DM, crop nutrient content) would have given the greatest Q2 values. For these predictions there was no significant difference for crop species (Table 1), thus wheat and barley were grouped together and modelled with SFR_R. The inter-row biomass (DM-IR) had a Q2 of 0.26 which was a much stronger prediction than the windrow biomass (DM-WR). The limed inter-row K crop content (K-IR-LI) had the highest Q2 value with 0.39, which was greater than the comparative nil limed treatment (K-IR-NLI). In contrast, the predictive ability for equivalent windrow treatments were was very low. At harvest the measured grain quality variables were best predicted with the FLAV index. The strongest predictive relationship was found for grain protein of barley in the windrow (GP-WR-BA) with a Q2 value of 0.51. The uncertainty of these cross validation results between these crop and fluorometer variables was determined by calculating the RMSE (Figure 2).
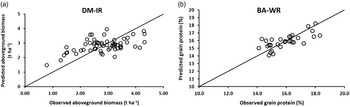
The cross validation technique enabled a comparison to be undertaken of the observed crop-fluorometer relationship with the predicted relationship. To illustrate the potential capability of using a fluorometer to predict crop variables two examples are shown in Figure 3. These examples are selected from the various treatment combinations that were given above in Figure 2. There was good agreement shown for the crop biomass inter-row treatment (DM-IR) (Figure 3a). This shows the potential for SFR_R (a chlorophyll index) to be used across cereal crops (at least wheat and barley) in order to predict crop biomass. Probably the major highlight was the strong predictive ability for grain protein in the barley windrow treatment (BA-WR) (Figure 3b). These results highlight further opportunities for fluorescence sensing of crop variables which have potential valuable implications for precision agriculture. For instance, grain protein is one of the most important grain quality variables and identifying new rapid and non-destructive sensing methods are valuable.
Observed versus predicted values for (a) aboveground biomass (DM-IR) for wheat and barley in the inter-row combined predicted using SFR_R and (b) grain protein for barley (BA-WR) in windrow predicted using FLAV.

Conclusion
This study investigated the nutrient and management effects on crop performance. Because the soil at the experimental site was acidic and K deficient, there were significant positive lime and K rate effects on a range of crop variables. In addition, there significant effects due to previous windrow/ inter-row management and at times the two crops (wheat and barley) performed differently. Some highlights of these significant results were: all crop variables were greater under the windrow treatment than the inter-row, K rate significantly increased grain yield and TGW, but K rate decreased protein and grain Ca and Mg content and the grain yield was significantly greater under lime compared with the nil treatment. These crop responses to the different treatment factors enabled the identification of significant crop-fluorescence relationships. The most promising relationships found were for SFR_R (a chlorophyll index) to predict crop biomass (regardless of crop species) and for FLAV with barley grain protein grown in a windrow. These results show that fluorescence sensing is sensitive enough to distinguish between crops where there are significant crop nutrient differences. This illustrates the potential to which crop-fluorescence relationships are able to inform crop nutrient status for management purposes. Indeed a fluorometer provides data in a rapid, non-destructive manner with fine spatial resolution which provides opportunities for wider application within precision agriculture. Nevertheless, while this study has identified both important and significant fluorometer-crop parameter relationships for wheat and barley, the data are only from a single site in one growing season. Further research is required on distinguishing the causes of crop stress as there are limits to which fluorescence sensing can identify different crop stressors.
Acknowledgements
The authors are very grateful for the support from the following colleagues: R. Veale, C. Celestina, M. Beveridge, E. Hilsdon, G. Fitzgerald and E. Perry. Financial support was provided by the GRDC, Australia with significant in-kind support from the NSW DPI.