Implications
Provision of proper feeder space is a key parameter in hen housing design. However, feeder space guidelines from hen welfare standpoint vary considerably among and within countries. Results of this study show that not all hens in the enriched colony housing (ECH) choose to feed simultaneously and that synchronous feeding of the hens did not increase with increasing feeder space. These findings help guide housing design for increased efficiency of resource utilization while maintaining production performance and accommodating certain feeding behaviors of the hens. It should be noted that the study did not cover the full range of welfare measurements such as aggression or frustration that may arise from reduced feeder space.
Introduction
Feeder space is an important parameter in the design and management of poultry production facilities. Insufficient feeder space can cause competition or aggression among animals, which will adversely affect their well-being (Sirovnik et al., Reference Sirovnik, Würbel and Toscano2018). Excessive feeder space leads to inefficient use of resources and may also lead to unnecessary complication in the system design and management. Global feeder space recommendations centered on time and synchrony at the feeder for laying hens have been based on scarce scientific data. Appleby (Reference Appleby2004) reported that with the lack of scientific information, feeder space requirement should assume that all birds have space enough to feed simultaneously, as it is for perch design: 14 cm per bird for medium and 12 cm per bird for light hybrids.
Cook et al. (Reference Cook, Xin and Nettleton2006) studied feeding behavior and production performance of laying hens in conventional cages and found no effect of cage stocking density (and consequently feeder space) on feed intake, feeding time per hen, number of meals ingested per day-cage, meal size (amount of feed intake per meal), meal duration, ingestion rate and number of hens feeding per meal. Thogerson et al. (Reference Thogerson, Hester, Mench, Newberry, Okura, Pajor, Talaty and Garner2009a and 2009b) evaluated the effects of feeder space allocation (achieved from different stocking densities) on productivity, physiology, feeding behavior, aggression, feather score, BW and mortality of W-36 laying hens in conventional cages. Hens with reduced feeder space were found to spend less time feeding, show less synchronization at the feeder and have higher feed intake (probably due to wastage), but no significant effects were observed on aggression, mortality, BW, BW uniformity, bone mineralization or physiologic stress.
Mench and Blatchford (Reference Mench and Blatchford2014) determined the overall space usage by laying hens using kinematic analysis, and reinforced that the space requirements for group-housed hens must account for the tendency of hens in a flock to synchronize their behavior. Widowski et al. (Reference Widowski, Hemsworth, Barnett and Rault2016) reported that further research is necessary to determine the space requirements of hens for particular resources (e.g. feeders, litter or scratch areas, and nests), rather than space allowance per se, in these more complex housing systems. According to the study by Widowski et al. (Reference Widowski, Caston, Casey-Trott and Hunniford2017a), the synchrony of laying hens at the feeder in furnished cages was not affected by cage size or space allowance. On the other hand, a recent study by Sirovnik et al. (Reference Sirovnik, Würbel and Toscano2018) reported that in aviary systems, the increase in feeder space significantly increased the synchrony at the feeder and feeding bouts.
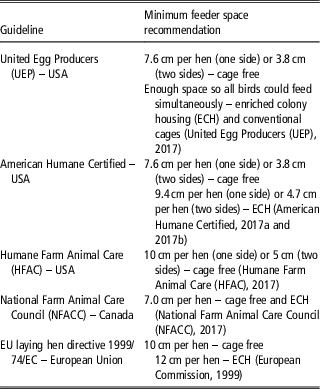
Because of the scarce research information regarding hen feeder space requirement, especially in emerging alternative hen housing systems, different organizations or certifying entities may have different sets of guidelines to meet the local or specific animal welfare standards. Table 1 lists the comparison of feeder space guidelines adopted in the United States, Canada and the European Union (EU). To address these discrepancies, additional research is warranted, as alternative hen housing systems are increasingly adopted worldwide.
Feeder space guidelines for laying hens adopted in United States, Canada and EU

The primary objective of this research was to evaluate the impact of feeder space on feeding behaviors of laying hens in an ECH, focusing on (1) daily time spent (TS, min/hen-day) at the feeder, (2) daily frequency of feeder visits (FV, #/hen-day), and (3) synchronization of feeding as measured by maximum and average percentage of hens feeding simultaneously (MPB and APB, %). The secondary objective was to quantify the variability in feeding behaviors (TS and FV) among the individual hens. The tertiary objective was to assess the effect of feeder space on production performance as measured in group-average daily feed intake (FI, g/hen-day), water use (WU, g/hen-day), and hen-day egg production (HDEP, %). Our hypotheses were that (a) feeding behavior (TS, FV, MPB and APB) and production performance (FI, WU and HDEP) of the hens would not be affected by the feeder spaces tested and (b) not all hens would feed simultaneously.
Material and methods
Before commencement of the study, the experimental protocol had been approved by the Iowa State University Institutional Animal Care and Use Committee – IACUC (Log # 6-15-8038-G). This application and approval process complies with standard federal policies for conducting research or teaching experiments involving use of live animals.
Animals and housing
A total of 60 W-36 (white) laying hens at 21 weeks of age (WOA) were obtained from an enriched colony hen house at a layer farm in central Iowa and transported to our research laboratory at Iowa State University. The pullets (young hens before lay) had been reared in standard rearing cages: 0.61 m long×0.76 m wide, 18 birds/cage (258 cm2/bird), two nipple drinkers, feed trough with available space of 3.4 cm/bird, and galvanized wire-mesh floor. At 17 WOA, the pullets were transferred to the commercial enriched colony hen houses equipped with Big Dutchman enriched colony system (AVEC II, Big Dutchman, Vechta, Germany), where they were housed in 60-bird colonies at an average stocking density of 750 cm2/bird.
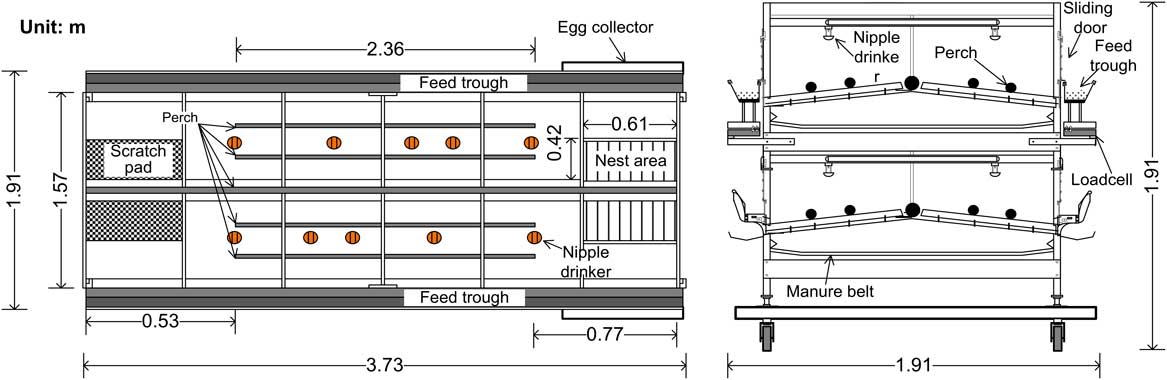
One double-tier ECH module (Big Dutchman), measuring 3.73 m long×1.91 m wide×1.91 m high (Figure 1), was used in this experiment. The colony in each tier was equipped with perches, nest boxes, and scratch pads. Feed troughs were on both sides of the colony. Manure was collected on a plastic tarp placed underneath the colony tier and removed once or twice a week. The nominal capacity of the colony was 60 hens, with resource allowance of 750 cm2 of floor area/hen, 85.4 cm2 of nest area/hen, 49.0 cm2 of scratch pad area/hen, 10 hens per nipple drinker, and 15.7 cm of perch per hen. The research lab used an automatically controlled ventilation system that consisted of an environment controller (Varifan ECS-3C, Quebec, Canada), two variable-speed exhaust fans (Multifan, Vostermans Ventilation, Bloomington, IL, USA), and a supplemental heating and cooling system. The room temperature was maintained at 23 (±1)°C throughout the experiment.
Top-view (left) and side-view (right) schematic drawings of the enriched colony housing (ECH) module used for the laying hens (W-36) in the study.

The hens were fed twice daily at 0900 and 1700 h (ad libitum) with the same feed as used on the commercial farm where the hens came. For each feeding time ~10 kg of feed was added manually. The hens were able to move their heads horizontally along the feed troughs. A photoperiod of 16 h light and 8 h dark (16L : 8D) as practiced on the farm was used, with lights-on at 0500 h and lights-off at 2100 h. A 15-min dimming period was used as practiced on the farm. Light intensity was 13 to 120 lx across the top tier colony, with the lower intensity near the nest boxes area and the higher intensity near the scratch pads area. All eggs laid in the nest boxes rolled into two egg collectors (one on each colony side), and they were manually removed once a day at 1700 h.
Experimental design
The ‘as-is’ feeder space of the experimental ECH was 12.0 cm/hen, reflecting the EU guideline, designated as the control in this study. Three additional levels of feeder space were tested, that is, 9.5, 8.5 and 6.5 cm/hen. The reduced feeder spaces (9.5, 8.5 and 6.5 cm/hen) were achieved by partially blocking the hen’s access to the feeder with metal wire-mesh pieces placed intermittently along the feeder, that is, one mesh installed per window of the ECH. All other resources (nest area, scratch pad area and perches) and hen stocking density remained the same for all four feeder spaces.
The four feeder spaces were tested one at a time, with the treatment sequence randomized (12, 6.5, 8.5 and 9.5 cm/hen). Testing for each feeder space lasted 7 days, with the first 2 days as the acclimation period and data from the last 5 days used in evaluating the treatment effect. Before application of the feeder space treatments, the hens had been acclimatized to the ECH environment for 14 days. Acclimation of the hens to the ECH environment or a new FS treatment was verified by monitoring daily feed and water intake and egg production. Individual hens were considered as the experimental units for the feeding behavior response variables of TS and FV, whereas the ECH was the experimental unit for the response variables of MPB, APB, FI, WU and HDEP.
Instrumentation
The top tier colony (where the hens were housed) was instrumented to monitor real-time feed and water use, record egg production (timing and number), and track the individual hens. Load-cell scales (Rice Lake Weighing Systems, Rice Lake, WI, USA) were used to automatically and continuously (every second) weigh the feeders, water tank and egg collectors. Weight of the drinking-water tank was automatically monitored with one calibrated suspension load-cell scale; whereas each feeder trough was supported and weighed with three calibrated compression load-cell scales. The water tank weight had a maximum measurement error of 7.3 g (<0.1% of daily WU), whereas weight of the feeder troughs had a maximum measurement error of 4.2 g (<0.1% of daily FI). Details on calibration of the load-cell scales were described by Li et al. (Reference Li, Zhao, Oliveira, Verhoijsen, Liu and Xin2017).
Two cameras (IP Pro 3 Megapixel Bullet, DSS-BFR3MP; Backstreet Surveillance, Salt Lake City, UT, USA) were installed on the ceiling above the ECH module and used to record the hen behaviors at 2 frames per second (fps). Video files were stored in 8 terabyte storage (two hard drives) of an NVR system (DSS-NVR5816; Backstreet Surveillance). Air temperature, relative humidity and carbon dioxide (CO2) of the hen room were measured and recorded. All sensors were connected to a compact Field Point Module, and data recorded using a LabVIEW program (National Instruments Co., Austin, TX, USA).
Radio-frequency identification system
Radio-frequency identification (RFID) technology, using electromagnetic fields to identify tags attached to objects, has been applied to evaluate the foraging behavior of individual laying hens (Sales et al., Reference Sales, Green, Gates, Brown-Brandl and Eigenberg2015); to monitor individual feed intake of group-housed turkeys (Tu et al., Reference Tu, Du, Tang, Xin and Wood2011); to assess pre-laying behavior of domestic hens (Ringgenberg et al., Reference Ringgenberg, Fröhlich, Harlander-Matauschek, Toscano, Würbel and Roth2015); and to evaluate the range utilization of laying hens in free-range systems (Hartcher et al., Reference Hartcher, Hickey, Hemsworth, Cronin, Wilkinson and Singh2016; Campbell et al., Reference Campbell, Hinch, Dyall, Warin, Little and Lee2017). Radio-frequency identification technology has also been used in combination with 3D vision camera to quantify behavior of individual laying hens in group housing (Nakarmi et al., Reference Nakarmi, Tang and Xin2014). Radio-frequency identification systems can be used to assess individual behavior of laying hens for a longer period than with standard video assessment method, and thus provide more precise information on behavioral responses such as daily time spent at feeder, frequency of visits and synchrony at feeder throughout the day.
In this study, an ultra-high frequency (UHF) RFID system (TransTech Systems, Aurora, OR, USA) consisting of four elements – antennas, tags, readers and a data acquisition system was used. The antennas were placed at the bottom of feed troughs and covered with plastic boards. Each feed trough had six antennas (four SlimLine 8060 – 864 to 869 MHz/902 to 928 MHz, 65 cm long×8.6 cm wide×0.8 cm thick each; and two IPJ-A0311-USA, 46 cm long×8.9 cm wide×1.9 cm thick each; TransTech Systems, Aurora, OR, USA) aligned in series covering the length of the feeder. The antennas were situated such that the tag (902 to 928 MHz, PT-103, tie-wrap tag passive Gen 2 UHF; TransTech Systems) attached to the hen’s neck could be registered when the hen was present at the feeder.
All antennas were connected to four 4-channel readers (ThingMagic Mercury M6, 865 to 928 MHz operating frequency, TransTech Systems). Two of the four readers received output from the six antennas for one (west) feeder while the other two readers received output from the six antennas for the other (east) feeder. The readers were connected to a host computer that processed the tag data through an RJ45 (Registered Jack, 10/100 Base-T Ethernet). The tag protocol was EPCglobal Gen 2 (ISO 18000-6C) with Digital Rights Management (DRM). The data acquisition program was written in C# (C Sharp) based on Application Programming Interface and the data were stored as text files.
Each hen was fitted with a rubber-band collar. The collars were placed on the hens 2 days after they had been in the experimental ECH. Initially some of the collars needed to be replaced or adjusted daily. Hens often had their beaks stuck on the collars while trying to take them off, which might require human intervention to free the stuck beak. It took about 7 days for the hens to get used to the collars, after which the RFID tags were attached to the collars. This approach avoided the occasional loss of the tags in the manure during the acclimation period.
The hens were considered feeding when their bodies were in front of the feeder and their heads were facing the feed trough. The RFID system successfully registered hens when their heads were inside the feeder but not when they raised to swallow feed or momentarily withdrew while occupying the space in front of the feeder. These intermittent brief breaks up to 30 s were considered as part of a feeding event. Details on the RFID configuration, data analysis, system performance and validation were described by Li et al. (Reference Li, Zhao, Oliveira, Verhoijsen, Liu and Xin2017).
Measurements and data processing
Load-cell scales were used to determine the group-level FI and WU. The data were collected every second via a program developed in LabVIEW, and then processed using EXCEL VBA programs. The uncertainty associated with these variables was <0.1% of the total weight measured. Hen-day egg production was calculated as the ratio of total number of eggs laid per day to the corresponding number of hens in the colony. Data collected from the RFID system consisted of time (hh:mm:ss:ms) and place (antenna #) when a specific bird (tag number) was detected feeding.
Each reader generated one txt file, and a total of four reader files were collected to cover both feeders. The number of hens detected by the RFID system was compared with and validated by human visual labeling through the video system. The overall accuracy of the RFID system relative to the video observation was (mean±SD) 92.1±6.4% (n=38) (Li et al., Reference Li, Zhao, Oliveira, Verhoijsen, Liu and Xin2017).
Statistical analysis
The data for APB, MPB, FI, WU and HDEP were analyzed using SAS 9.4 and one-way ANOVA. The ANOVA was shown to be adequate for the data by the plot of residuals v. predicted values and the normal probability plot of the residuals. The data for TS and FV were analyzed as repeated measures using SAS 9.4 and the following mixed linear model:
 $$y_{{ijk}} \,{\equals}\,\mu {\plus}\alpha _{i} {\plus}b_{j} {\plus}\gamma _{k} {\plus}(\alpha \gamma )_{{ik}} {\plus}e_{{ijk}} $$
where y
ijk
is the response (TS or FV) value on day k for bird j assigned to treatment i; μ the overall mean effect; α
i
the fixed effect of treatment i; b
j
the random effect of bird j; γ
k
the fixed effect of experimental day k; (αγ)
ik
the fixed interaction effect between treatment i and day k; and e
ijk
the random error associated with bird j assigned to treatment i on day k. Common assumptions were made on the random effects and errors in the repeated-measures model: the b
j
’s have mean 0 and variance
 $\sigma _{b}^{2} $
and are independent of each other and of the e
ijk
’s; the e
ijk
’s have mean 0 and e
ijk
’s with different (i,j)values are independent of each other.
Various covariance structures were selected for modeling the correlations between the response values on different days for the same bird j with treatment i, including independence, compound symmetry, autoregressive (1), autoregressive moving-average (ARMA) (1, 1), and Toeplitz. The Akaike information criterion was used to select the best correlation structure, and ARMA (1, 1) was the best for both TS and FV. The results reported for TS and FV are from fitting the mixed linear model with this correlation structure. We tested the hypothesis of no effect of time and no influence of treatment levels over time on the response variables evaluated. The Tukey–Kramer method was used for all pairwise comparisons between the treatments, and a P-value of 0.05 or less indicates a significant difference between two treatments. Unless otherwise specified, results for each treatment are presented as a least-squares mean±standard error of the mean (mean±SE).
Results
Daily time spent at the feeder
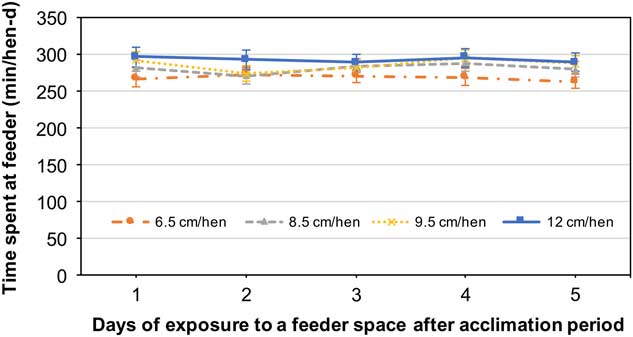
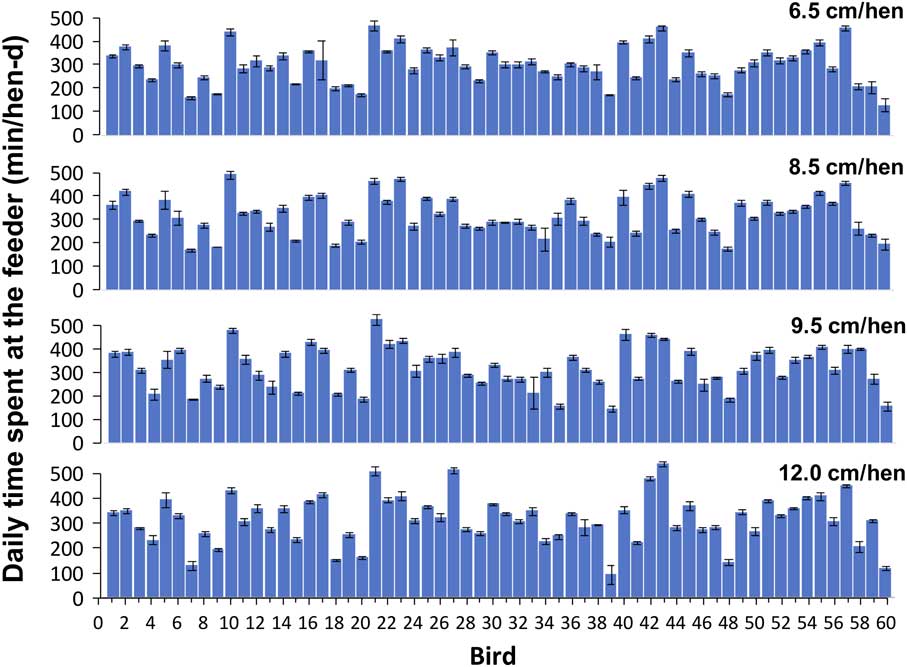
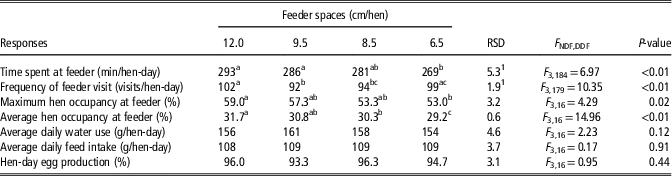
There was statistical evidence of the treatment×day interaction for TS (F 12,822=2.07; P=0.02). The effect of experimental days on TS was also significant (F 4,707=5.02; P<0.01). Nonetheless, there were few changes in the TS pattern over time by the group (Figure 2). Thus, the main effect of feeder space was elucidated. Significant differences were detected among the feeder space treatments regarding TS (F 3,184=6.97; P<0.01) in that TS decreased with declining feeder space. However, no significant difference was found among the 12.0, 9.5 and 8.5 cm/hen treatments (293±10, 286±10 and 281±10 min/day, respectively) and between the 8.5 and 6.5 cm/hen treatments (P>0.05; Table 2). In comparison, TS at both 12.0 and 9.5 cm/hen was significantly higher (P<0.05) than TS at 6.5 cm/hen (269±10 min/day). As shown by the data in Figure 3, there existed considerable individual variations in TS among the 60 hens. The CV of TS ranged from 28.0% to 32.1% for the four feeder spaces tested.
Daily time spent at the feeder (mean±SE, min/hen-day) by the laying hens over 5 consecutive days after the acclimation period when subjected to different feeder spaces.

Variation in daily time spent at feeder (mean±SE, min/hen-day) among the 60 individual hens for a given feeder space (6.5, 8.5, 9.5 or 12.0 cm/hen from top to bottom).

Feeding behavior and production characteristics (least-squares means) of 60 laying hens (W-36) in the enriched colony housing (ECH) with different feeder space allocations

NDF=numerator degree of freedom; DDF=denominator degree of freedom.
a,b,cFor each response variable, the row means with different letters are significantly different at P<0.05.
1
The repeated-measures analysis considers each individual hen. Therefore, the residual standard deviation (RSD) presented here is the RSD from the repeated-measures analysis divided by
 $\sqrt n $
(n=60) to be comparable with the RSD from the one-way ANOVA results.
Daily frequency of visits to feeder
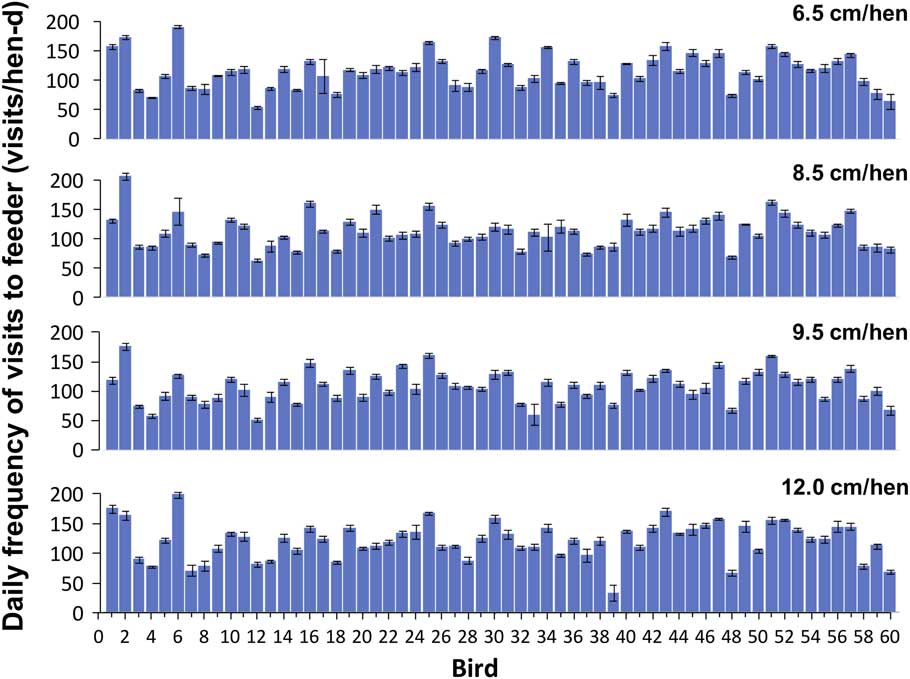
There was no evidence of the treatment×day interaction (F 12,820=1.50; P=0.12) or day effect (F 4,706=1.17; P=0.32) regarding FV. However, significant differences in FV were detected among the treatments (F 3,179=10.35; P<0.01). The hens showed more visits to the feeder (102±3 visits/day) in the 12.0 cm/hen treatment than in the 9.5 and 8.5 cm/hen treatments (92±3 and 94±3 visits/day, respectively) (P<0.05), and more visits to the feeder (99±3 visits/day) in the 6.5 cm/hen treatment than in the 9.5 cm/hen treatment. No difference was detected (P>0.05) in FV between 9.5 and 8.5 cm/hen, between 6.5 and 8.5 cm/hen, and between 6.5 and 12 cm/hen treatments. FV showed a nonlinear pattern with feeder space in that the two highest FV values occurred at the smallest and largest feeder spaces (6.5 and 12 cm/hen). Like TS, there existed considerable variations in FV among the individual hens (Figure 4). The CV of FV ranged from 26.5% to 27.8% for the feeder spaces tested.
Variation in daily frequency of visits to feeder (mean±SE, visits/hen-day) among the 60 individual hens for a given feeder space (6.5, 8.5, 9.5 and 12.0 cm/hen from top to bottom).

Hens feeding simultaneously
Significant differences were detected among the treatments regarding MPB (F 3,16=4.29; P=0.02) and APB (F 3,16=14.96; P<0.01); APB was observed to be 31.7±0.3% at 12.0 cm/hen and decreased to 29.2±0.3% at 6.5 cm/hen. Similarly, MPB was 59.0±1.4% at 12.0 cm/hen and decreased to 53.0±1.4% at 6.5 cm/hen. However, the only statistical difference detected in MPB was between 6.5 and 12.0 cm/hen (P<0.05). On the other hand, statistical difference in APB was found between 6.5 cm/hen and all other feeder spaces tested and between 8.5 and 12.0 cm/hen (P<0.05).
The total available feeder space in the colony at 12, 9.5, 8.5 and 6.5 cm/hen was, respectively, 7.2, 5.7, 5.1 and 3.9 m. As the feeder space availability changed, the density of birds at the feeder changed and consequently the space between birds changed. Here, the maximum and average density of birds at the feeder (hens/m) for each feeder space tested was determined by dividing respectively the maximum and average number of birds feeding simultaneously by the available total feeder space of the treatment tested. At 12 cm/hen, the maximum and average density of hens was five hens/m (20.3 cm/hen) and three hens/m (37.9 cm/hen). At 9.5 cm/hen, the maximum and average density was six hens/m (16.6 cm/hen) and three hens/m (30.8 cm/hen). At 8.5 cm/hen, the maximum and average density was six hens/m (15.9 cm/hen) and four hens/m (28.1 cm/hen). Finally, at 6.5 cm/hen, the maximum and average density was eight hens/m (12.3 cm/hen) and four hens/m (22.3 cm/hen).
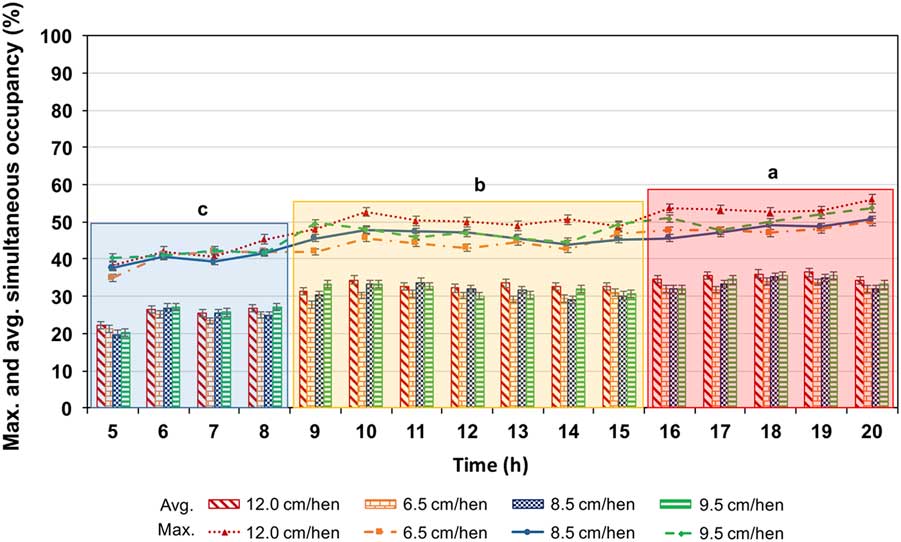
Simultaneous occupancy of hens at the feeder, expressed as APB and MPB and pooled over the 5 experimental days by hour, is shown in Figure 5. As depicted by the data, the dynamics of feeder usage was similar for all treatments. The percentage of hens feeding simultaneously increased during the day. In general, use of the feeders was relatively mild in the morning (0500 to 0900 h; MPB varied from 43.3±0.6% to 46.7±3.1%), moderate from late morning to afternoon (0900 to 1600 h; MPB varied from 49.5±1.6 to 54.5±0.9%), and relatively intense in the late afternoon/evening (1600 to 2100 h; MPB varied from 52.3±0.4 to 58.0±1.4%). This pattern was consistent in all the treatments, and statistical difference (P<0.05) was observed for the simultaneous occupancy among the three periods for all the treatments tested.
Daily patterns of maximum (mean±SE, lines) and average (mean±SE, bars) simultaneous occupancy or feeding of the hens for a given feeder space (6.5, 8.5, 9.5 or 12.0 cm/hen). The colored boxes represent the simultaneous occupancy at feeder in the morning (mild occupation from 0500 to 0900 h – blue box), late morning/afternoon (moderate occupation from 0900 to 1600 h – yellow box), and late afternoon/evening (intense occupation from 1600 to 2100 h – red box). Boxes with different letters are significantly different at P<0.05 for all the treatments tested.

Production performance
Despite the significant differences detected for the behavioral responses (TS, FV, MPB and APB) among some of the treatments, no treatment effects for the feeder spaces tested were detected on FI (F 3,16=0.17; P=0.91), WU (F 3,16=2.23; P=0.12), and HDEP (F 3,16=0.95; P=0.44) (Table 2). No mortality was experienced during the experiment period.
Discussion
Due to limited resources and to allow for video recording for system performance verification, the RFID system was only installed in the top tier of the ECH module. Consequently, the group-based production performance was not replicated other than repeated measures over the experiment period. Besides, the number of hens involved was rather small. Hence, the performance results should be treated with caution; further validation involving replications and more hens is prudent before a solid conclusion is reached.
Impact of feeder space on feeding behavior
Impact on TS
While there was an overall treatment effect of the feeder space on TS (P<0.01), no treatment effect was detected between 12.0 and 9.5 cm/hen and between 8.5 cm/hen and any other feeder space tested. Thogerson et al. (Reference Thogerson, Hester, Mench, Newberry, Pajor and Garner2009b) evaluated the effect of feeder space (5.8, 7.1, 8.4, 9.7, 10.9 and 12.2 cm/hen) on time spent at the feeder in conventional cages by changing the hen stocking density and found that hens with reduced feeder space spent less time feeding; however, no significant difference (P>0.05) was found in TS between 12.2 and 10.9 cm/hen and between 10.9 and 9.7 cm/hen.
Impact on FV
The current study revealed a nonlinear relationship between FV and feeder space. This relationship might be explained by noting that when 12.0 cm/hen feeder space was provided, the hens had plenty of space and could use it at their will. In this case, the hens had more opportunities to perform foraging activities in the feeder area. When feeder space was reduced to the most restricted level of 6.5 cm/hen, TS was the lowest but FV was the second highest (99±3 visits/day) among all the treatments. This outcome might have occurred because with less space, the birds had to take more turns to acquire the needed daily feed intake. The motivations for the two high FV values at the largest and smallest feeder spaces (12.0 v. 6.5 cm/hen) were presumably different – one for more of exercising leisure behavior v. the other for acquiring necessary feed intake. Seeing the feed but being unable to access it was shown to increase competition (Banks et al., Reference Banks, Wood-Gush, Hughes and Mankovich1979; Meunier-Salaün and Faure, Reference Meunier-Salaün and Faure1984), and the increased FV for the most restricted feeder space seems consistent with such a behavior (although competition behavior was not quantified in the current study). The FV values at 8.5 and 9.5 cm/hen were not significantly different (P>0.05), albeit being significantly lower than FV at 12 cm/hen (P<0.05). When evaluating feeding behavior of laying hens under different stocking densities in a conventional cage, Cook et al. (Reference Cook, Xin and Nettleton2006) reported frequency of feeder visits (mean±SE) ranging from 117±22 to 181±22 visits per cage of six hens. In that study, feeder space varied from 7.6 to 10.2 cm/hen, resulting from different stocking densities (348, 387, 426 and 465 cm2/hen). No statistical difference in FV was detected among the treatments (P=0.18), with FV showing a nonlinear trend as well.
Impact on simultaneous feeding
With the highest MPB of 59.0% and APB of 31.7% at 12.0 cm/hen and insignificantly different MPB of 57.3% and APB of 30.8% at 9.5 cm/hen (P>0.05), the results demonstrated that not all the hens fed simultaneously even though they had sufficient feeder space to do so. The inherent nature of inter-hen variability observed in TS and FV helps to explain why the hens were not feeding simultaneously. Albentosa et al. (Reference Albentosa, Cooper, Luddem, Redgate, Elson and Walker2007) observed that even when given a feeder space of 16 cm/hen (resulting from higher space allocation) and unlimited feed in furnished cages, not all birds chose to feed simultaneously. The maximum percentage of hens feeding simultaneously was 83%, 75% and 80%, respectively, for furnished cages housing six, eight and 10 hens. Blatchford and Mench (Reference Blatchford and Mench2014) assessed the utilization of feeder space by hens housed in ECH and found that a maximum of 70% of the birds fed simultaneously. Widowski et al. (Reference Widowski, Caston, Casey-Trott and Hunniford2017a) found that mean percentage of birds feeding simultaneously was similar (23% to 24%) regardless of cage size or feeder space, with maximum percentage of hens feeding simultaneously not exceeding 63%. In aviary systems, simultaneous feeding ranged from 34.8% to 65.2% (maximum) and 12.2% to 19.2% (average) when feeder space varied from 3.8 to 10.0 cm/hen (Sirovnik et al., Reference Sirovnik, Würbel and Toscano2018). The low degree of synchronization at the feeder suggests that motivation for feeding is not only based on space availability. For instance, social dominance aspect makes lower-ranking hens avoid feeding near dominant hens (Keeling and Duncan, Reference Keeling and Duncan1989).
The 6% reduction in MPB from 59% at 12.0 cm/hen to 53% at 6.5 cm/hen translates to four hens less in simultaneous feeding for the 60-hen colony of the current study. This reduction is small relative to a 46% reduction in feeder space. Thogerson et al. (Reference Thogerson, Hester, Mench, Newberry, Pajor and Garner2009b) reported that hens responded to reduced feeder space by desynchronizing their feeding behavior. This finding is supported by the APB and MPB results of the current study as the feeder space changed from 12.0 to 6.5 cm/hen.
In terms of hen density at the feeders, when feeder space decreased from 12.0 to 6.5 cm/hen, the average density increased from three hens/m (37.9 cm/hen) to four hens/m (22.3 cm/hen), and the corresponding maximum density increased from five hens/m (20.3 cm/hen) to eight hens/m (12.3 cm/hen). We observed that the hens adjusted the space between each other as the feeder space availability changed. When more feeder space was provided, the hens increased the space between each other rather than the simultaneous occupancy at the feeders. This behavior reinforces that not all birds fed simultaneously even when 12.0 cm/hen of feeder space was provided, allowing them to do so. However, the inter-hen space became 12.3 cm at the most restrictive feeder space of 6.5 cm/hen.
The highest feeding activities during the last part of the photoperiod agreed with the results reported in the literature. In evaluating the effect of feeder space allowance (8.9 v. 12.8 cm/hen) by changing stocking density and cage size on laying hens’ behavior in furnished cages, Widowski et al. (Reference Widowski, Caston, Casey-Trott and Hunniford2017a) observed feeding activities of the hens in five different feeding times and found a higher percentage of birds feeding at 1700 h (35.3±0.1%). Blatchford and Mench (Reference Blatchford and Mench2014) observed that hens housed in an enriched colony had a small peak in synchronization of feeding at 0700 h and a large peak between 1800 and 1900 h. The increased feeding activities of poultry in the later part of the day reflect their anticipatory feeding behavior before the lights go off (dark under natural light conditions) and no feeding activities at night (8 to 10 h). This type of feeding behavior had also been reported in domestic fowls (Savory et al., Reference Savory, Wood-Gush and Duncan1978; Savory, Reference Savory1980). The calcium consumed in the evening and stored in the gut would be used to supplement the calcium from the medullary bone during eggshell formation (Graveland and Berends, Reference Graveland and Berends1997).
Impact of feeder space on production performance
Water use and feed intake were not affected by the feeder space treatments in this study. The results agreed with some studies in the literature (Cook et al., Reference Cook, Xin and Nettleton2006; Diarra and Devi, Reference Diarra and Devi2014; Widowski et al., Reference Widowski, Caston, Hunniford, Cooley and Torrey2017b), but conflicted with others that reported effect of feeder space on feed disappearance (Davami et al., Reference Davami, Wineland, Jones, Ilardi and Peterson1987; Sirovnik et al., Reference Sirovnik, Würbel and Toscano2018; Thogerson et al., Reference Thogerson, Hester, Mench, Newberry, Okura, Pajor, Talaty and Garner2009a). However, when unaccounted for, feed wastage could have led to inaccurate outcome on actual feed intake – the reason for using the term ‘feed disappearance’ v. ‘feed intake.’ When given larger feeder space and lower density, birds are allowed to perform non-feeding behavior such as observations of the surrounding, leading to feed wastage (Sirovnik et al., Reference Sirovnik, Würbel and Toscano2018).Visual observations during daily routine inspection of the hens noted that they were not always feeding while physically present at the feeders. This non-feeding behavior was also reported by Ma et al. (Reference Ma, Xin, Zhao, Li, Shepherd and Alvarez2016), which assessed W-36 laying hens’ choices for light intensity. The authors observed that the overall time spent at the feeder per day was 4.4±0.1 h; however, the hens spent only 3.4±0.1 h actually feeding. Li et al. (Reference Li, Ito and Yamamoto1991) proposed that the long eating time found in a study to evaluate the diurnal variation in heat production related to physical activities in laying hens was due to leisure-eating and food-pecking. These outcomes suggest that feeders have other enriching functions besides feeding.
The feeder spaces tested in this study did not influence HDEP. This result agreed with the results reported in some studies (Thogerson et al., Reference Thogerson, Hester, Mench, Newberry, Okura, Pajor, Talaty and Garner2009a; Sirovnik et al., Reference Sirovnik, Würbel and Toscano2018; Widowski et al., Reference Widowski, Caston, Hunniford, Cooley and Torrey2017b), but conflicted with others that reported significant effect of feeder space on egg production in conventional cages or floor pens (Garner et al., Reference Garner, Kiess, Mench, Newberry and Hester2012; Diarra and Devi, Reference Diarra and Devi2014). These differences might have arisen from different hen breeds, housing systems and the experimental conditions used. Specifically, the feeder space ranged from 4.8 to 12.8 cm/hen in the case of the conventional system with white leghorns, and 5.6 to 16.8 cm/hen for the floor pens with Shaver brown hens. The minimum feeder space (4.8 or 5.6 cm/hen) in both cases was smaller than the one (6.5 cm/hen) used in the current study involving W-36 white leghorn hens.
Conclusions
Laying hens (W-36 breed) in the ECH showed similar feeding behaviors when provided a feeder space of 12 or 9.5 cm/hen. Albeit presence of ample spare feeder space, as in the case of 12 cm/hen regimen, the hens did not exhibit the behavior of all feeding simultaneously. Hens provided with the 6.5 cm/hen feeder space spent less time at the feeder than with the 9.5 or 12 cm/hen feeder space and had a lower maximum number of hens feeding simultaneously than in the 12 cm/hen feeder space. However, no treatment effects (12, 9.5, 8.5 or 6.5 cm/hen) were observed on the hen’s production performance responses of daily feed intake, water intake and rate of lay, although the number of hens involved was quite small. Nonetheless, it is worth noting that lower feeder space may lead to aggression or frustration which was not quantified in the current study. It would be prudent to examine long-term impacts of feeder space on laying hen’s welfare, especially for the feeder spaces that do not impair production performance of the hen in alternative housing systems.
Acknowledgments
The enriched colony housing modules used in this study were donated by Big Dutchman Company and are greatly appreciated. Financial support for procurement of the electronic devices and supplies for the behavioral monitoring/tracking system was provided in part by the Iowa Egg Council Endowed Professorship fund awarded to Dr Hongwei Xin. Special thanks go to Dr Anna Johnson, Associate Professor of Animal Science at Iowa State University, for her consultation. The authors further acknowledge the financial support of the Brazilian National Counsel of Technological and Scientific Development (CNPq) and Federal University of Mato Grosso (UFMT) to Jofran Oliveira for his PhD study at Iowa State University.
Declaration of interest
The authors declare no conflicts of interest.
Ethics statement
The experimental design and procedures were previously approved by the Iowa State University Institutional Animal Care and Use Committee – IACUC (Log # 6-15-8038-G).
Software and data repository resources
Data were not deposited in an official repository. Access to data can be requested via the corresponding author.