Implications
The conservation of genetic diversity is one of the key points to match future demands of the agri-food markets. The glocal productions, often arising from local populations, could represent a plus in this context. The genetic characterization of these populations is a basic necessity before implementing conservation and exploitation strategies. An accurate detection of the populations’ structure allows to assess the priorities for conservation. Information obtained from the present work will be useful to support decision making on the conservation strategies contributing to the conservation of biodiversity.
Introduction
Together with conventional documentation, genetic documentation of existing livestock breeds enables the sustainable management and conservation of domestic animal diversity (Food and Agriculture Organization, 2009). Molecular techniques can be used to assess within-population genetic diversity and between-population differentiation and, therefore, make inferences on the degree of uniqueness of the analyzed populations. A number of approaches for quantifying genetic diversity have been proposed as tools for decision making in genetic conservation programs, including phylogenetic-like approaches such as that by Weitzman (Reference Weitzman1992) and Thaon d'Arnoldi et al. (Reference Thaon d'Arnoldi, Foulley and Ollivier1998), those focusing on the maximization of the Nei's (Reference Nei1987) gene diversity (Eding and Meuwissen, Reference Eding and Meuwissen2001; Caballero and Toro, Reference Caballero and Toro2002) or the average number of alleles per locus (Petit et al., Reference Petit, El Mousadik and Pons1998; Caballero and Rodríguez-Ramilo, Reference Caballero and Rodríguez-Ramilo2010). From these, the latter two (Petit et al., Reference Petit, El Mousadik and Pons1998; Caballero and Toro, Reference Caballero and Toro2002) have the advantage of the explicit use of within- and between-breed diversity. This allows their use in assessment of the within-population impact of different selection policies (Álvarez et al., Reference Álvarez, Gutiérrez, Royo, Fernández and Goyache2009 and Reference Álvarez, Royo, Pérez-Pardal, Fernández, Lorenzo and Goyache2011). Also, they are based on appealing criteria to set priorities for conservation: the concept of diversity is intuitively linked to the expected heterozygosity (i.e. balanced allelic frequencies), whereas the concept of genetic uniqueness underlies the interest in maximizing the number of alleles in a set of breeds.
The historical importance of the Tuscany region in the Italian Peninsula is well known (Pellecchia et al., Reference Pellecchia, Negrini, Colli, Patrini, Milanesi, Achilli, Bertorelle, Cavalli-Sforza, Piazza, Torroni and Ajmone-Marsan2007). From a livestock point of view, Tuscany has a total of six local cattle breeds (Calvana, Chianina, Garfagnina, Maremmana, Mucca Pisana and Pontremolese; Agenzia Regionale Sviluppo e Innovazione Agricoltura, 2006) with historical relevance. Most of them have undergone drastic population bottlenecks during the second half of the 20th century and are at present at the brink of extinction. Despite their historical importance, genetic documentation of the Tuscan cattle breeds has only been initiated recently (Negrini et al., Reference Negrini, Milanesi, Bozzi, Pellecchia and Ajmone-Marsan2006; Pellecchia et al., Reference Pellecchia, Negrini, Colli, Patrini, Milanesi, Achilli, Bertorelle, Cavalli-Sforza, Piazza, Torroni and Ajmone-Marsan2007). Recent studies on Y-chromosome variation have reported a very low haplotypic variability in these breeds (Pérez-Pardal et al., Reference Pérez-Pardal, Royo, Beja-Pereira, Chen, Cantet, Traoré, Curik, Sölkner, Bozzi, Fernández, Álvarez, Gutiérrez, Gómez, Ponce de León and Goyache2010a and Reference Pérez-Pardal, Royo, Beja-Pereira, Curik, Traoré, Fernández, Sölkner, Alonso, Álvarez, Bozzi, Chen, Ponce de León and Goyache2010b). The aim of this research was to analyze the polymorphism of a set of 34 microsatellites to assess the genetic relationships and differentiation between the local Tuscan cattle breeds and to quantify their contributions to diversity. Consequences for conservation will be discussed.
Material and methods
Description of management area and breeds
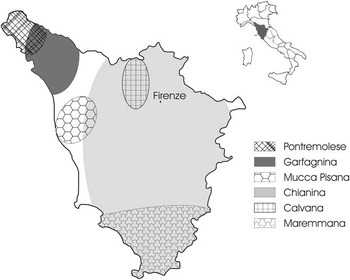
Tuscany is a region in Italy located between the northern part of the Tyrrhenian Sea and the central Apennines, and there are six breeds of cattle that, at present, are raised almost exclusively in this region (Agenzia Regionale Sviluppo e Innovazione Agricoltura – ARSIA, 2006), even though they can also be found in other neighboring regions (Figure 1). The Calvana breed, also considered as ‘Mountain Chianina’, is almost exclusively bred in the provinces of Firenze and Prato and the current population size includes 700 individuals kept in 21 herds. The Chianina is a beef breed whose population size is 46 553 heads, reared in 1505 herds. The Garfagnina, used in the past as a dual-purpose animal and now as meat animal, has a population size of 311 heads from 26 herds (ARSIA, 2006). The Maremmana is a Podolian breed with a total population size (Sargentini et al., Reference Sargentini, Bozzi, Lorenzini, Degl'Innocenti, Martini and Giorgetti2010) of 9682 heads kept in 158 herds. The Mucca Pisana breed is probably derived from the Brown Swiss cattle introduced in the Tuscany region during the 17th century with a later introgression, at the end of the 18th century, of Chianina cattle; the population size is around 300 individuals (Domestic Animal Diversity Information System, 2010). The Pontremolese breed was used for the production of bullocks for the Liguria and Lombardy markets in Northern Italy; it is a wild-coated breed probably related to the cattle of these northern areas; the total population size is below 30 individuals, with only three reproductive males.
Geographical areas in which the six analyzed Tuscan cattle breeds are mainly distributed.

The cattle analyzed include breeds of putative different origins according to the different researches carried out in previous years: the Mucca Pisana and Garfagnina breeds resulted from a recent introgression process of Brown Swiss animals (ARSIA, 2006); the Chianina and Calvana breeds are considered to be Italian native stock with an intriguing hypothesis of a signature of different origins (Negrini et al., Reference Negrini, Milanesi, Bozzi, Pellecchia and Ajmone-Marsan2006); the Maremmana breed is considered to be descendant from Aurochs and the Chianina breed (Beja-Pereira et al., Reference Beja-Pereira, Caramelli, Lalueza, Vernesi, Ferrand, Sampietro, Casoli, Goyache, Royo, Conti, Lari, Martini, Ouragh, Magid, Atash, Boscato, Triantophylidis, Ploumi, Sineo, Mallegni, Taberlet, Erhardt, Bertranpetit, Barbujani, Luikart and Bertorelle2006; Negrini et al., Reference Negrini, Nijman, Milanesi, Moazami-Goudarzi, Williams, Erhardt, Dunner, Rodellar, Valentini, Bradley, Olsaker, Kantanen, Ajmone-Marsan and Lenstra2007). Finally, the Pontremolese breed may be related to North-European cattle stocks (ARSIA, 2006) and a similar introgression has also been suggested for the Mucca Pisana animals (ARSIA, 2006).
Moreover, the breeds analyzed include specialized beef breeds (Chianina and Calvana) and rustic breeds with poor conformation carcasses and good maternal ability (Maremmana, Garfagnina, Mucca Pisana and Pontremolese). Also, the analyzed set includes breeds with different risk statuses, from those non-endangered (Chianina and Maremmana) to those highly endangered (Calvana, Garfagnina, Mucca Pisana and Pontremolese).
Sampling and genotyping
Blood samples were obtained for a total of 194 Tuscan cattle (44 Calvana, 35 Chianina, 25 Garfagnina, 31 Maremmana, 31 Mucca Pisana and 28 Pontremolese). The Maremmana and Chianina sampled individuals were unrelated males subjected to individual performance tests. The small population sizes did not allow us to obtain unrelated individuals for the other four Tuscan breeds. In the Garfagnina, Calvana and Mucca Pisana breeds, sampling was restricted to a maximum of 10 individuals per sampled herd. Sampling of the Pontremolese breed included virtually the entire alive population. In addition, 56 samples belonging to two endangered cattle populations of unquestionable cultural and historic value (Spanish Asturiana de la Montaña breed, 31; Argentinean Creole cattle, 25) but also known for their genetic uniqueness value (Beja-Pereira et al., Reference Beja-Pereira, Caramelli, Lalueza, Vernesi, Ferrand, Sampietro, Casoli, Goyache, Royo, Conti, Lari, Martini, Ouragh, Magid, Atash, Boscato, Triantophylidis, Ploumi, Sineo, Mallegni, Taberlet, Erhardt, Bertranpetit, Barbujani, Luikart and Bertorelle2006; Lirón et al., Reference Lirón, Bravi, Mirol, Peral-García and Giovambattista2006) were used as an outgroup. The entire dataset analyzed included 250 samples.
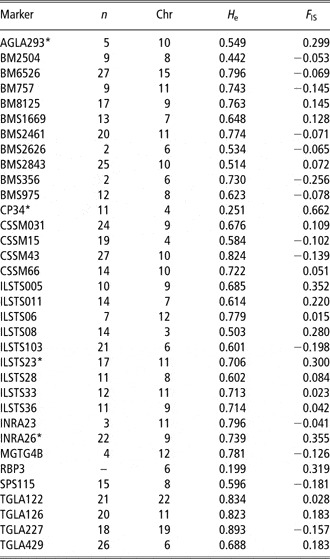
Total DNA was isolated from blood samples following standard procedures (Sambrook et al., Reference Sambrook, Fritsch and Maniatis1989). A total of 34 microsatellites were analyzed for all samples (Table 1). Genotyping was performed on an Automatic Sequencer ABI 310 (Applied Biosystems, Barcelona, Spain).
Number of alleles per marker (n), chromosome location (Chr), expected heterozygosity (H e) and heterozygote deficiency due to population subdivision (F IS) values per marker in the analyzed dataset

*Indicates a significant deviation from Hardy–Weinberg equilibrium for P < 0.05.
Statistical analyses
The program GENEPOP v. 3.4 (Rousset Reference Rousset2008) was used to compute: (a) the deviations from the Hardy–Weinberg proportions at marker and population levels; (b) heterozygote deficiency due to population subdivision at the marker level; and (c) linkage disequilibrium for the markers on the same chromosome.
Further analyses of molecular information were carried out using the program MolKin v. 3.0 (Gutiérrez et al., Reference Gutiérrez, Royo, Álvarez and Goyache2005). The following parameters were computed from microsatellite information at the within-breed and the entire dataset levels: molecular coancestry (fii), which is theoretically the complementary of the Nei's (Reference Nei1987) gene diversity or expected heterozygosity (Caballero and Toro, Reference Caballero and Toro2002), the heterozygote deficiency within population (F IS) and the uncorrected (A) and rarefacted (A (g )) number of alleles per locus (Hurlbert, Reference Hurlbert1971). In the last formula g was fitted to 30, which is twice the minimum number of individuals within a breed with genotype known for all the microsatellites.
The between-breed molecular coancestry (fij; Caballero and Toro, Reference Caballero and Toro2002), Nei's minimum distance (D m; Nei, Reference Nei1987) and kinship distance (D k; Eding and Meuwissen, Reference Eding and Meuwissen2001; Caballero and Toro, Reference Caballero and Toro2002) matrices were also computed using the program MolKin. Additionally, F-statistics, F ST and F IT (defined, respectively, as heterozygote deficiency due to population subdivision and heterozygote deficiency in the total population) were obtained for the entire analyzed dataset and for the Tuscan breeds.
To avoid bias because of unequal sample sizes, confidence on the estimates of genetic parameters was computed applying the bootstrapping method using 1000 samples with exactly 30 individuals per breed.
The program STRUCTURE (Pritchard et al., Reference Pritchard, Stephens and Donnelly2000) was used to ascertain possible cryptic genetic relationships in the dataset analyzed. The algorithm implemented in STRUCTURE uncovers ‘hidden structure’ without using a priori knowledge about the distribution over the clusters present in a dataset. We carried out 50 different runs from K = 1 to K = 20. All runs used a burn-in period of 20 000 iterations and a period of data collection of 200 000 iterations under an admixture model with allele frequencies correlated. The choice of the most likely number of clusters (K) was made, according to recommendations of Evanno et al. (Reference Evanno, Regnaut and Goudet2005), using graphical presentations of ΔK values. ΔK is the mean of the absolute values of L″(K) averaged over the number of runs divided by the standard deviation of L(K), and the modal value of the distribution of ΔK is used as an indicator of the strength of the signal detected by STRUCTURE. The similarity of the outcomes of the 50 solutions was assessed using CLUMMP software (Jakobsson and Rosenberg, Reference Jakobsson and Rosenberg2007); the most frequent solution was considered to be the most probable.
Contributions of the breeds (or their combinations) to diversity were assessed, using the program MolKin, following Petit et al. (Reference Petit, El Mousadik and Pons1998) and Caballero and Toro (Reference Caballero and Toro2002). The former method uses as a criterion the maintenance of the maximum overall Nei's (Reference Nei1987) gene diversity minimizing the overall molecular coancestry  , whereas the latter method assesses the contribution of the ith population to the total allelic richness (C T; C W; C B).
Losses of genetic variability will be quantified using the following approaches: (a) sequentially excluding each breed from the entire dataset and (b) sequentially excluding different combinations of breeds from the dataset to account for the possible non-independency of the corresponding genetic backgrounds. With respect to the exclusion of breeds using Petit et al.'s (Reference Petit, El Mousadik and Pons1998) method, it has to be pointed out that the results for the different combinations of breeds have been obtained by merging breeds where appropriate. The combinations of breeds tested were as follows: (i) Calvana and Chianina, Chianina and Maremmana, Mucca Pisana and Pontremolese, and Garfagnina and Mucca Pisana to account for shared genetic origins (two ecotypes of the same breed, Bos primigenius, North-European cattle stocks and Brown Swiss introgression, respectively); (ii) Calvana, Chianina and Maremmana to account for the Tuscan origin and Garfagnina, Mucca Pisana and Pontremolese to account for foreign breeds; and (iii) Chianina and Maremmana, and Calvana, Garfagnina, Mucca Pisana and Pontremolese to account, respectively, for the non-endangered and endangered Tuscan cattle breeds.
Results
In all, four markers (AGLA293, CP34, ILSTS23 and INRA26) were found to deviate significantly from Hardy–Weinberg proportions (Table 1). However, these deviations were not consistent across breeds and were considered to be due to a chance sampling effect (Type I Error). No linkage disequilibrium was assessed for the markers located on the same chromosome. Therefore, the entire microsatellite set was used in further analyses.
The F-statistics, F IS, F ST and F IT, computed for the entire dataset were 0.012 ± 0.008, 0.141 ± 0.004 and 0.131 ± 0.008, respectively. The same parameters computed only for the six analyzed Tuscan breeds were very similar (0.021 ± 0.009, 0.136 ± 0.005 and 0.1118 ± 0.009, respectively).
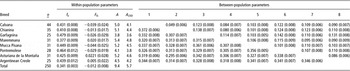
Parameters characterizing the genetic variability of the analyzed populations are given in Table 2. In general, the Tuscan endangered breeds showed a slightly higher genetic identity (fii) and more negative F IS values. The Garfagnina and Pontremolese breeds had within-breed molecular coancestries higher than 0.45, whereas the Calvana and Mucca Pisana breeds had F IS values around −0.04. The Maremmana breed was the most diverse (fii = 0.377 ± 0.009) and showed homozygote excess (F IS = 0.020 ± 0.017). The Garfagnina and Pontremolese breeds had the lowest rarefacted average number of alleles per locus (3.6 and 3.8, respectively), whereas, again, the Maremmana breed had higher allelic richness (4.8).
Number of individuals analyzed (n), within-population molecular coancestry (fii), heterozygote deficiency within population (F IS), average number of alleles per locus (A) and average number of alleles per locus rarefacted to 30 copies (A (30)) per analyzed breed and for the entire dataset. The between-population molecular coancestry (fij; below diagonal) and Nei's minimum distance (D m; above diagonal) matrices are also given

Standard deviations of the estimates are in brackets.
The between-breed molecular coancestry (fij) and D m matrices are also given in Table 2. The highest fij value was found between the closely related Calvana and Chianina breeds (0.372 ± 0.006), whereas the lowest was found for the pair Chianina–Asturiana de la Montaña (0.295 ± 0.006). However, the Chianina and, particularly, the Maremmana breeds showed low fij values with the non-endangered Tuscan cattle breeds. The Mucca Pisana breed had substantial genetic identity to the Garfagnina (0.361 ± 0.006) and Pontremolese (0.356 ± 0.005) breeds. The D m matrix confirmed this general scenario. The pair Calvana–Chianina was less differentiated (0.049 ± 0.006). In general, the Mucca Pisana and the Pontremolese breeds had the highest differentiation with the other breeds. The differentiation assessed for the pairs Maremmana–Calvana and Maremmana–Chianina was lower than that computed between the two breeds used as an outgroup (0.086 ± 0.006).
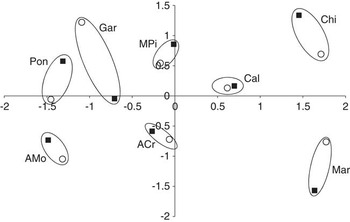
The between-breed D k matrix and the complementarity to the molecular coancestry matrix (1−fij) were described using a bidimensional scaling plot (Figure 2). Both matrices yielded highly consistent information, except for the Garfagnina breed. The non-endangered (Chianina and Maremmana) and the Calvana breeds are separated from the other Tuscan breeds and the outgroups on Dimension 1 (X-axis). Y-axis allows differentiating the Maremmana breed and the outgroups, which are spread on negative values of Dimension 2. The average between-breed self-coancestry matrix (not shown) yielded a very different pattern; the X-axis substantially subdivided the two outgroups and Garfagnina (at the two extremes of the axis) from the remaining five breeds, whereas the Y-axis allows to differentiate only the Pontremolese breed.
Multidimensional scaling plot constructed using the between-breed kinship distance (D k; black squares) and the complementary values of the between-breed molecular coancestry (1−fij; open circles). The two analyses were plotted on the same plot to highlight the coincidence of the results. Dimension 1 is on the X-axis and Dimension 2 is on the Y-axis. Abbreviations correspond to Calvana (Cal), Chianina (Chi), Garfagnina (Gar), Maremmana (Mar), Mucca Pisana (MPi), Pontremolese (Pon), Asturiana de la Montaña (AMo) and Argentinean Creole (ACr).

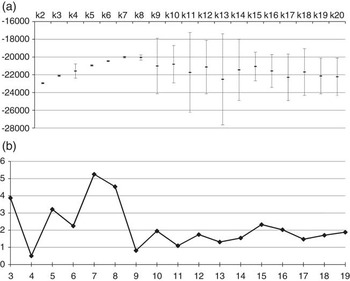
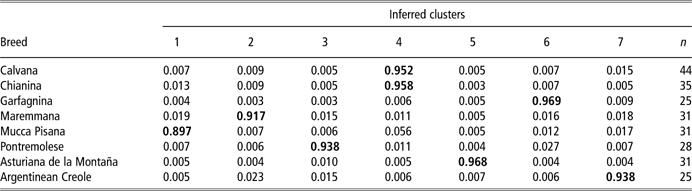
Population structure and degree of admixture were assessed using the program STRUCTURE. The most likely number of clusters (K) present in the dataset was ascertained using 50 different runs of the program. In K = 7, the across-run average ln Pr(G|K) was very close to maximum and the mean variance of the ln Pr(G|K) estimates was very low (Figure 3A); furthermore, ΔK reached its maximum for K = 7 (Figure 3B) and the similarity of the outcomes of individual runs was equal to 0.90 when the second higher average pairwise similarity was only equal to 0.78 for K = 2. Table 3 presents the membership (in percentage) of each of the analyzed cattle breeds in each of the seven most likely clusters inferred using the program STRUCTURE. Each of the analyzed breed clustered separately in one inferred cluster, except for the Calvana and Chianina breeds, which were basically included in Cluster 4; furthermore, all the individuals were assigned at their specific cluster with a threshold not below 0.60, except for one animal of the Mucca Pisana breed.
The most likely number of clusters (K) in the analyzed dataset. Plot (a) presents the ln Pr(G|K) values as a function of the number of clusters for each of the 50 runs carried out for each K value using the program STRUCTURE. Variation of the average ln Pr(G|K) values for each K is shown as a black line. (b) Plot of ΔK as the mean of the absolute values of L″(K) averaged over 50 runs divided by the standard deviation of L(K), ΔK = m(|L″(K)|)/s[L(K)], between successive K values.

Number of individuals per breed (n) and proportion of membership of each of the analyzed cattle breeds in each of the seven most likely clusters inferred using the program STRUCTURE
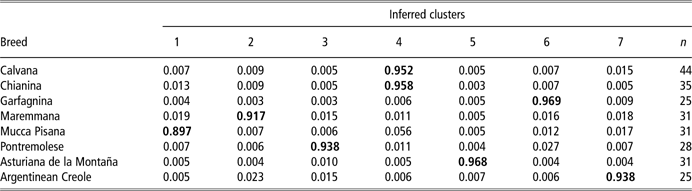
Memberships higher than 0.1 are in bold.
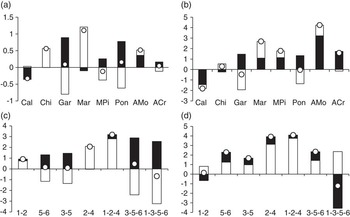
Changes in metapopulation diversity were first computed after excluding each analyzed breed (Figure 4A and B). The results obtained were consistent across the methodologies used. Note that, for clarity, both positive contributions to diversity assessed using Petit et al. (Reference Petit, El Mousadik and Pons1998) and Caballero and Toro's (Reference Caballero and Toro2002) methods indicate that the population excluded would be preferred for conservation. The two outgroup breeds (Asturiana de la Montaña and Argentinean Creole) mainly based their contributions on the between-breed differentiation. With respect to the Tuscan cattle breeds, the Maremmana made the highest contributions to diversity. However, the contribution of the Maremmana breed to allelic frequencies is mainly due to the within-breed diversity, whereas that to the allelic richness is more dependent on the between-breed differentiation. The endangered Tuscan breeds (Calvana, Garfagnina, Mucca Pisana and Pontremolese) made null or negative contributions to diversity, except for the Mucca Pisana contribution to allelic richness (C T = 1.8%). The Calvana breed made null or negative within-breed contributions ( = 0.0%; C W = −0.4%). The Garfagnina and Pontremolese breeds made positive contributions to between-breed diversity but negative and high within-breed contributions, thus suggesting a population bottleneck with allelic losses and an increase of homozygosity in the population.
Bar graphs summarizing the contributions to the overall diversity of the cattle breeds included in the dataset analyzed. Contributions to within-breed diversity are in open boxes, contributions to between-breed diversity are in black boxes and total contributions to diversity are in gray circles. Plot (a) shows the contributions of each individual breed to molecular coancestry. Plot (b) shows the contributions of each individual breed to allelic richness. Plots (c) and (d) show the contribution of different groups of Tuscan breeds to, respectively, molecular coancestry and allelic richness. Abbreviations and numbers correspond to Calvana (1. Cal), Chianina (2. Chi), Garfagnina (3. Gar), Maremmana (4. Mar), Mucca Pisana (5. MPi), Pontremolese (6. Pon), Asturiana de la Montaña (AMo) and Argentinean Creole (ACr).

Non-independency of the genetic background was tested by pooling different set of breeds to carry out a combined quantification of their contributions to diversity (Figure 4C and D). Note that, in contrast to the method of Caballero and Toro (Reference Caballero and Toro2002), the assessment of diversity via rarefacted allelic richness (Petit et al., Reference Petit, El Mousadik and Pons1998) does not use the entire remaining dataset as the basis of computations but the individual breed; therefore, contributions to allelic richness explained by a group of breeds cannot be straightforwardly assessed. Pooling the breeds to be excluded as a single breed is only an approximation that assumes the risk of artificially inflating the diversity of the new-composite population. The total joint contribution to diversity of the expectedly ‘Aurochs’ derived (Chianina and Maremmana) breeds was similar to the value obtained on summing up the values of the total contributions of the individual breeds; similar values were also obtained for ‘Non-Tuscan’ (Mucca Pisana and Pontremolese) and Brown Swiss introgressed (Garfagnina and Mucca Pisana) groups. However, this is not the case for the B. primigenius-derived (Calvana and Chianina) breeds, showing that their genetic background cannot be assessed independently. The highest losses of diversity arose when the breeds of the presumed Tuscan origin were excluded from the dataset even if the contribution of the Calvana breed was negligible. Interestingly, excluding the four endangered Tuscan cattle breeds did not yield losses in genetic diversity ( = −0.7%; C T = −1.2%), whereas excluding the non-endangered breeds (Chianina and Maremmana) did (
 = 2.1%; C T = 3.9%); it is noteworthy that the simple exclusion of the Calvana breed from the former group led to losses in genetic diversity (
 = 0.47%; C T = 2.34%). Therefore, this breed could gather some genetic uniqueness.
Discussion
The overall differentiation assessed in the entire dataset was higher than most other studies carried out on European cattle. Ciampolini et al. (Reference Ciampolini, Cetica, Ciani, Mazzanti, Fosella, Marroni, Biagetti, Sebastiani, Papa, Filippini, Cianci and Presciuttini2006), in four large-sized European cattle breeds, reported an F ST value of 0.089; Jordana et al. (Reference Jordana, Alexandrino, Beja-Pereira, Bessa, Cañon, Carretero, Dunner, Laloë, Moazami-Goudarzi, Sanchez and Ferrand2003), analyzing 18 local Southwest European beef cattle breeds, reported an overall F ST value of 0.068; Martín-Burriel et al. (Reference Martín-Burriel, Rodellar, Lenstra, Sanz, Cons, Osta, Reta, De Argüello, Sanz and Zaragoza2007), analyzing 7 Spanish endangered cattle breeds, found an overall F ST value of 0.096; and more recently, Ginja et al. (Reference Ginja, Gama and Penedo2010a), studying the genetic structure of 13 Portuguese cattle, found an F ST value of 0.081. The high differentiation found in the current study is basically dependent on the extant differentiation among Tuscan cattle breeds and not on the presence of two outgroup populations. This suggests that most analyzed cattle breeds gather well-differentiated genetic backgrounds.
In terms of genetic variability, the endangered populations were less diverse, probably due to the reduced number of animals still alive, but the values found for F IS, close to zero and substantially similar between endangered and not-endangered breeds, demonstrated the effectiveness of the breeding strategies adopted currently. The differentiated background of the breeds is also supported by the molecular coancestry and the STRUCTURE analyses. The two terms of the formula used to compute the kinship distance, D k = ([si + sj]/2)−fij (Caballero and Toro, Reference Caballero and Toro2002), summarize the between-population differentiation after their separation (term [si + sj]/2) corrected by the genetic identity of the populations at the time of the original (ancestral) metapopulation fission (fij; Eding and Meuwissen, Reference Eding and Meuwissen2001). A simple comparison of bidimensional scaling plots constructed using D k and 1−fij illustrates that the present differentiation of the analyzed populations is (except for the Garfagnina breed) dependent on the ancestral differentiation component (Álvarez et al., Reference Álvarez, Gutiérrez, Royo, Fernández, Gómez, Arranz and Goyache2005). This ancestral origin emerges from the differentiation of the three ‘Tuscan’ cattle (Chianina, Maremmana and Calvana) from the other investigated breeds (Figure 2); similarly, the two outgroup breeds are placed in a specific quadrant. This simple approach to ascertain evolutionary processes has been used recently in horses by Kakoi et al. (Reference Kakoi, Tozaki and Gawahara2008) but also in wild animal populations (Royo et al., Reference Royo, Pajares, Álvarez, Fernández and Goyache2007).
The results obtained using the program STRUCTURE also suggested that, except for the Calvana and Chianina breeds, the genetic background of the present-day Tuscan breeds is quite different from the background based on historical references. The genetic relationships between the Calvana and Chianina breeds are supported by large historical references (Balducci, Reference Balducci1920; Petrucci, Reference Petrucci1926) and have been highlighted previously using amplified fragment length polymorphism (Negrini et al., Reference Negrini, Milanesi, Bozzi, Pellecchia and Ajmone-Marsan2006). This historical relationship may have been reinforced by the use of a limited number of Chianina sires on Calvana cows during the recovery process of the latter breed (Negrini et al., Reference Negrini, Milanesi, Bozzi, Pellecchia and Ajmone-Marsan2006).
Characteristics of the methods quantifying diversity
Irrespective of the method used to quantify diversity, its results are always dependent on the dataset assessed. In our analyses besides the Tuscan breeds, we have included two unrelated cattle populations that are expected to represent the non-Tuscan cattle genetic background. However, further addition of other cattle populations could substantially modify the results obtained. This would be particularly true if these additional populations increased the frequency of poorly represented alleles in the current dataset. In this new scenario, there would be a decrease in the importance of those breeds that are now considered more diverse. Therefore, the results can only be interpreted in a Tuscan framework.
The two methods applied for quantifying contributions to diversity are based on variances. They may consequently yield negative contributions to total diversity (Petit et al., Reference Petit, El Mousadik and Pons1998; Caballero and Toro, Reference Caballero and Toro2002; Ollivier and Foulley, Reference Ollivier and Foulley2005). In fact, when a group of individuals is excluded from a dataset, the remaining genetic variability could increase if the genetic background of the excluded individuals is still represented in the conserved group. From a theoretical point of view (Caballero and Toro, Reference Caballero and Toro2002), the remaining genetic variability could increase as long as the excluded individuals can be substituted by other more appropriate (diverse) ones.
Moreover, the methods applied explicitly use the within-(sub)population genetic variability, which is important in conservation (Caballero and Toro, Reference Caballero and Toro2002; Ollivier and Foulley, Reference Ollivier and Foulley2005). This allows to characterize accurately the genetic scenario of the assessed breeds. The Garfagnina and Pontremolese breeds were low diverse–highly differentiated populations at both the molecular coancestry and the allelic richness levels. This shows that these populations underwent an intense population bottleneck affecting genetic diversity. The other two endangered Tuscan cattle breeds have different scenarios: the Mucca Pisana breed makes negative within- and between-population contributions to molecular coancestry but positive contributions to allelic richness, whereas the Calvana breed was a low diverse–low differentiated population for the two assessment methodologies. The population bottleneck that these two breeds underwent is reflected at the gene frequency level (molecular coancestry). However, the Mucca Pisana breed still gathers rare alleles, probably of Brown Swiss origin, that have low representation in the dataset. On the contrary, most alleles carried by the Calvana breed are also present in the Chianina breed, making the former breed less important to maintain diversity. The contributions to diversity of the two non-endangered Tuscan breeds (Chianina and Maremmana) are mainly based on their contributions to internal diversity for both allelic frequencies and allelic richness. They represent relatively large populations where the effect of drift is small; also, they are likely to have introgressed to some extent at least two of the other breeds, namely Calvana and Mucca Pisana, with some effect on the gene pool.
Insights for Tuscan cattle conservation
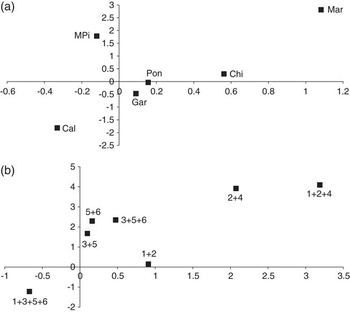
In conservation genetics, it is generally assumed that genetic variability, usually assessed as gene diversity, is beneficial to enhance population survival. Another important aspect of prioritizing populations for conservation is their genetic uniqueness or distinctiveness. Hence, it is relevant to evaluate both these parameters for population conservation as clearly stated by Ginja et al. (Reference Ginja, Penedo, Sobral, Matos, Borges, Neves, Rangel-Figuereido and Cravador2010b), but considerable controversy exists on the relative weights of diversity and uniqueness components (Ollivier and Foulley, Reference Ollivier and Foulley2005; Pertoldi et al., Reference Pertoldi, Bijlsma and Loeschcke2007). The simplest way to face this problem is to add the total contributions computed for allelic frequencies and allelic richness for each assessed population (Figure 5). From a strictly genetic point of view, the endangered Tuscan cattle population that should be preferred for conservation would be the Mucca Pisana breed, but it should be kept in mind that this positive contribution could be due to rare (in this context) alleles of Brown Swiss origin as mentioned before. This breed contributed to the entire gene diversity and allelic richness of the Tuscan cattle metapopulation (Figure 5A), resembling the scenario of the non-endangered Chianina and Maremmana breeds. In turn, the Garfagnina and Pontremolese genetic scenarios would justify the implementation of conservation strategies: genetic drift has drastically decreased the genetic variability of these breeds but they still conserve a part of their unique original genetic background (positive contributions to allelic richness). The gene diversity values found for Calvana breed allows questioning the viability of the breed and therefore the interest of dedicating conservation efforts to it.
Two-dimensional plot summarizing the total contributions to molecular coancestry (X-axis) and allelic richness (Y-axis) of the analyzed Tuscan cattle breeds. Plot (a) contributions of each individual breed; plot (b) contributions obtained grouping different sets of Tuscan breeds. Abbreviations and numbers correspond to Calvana (1. Cal), Chianina (2. Chi), Garfagnina (3. Gar), Maremmana (4. Mar), Mucca Pisana (5. MPi) and Pontremolese (6. Pon).

However, experience with the Calvana breed highlights that conservation decisions should not be implemented considering only the information provided by a single breed. The analyses carried out here pointed out that Tuscan cattle breeds gather particular genetic backgrounds, except for the Calvana and Chianina breeds. In these breeds, conservation should be implemented considering both populations together and, if conservation decisions would be based solely on genetic diversity, the Calvana breed has to be considered replaceable by Chianina. However, this should be considered with caution. As stated recently for the Algarvia cattle breed by Ginja et al. (Reference Ginja, Penedo, Sobral, Matos, Borges, Neves, Rangel-Figuereido and Cravador2010b), within the Calvana breed, there may still exist individuals representative of the ancestral population from which the Calvana and Chianina breeds have arisen. Figure 5B shows how the sum of the genetic data from Calvana and Chianina breeds makes positive, although small in the case of allelic richness, contributions to genetic diversity. As a result of the genetic independency of most Tuscan genetic stock, most cattle breed combinations fitted according to expected genetic origins or production or risk scenarios of the assessed breeds made positive contributions to the overall diversity of the breeds. The most intriguing result from this assessment is that the combined elimination of the four endangered cattle breeds would not produce genetic erosion of the Tuscan cattle stock. In fact, the larger cattle populations (Chianina and Maremmana) gather most genetic diversity in terms of both allele frequencies and (in the case of Maremmana) allelic richness. Does it mean that the non-implementation of conservation strategies for endangered Tuscan cattle can be genetically justified? Before answering this question, the limitations of the available methods for measuring genetic diversity must be carefully considered. Giving the same weight to the between- and within-population diversity could favor large or non-endangered populations (Meuwissen, Reference Meuwissen2009). Genetic diversity is only one of the motives for conserving a breed. There are many other reasons supporting the implementation of livestock preservation programs such as the cultural importance of the populations (Gandini and Villa, Reference Gandini and Villa2003), economical issues (Simianer et al., Reference Simianer, Reist-Marti, Gibson, Hanotte and Rege2003) or the extinction probabilities of a given breed (Reist-Marti et al., Reference Reist-Marti, Simianer, Gibson, Hanotte and Rege2003; Gandini et al., Reference Gandini, Ollivier, Danell, Distl, Georgoudis, Groeneveld, Martyniuk, van Arendonk and Woolliams2004). Although the breed is the basic unit of conservation in livestock, genetic analyses may also highlight the possibility of implementing conservation strategies considering groups of breeds rather than single-isolated populations.
In summary, we have shown how quantifying diversity in terms of both allelic frequencies and allelic richness, but also in terms of within-population diversity and between-population differentiation, provides different and complementary information on the assessed genetic backgrounds and may help to implement priorities and strategies for conservation in livestock.
Acknowledgments
This work was partially funded by grants from CORAF/WECARD no. 03/GRN/16 and from ARSIA/Regione Toscana. The authors thank ANABIC for providing the samples.