1. Introduction
Nematic liquid crystals are complex fluids distinguished by the spontaneous collective alignment of their constituent molecules (De Gennes & Prost Reference De Gennes and Prost1993; Muševič et al. Reference Muševič, Skarabot, Tkalec, Ravnik and Zumer2006; Collings & Goodby Reference Collings and Goodby2019). This anisotropic order imparts unique rheological properties and enables tunable optical, electrical and mechanical responses under external fields such as electric or magnetic fields (Nych et al. Reference Nych, Ognysta, Škarabot, Ravnik, Žumer and Muševič2013; Stewart Reference Stewart2019; Zhang et al. Reference Zhang, Zhang, Han, Yang, Li, Song and Zhu2023). These properties underpin their widespread applications in display technologies, sensors and biomedical systems (Chen et al. Reference Chen, Lee, Lin, Chen and Wu2018; Choi et al. Reference Choi, Choi, Choi, Oh, Cho, Im and Kim2023; Zhang et al. Reference Zhang, Zhang, Han, Yang, Li, Song and Zhu2023; Pusenkova et al. Reference Pusenkova, Bagramyan, Larochelle, Galstian and Galstian2025). Elastic stresses arise when the director field undergoes splay, bend or twist deformations (Foffano et al. Reference Foffano, Lintuvuori, Tiribocchi and Marenduzzo2014), while discontinuities in the director field generate topological defects that mediate long-range elastic interactions and strongly influence the evolution of composite structures (Wood et al. Reference Wood, Lintuvuori, Schofield, Marenduzzo and Poon2011; Serra et al. Reference Serra, Lemma, Giomi, Dogic and Mahadevan2023). Such defect-mediated mechanisms enable the directed assembly of ordered architectures such as photonic crystals, particle transport systems and colloidal arrays (Lavrentovich Reference Lavrentovich2014; Peng et al. Reference Peng, Turiv, Guo, Wei, Lavrentovich and Phillips2016; Hogan et al. Reference Hogan, Kovalska, Craciun and Baldycheva2017; Wamsler, Head & Shendruk Reference Wamsler, Head and Shendruk2024; Hassan, Al-Mfrji & Mahmood Reference Hassan, Al-Mfrji and Mahmood2025). Recent advances in micromanipulation techniques have further enhanced control over liquid-crystal-based particle assemblies. By tailoring boundary conditions or surface anchoring, particles act as mobile inclusions that perturb the surrounding director field. This tuning of interparticle interactions promotes self-assembly into functional materials with prescribed properties (Muševič Reference Muševič2017; Smalyukh Reference Smalyukh2018; Guo et al. Reference Guo, Jiang, Afghah, Peng, Selinger, Lavrentovich and Wei2024).
In contrast to nematic fluids, particle–fluid interactions in Newtonian and viscoelastic media have been extensively studied, particularly in the context of sedimentation. In Newtonian fluids, Stokes (Reference Stokes2009) derived the settling velocity of an isolated particle at low Reynolds numbers (Re), while Richardson & Zaki (Reference Richardson and Zaki1954) established the hindered settling law for suspensions, later extended to finite Re (Garside & Al-Dibouni Reference Garside and Al-Dibouni1977; Di Felice Reference Di Felice1999; Yin & Koch Reference Yin and Koch2007). Increasing particle volume fraction generally reduces the mean settling velocity, a consequence of hydrodynamic hindrance caused by the downward entrainment of fluid and the resulting compensating upward flux (Di Felice Reference Di Felice1999). At low concentrations, Batchelor (Reference Batchelor1972) showed that the mean settling velocity decreases linearly with volume fraction. At moderate to high Re, anisotropic microstructures induced by wake interactions give rise to drafting–kissing–tumbling (DKT) dynamics (Yin & Koch Reference Yin and Koch2007; Uhlmann & Doychev Reference Uhlmann and Doychev2014). The DKT process is a classical hydrodynamic phenomenon for settling spheres: during the ‘drafting’ stage, a trailing particle is drawn into the low-drag wake of a leading particle and accelerates. This velocity difference inevitably leads to the ‘kissing’ stage, where the particles make contact to form a vertical pair aligned with gravity. However, because this configuration is hydrodynamically unstable, the pair subsequently undergoes ‘tumbling’ and separates laterally (Fortes, Joseph & Lundgren Reference Fortes, Joseph and Lundgren1987; Glowinski et al. Reference Glowinski, Pan, Hesla, Joseph and Periaux2001). Under this wake-driven dynamics, particles aggregate at low volume fractions due to shear-induced entrainment (Zaidi, Tsuji & Tanaka Reference Zaidi, Tsuji and Tanaka2014). As Re decreases, these clusters break down into pairs, maintaining DKT interactions provided that inertia remains sufficiently large (Zaidi, Tsuji & Tanaka Reference Zaidi, Tsuji and Tanaka2015). Increasing concentration suppresses such inertial aggregation and enhances hindered settling (Yin & Koch Reference Yin and Koch2007). At low Re and higher concentrations, weakened wakes favour ordered particle alignments over aggregation (Zaidi et al. Reference Zaidi, Tsuji and Tanaka2014, Reference Zaidi, Tsuji and Tanaka2015).
Sedimentation in viscoelastic fluids exhibits fundamentally different dynamics. Elastic stresses generate hydrodynamic instabilities, promoting the formation of aggregates in the form of chains or columnar structures (Bobroff & Phillips Reference Bobroff and Phillips1998; Yu et al. Reference Yu, Phan-Thien, Fan and Tanner2002; Vishnampet & Saintillan Reference Vishnampet and Saintillan2012). Such aggregates can significantly enhance settling velocities relative to Newtonian suspensions. Feng, Hu & Joseph (Reference Feng, Hu and Joseph1994) identified a critical elastic stress ratio for the onset of aggregation, while Phillips (Reference Phillips2010) described sedimentation instabilities as a competition between aggregation and hydrodynamic dispersion. Vishnampet & Saintillan (Reference Vishnampet and Saintillan2012) demonstrated that spherical suspensions are unstable to concentration fluctuations in weakly viscoelastic fluids, with clusters forming vertical columns as the Deborah number approaches unity, thereby increasing the mean settling velocity. Pan & Glowinski (Reference Pan and Glowinski2017) demonstrated that the ability to form long-range particle chains is dependent on the polymer extension limit. Murch & Shaqfeh (Reference Murch and Shaqfeh2020) further observed rapidly settling chains and recirculation zones depleted of particles, resulting in mean settling velocities that are substantially higher than those in Newtonian fluids.
Over the past few decades, studies of colloidal self-organisation in liquid-crystal media have been extensive (Aplinc, Pusovnik & Ravnik Reference Aplinc, Pusovnik and Ravnik2019; Guo et al. Reference Guo, Jiang, Afghah, Peng, Selinger, Lavrentovich and Wei2024), whereas investigations of particle sedimentation in nematic liquid crystals have remained relatively limited. In this context, sedimentation refers to the gravity-driven collective motion of particles, which involves a complex dynamic coupling between particle translation, fluid shear and nematic director distortions. The settling velocity
 $\langle U \rangle$
is defined as the ensemble-averaged vertical velocity sampled during the statistically steady state, where the net gravitational driving force is balanced by the total hydrodynamic and elastic resistance. This additional elastic resistance arises because immersed particles disrupt the nematic director field, generating topological defects that mediate long-range interactions (Wood et al. Reference Wood, Lintuvuori, Schofield, Marenduzzo and Poon2011). The defect morphology is governed by surface anchoring: planar anchoring produces boojums at the poles (Poulin & Weitz Reference Poulin and Weitz1998), while homeotropic anchoring induces Saturn rings around the equator (Araki & Tanaka Reference Araki and Tanaka2006; Wood et al. Reference Wood, Lintuvuori, Schofield, Marenduzzo and Poon2011). Such defects generate quadrupolar distortions, giving rise to quadrupolar interactions. Their merging or entanglement can yield diverse metastable structures, with the anchoring strength and defect topology directly modulating the interaction intensity (Ravnik et al. Reference Ravnik, Škarabot, Žumer, Tkalec, Poberaj, Babič and Muševič2007; Ravnik & Žumer Reference Ravnik and Žumer2009). Muševič et al. (Reference Muševič, Skarabot, Tkalec, Ravnik and Zumer2006) showed that nematic ordering supports both weakly bound two-dimensional lattices and strongly bound dipolar chains. Ravnik et al. (Reference Ravnik, Škarabot, Žumer, Tkalec, Poberaj, Babič and Muševič2007) demonstrated, experimentally and theoretically, that local thermal quenching of thin nematic films produces colloidal dimers and linear arrays linked by entangled defect rings. Randomly dispersed particles, such as those accompanied by Saturn rings, also tend to evolve towards lower-energy states, forming more stable aggregates (Araki & Tanaka Reference Araki and Tanaka2006; Wood et al. Reference Wood, Lintuvuori, Schofield, Marenduzzo and Poon2011). Mozaffari et al. (Reference Mozaffari, Babadi, Fukuda and Ejtehadi2011) studied spheroidal particles with planar anchoring and found that small orientation angles and separations break the axial symmetry of paired defects, giving rise to attractive interactions. More recently, Wang, Zhang & Chen (Reference Wang, Zhang and Chen2018) examined spherical particles under strong homeotropic anchoring and identified a variety of possible three-dimensional colloidal crystal configurations, together with their most stable states. Nematic liquid crystals can be viewed as viscoelastic fluids. However, their particle interactions are additionally governed by anisotropic elasticity and defect-mediated forces, rendering their behaviour fundamentally distinct from that of isotropic suspensions (Ye, Ouyang & Lin Reference Ye, Ouyang and Lin2025). While defects are known to drive colloidal self-organisation, their impact on the collective sedimentation of particle ensembles remains poorly understood. Because sedimentation couples hydrodynamic interactions with defect-induced elasticity, systematic studies are needed to bridge single-particle behaviour and the emergent dynamics of suspensions.
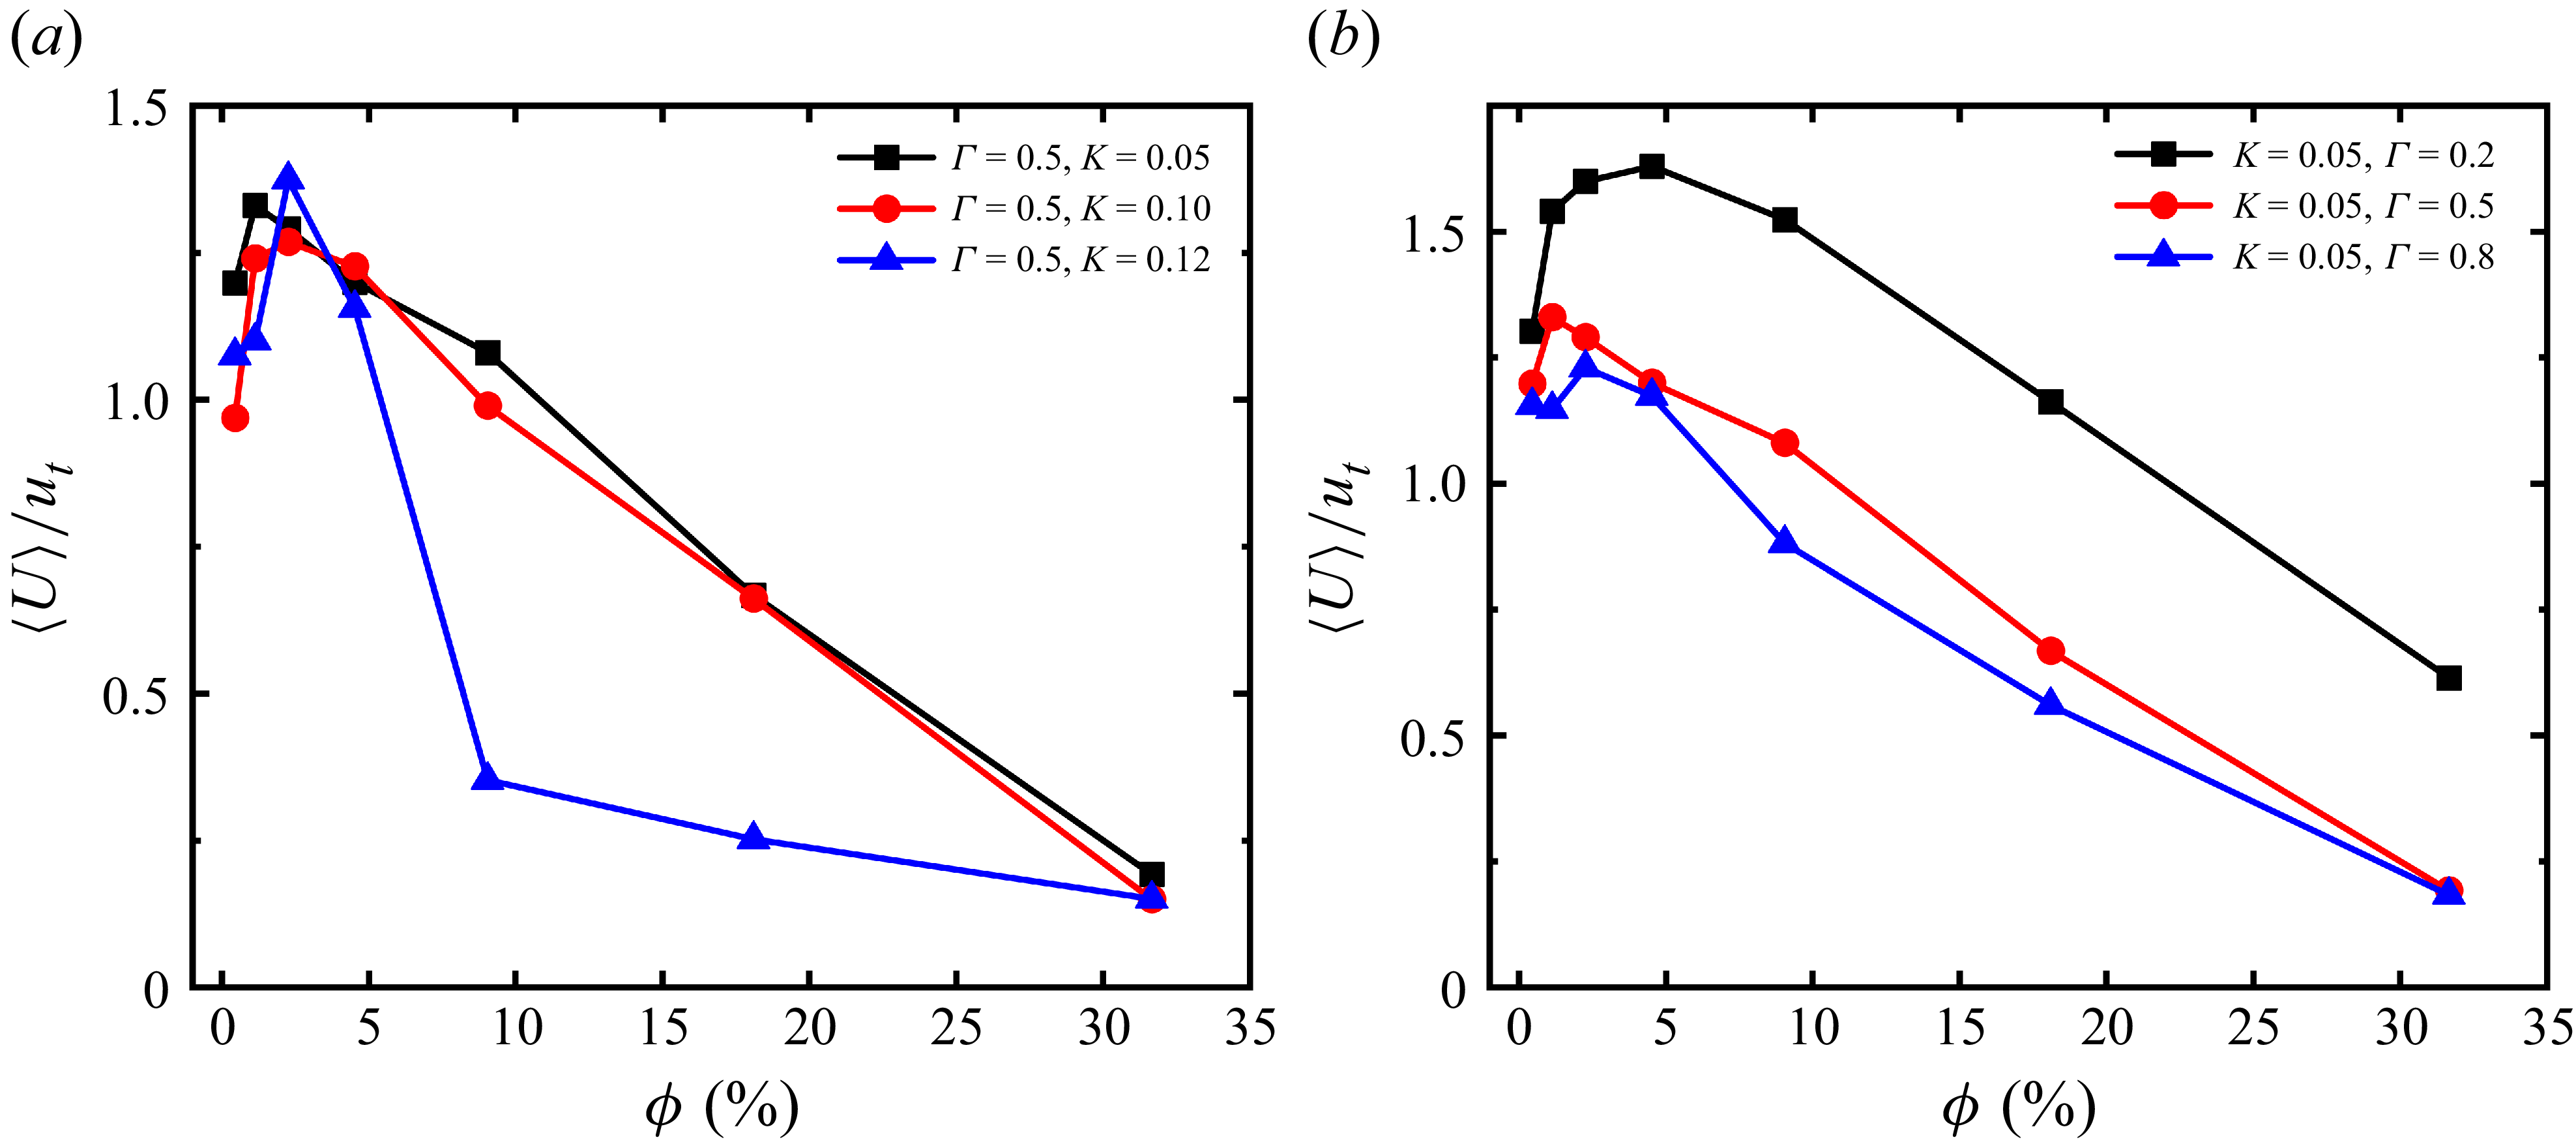
This work aims to elucidate the mechanisms governing the sedimentation of spherical particles in nematic liquid crystals, with particular emphasis on how volume-fraction-dependent aggregation dynamics and microstructural evolution influence the settling velocity. The remainder of the paper is structured as follows. Section 2 introduces the nematic phase model, flow geometry, boundary conditions and particle collision model. In § 3, we simulate the sedimentation of individual spherical particles and groups of particles in a Newtonian fluid, comparing our results with those of existing studies to validate our numerical procedures. Section 4 presents the primary sedimentation results in nematic liquid crystals. Specifically, § 4.1 highlights the non-monotonic variation of the mean settling velocity with volume fraction, examining the regulatory roles of anchoring conditions and rotational diffusion. Sections 4.2 and 4.3 quantify the spatial distribution of the particle clusters and their relative motion with the fluid, directly linking local aggregation to enhanced settling velocities (the ‘swarm effect’). Finally, § 4.4 characterises the microstructures formed by the particles, identifying specific defect-stabilised configurations that dictate the macroscopic dynamics. Section 5 summarises the findings and conclusions. Finally, the appendices provide supplementary analyses, which include a detailed parametric study of the elastic and rotational diffusion constants (K and Γ), quantitative assessments of defect volumes and effective frontal areas and an analysis of defect detachment dynamics and topological stability.
2. Theory and problem
2.1. Landau–de Gennes free energy
The nematic system is described by the standard fluid-dynamics equations for nematic fluids (de Gennes & Prost Reference De Gennes and Prost1993; Hernández-Ortiz et al. Reference Hernández-Ortiz, Gettelfinger, Moreno-Razo and de Pablo2011; Ravnik & Žumer Reference Ravnik and Žumer2009; Chandler & Spagnolie Reference Chandler and Spagnolie2024). Molecules in nematic liquid crystals are predominantly rod-like or filamentous and exhibit orientational order. The orientational order of nematic liquid crystals is characterised by the second-order tensor Q . In uniaxial nematics, Q = 3q/2( nn − I /3), where q is the largest eigenvalue of Q and serves as the scalar order parameter; n is the unit vector representing the local average molecular orientation (the director); and I is the identity tensor corresponding to the isotropic state.
The thermodynamic equilibrium state of a nematic liquid crystal is governed by the total Landau–de Gennes free energy of the system. Following the rigorous theoretical framework outlined by Chandler & Spagnolie (Reference Chandler and Spagnolie2024), to maintain dimensional consistency, the total system energy E must be explicitly defined as the sum of a volume integral over the fluid domain Ω and a surface integral over the boundaries ∂Ω:
 \begin{equation} E=\int _{\varOmega }\left(\mathrm{\mathcal{F}}_{b}+\mathrm{\mathcal{F}}_{el}\right)\,{\rm d}V+\oint _{\partial \varOmega }\mathrm{\mathcal{F}}_{s}\,{\rm d}A, \end{equation}
where
 $\mathcal{F}_b$
and
 $\mathcal{F}_{el}$
represent the bulk thermotropic and elastic distortion free energy densities per unit volume, respectively. The term
 $\mathcal{F}_s$
denotes the surface free energy density per unit area, which dictates the specific anchoring conditions at the colloid–fluid interfaces. Consequently, the local bulk free energy density, which governs the bulk nematic dynamics in the subsequent equation (2.11), is strictly defined as
 $\mathcal{F}=\mathcal{F}_b + \mathcal{F}_{el}$
.
The bulk term is given by
 \begin{equation} \mathrm{\mathcal{F}}_{b}=\frac{A_{0}}{2}\left(1-\frac{\gamma }{3}\right)Q_{\alpha \beta }Q_{\beta \alpha }-\frac{A_{0}\gamma }{3}Q_{\alpha \beta }Q_{\beta \delta }Q_{\delta \alpha }+\frac{A_{0}\gamma }{4}\left(Q_{\alpha \beta }Q_{\beta \alpha }\right)^{2}, \end{equation}
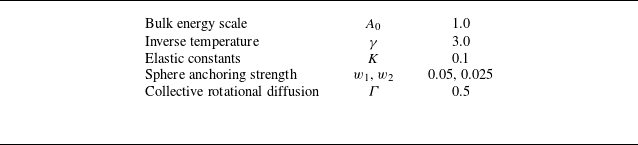
where A 0 is a constant determining the system’s energy scale, while γ is a pseudo-temperature parameter governing phase transition. This parametrisation is characteristic of a thermotropic liquid-crystal system, which exhibits a nematic phase when γ ≥ 2.8; therefore, γ = 3.0 was selected as the parameter for this study (Doi & Edwards Reference Doi and Edwards1988; Beris & Edwards Reference Beris and Edwards1994; Hernández-Ortiz et al. Reference Hernández-Ortiz, Gettelfinger, Moreno-Razo and de Pablo2011).
The elastic free energy density is expressed as
 \begin{equation} \mathrm{\mathcal{F}}_{el}=\frac{K}{2}\left(\partial _{\beta }Q_{\alpha \beta }\right)\left(\partial _{\gamma }Q_{\alpha \gamma }\right)\!, \end{equation}
where K is the elastic constant (one-constant approximation). Here, Greek indices denote spatial components in the Cartesian coordinate system, and repeated indices imply summation. Finally, the surface free energy density accounts for preferential molecular alignment at colloidal surfaces or confining walls:
 \begin{equation} \mathrm{\mathcal{F}}_{s}=\frac{1}{2}w\left(Q_{\alpha \beta }-{Q}_{\alpha \beta }^{0}\right)\left(Q_{\alpha \beta }-{Q}_{\alpha \beta }^{0}\right)\!, \end{equation}
where
 $w$
is the anchoring strength and
 ${Q}_{\alpha \beta }^{0}$
denotes the preferred orientation. The parameter
 $w$
quantifies the interaction strength between the liquid crystal molecules and the particle surface, determining the extent to which the boundary orientation aligns with
 ${Q}_{\alpha \beta }^{0}$
. We set
 $w$
1 = 0.05 and
 $w$
2 = 0.025 to ensure a sufficient anchoring regime for the stable excitation of boojum and Saturn-ring defects. For planar anchoring, the preferred molecular orientation aligns within the local tangent plane of the curved surface, whereas for homeotropic anchoring, the molecules prefer a perpendicular orientation to the particle surface (Fournier & Galatola Reference Fournier and Galatola2005):
 \begin{equation} \mathrm{\mathcal{F}}_{s}=\frac{w_{1}}{2}\left(\tilde{Q}_{\alpha \beta }-{\tilde{Q}}_{\alpha \beta }^{\bot }\right)\left(\tilde{Q}_{\alpha \beta }-{\tilde{Q}}_{\alpha \beta }^{\bot }\right)+\frac{w_{2}}{2}\left(\tilde{Q}_{\alpha \beta }\tilde{Q}_{\alpha \beta }-{S}_{0}^{2}\right)\left(\tilde{Q}_{\alpha \beta }\tilde{Q}_{\alpha \beta }-{S}_{0}^{2}\right)\!, \end{equation}
where S
0 is the fixed surface amplitude, and second-order tensors
 $\tilde{\kern-2.5pt\boldsymbol{Q}}$
and
 $\tilde{\kern-2.5pt\boldsymbol{Q}}^{\bot }$
enforce alignment within the tangent plane while preserving nematic order, and are given by
 \begin{align} \tilde{Q}_{\alpha \beta }&=Q_{\alpha \beta }+\frac{1}{3}\delta _{\alpha \beta }S_{0}, \end{align}
 \begin{align} {\tilde{Q}}_{\alpha \beta }^{\bot }&=P_{\alpha \mu }Q_{\mu \nu }P_{\upsilon \beta }, \end{align}
where Pαβ = δ αβ − nαnβ denotes the projection onto the tangent plane and n α denotes the surface-normal direction.
Applying the Euler–Lagrange formalism to the total free energy yields the generalised three-dimensional boundary conditions for the tensor Q at the particle surfaces (Chandler & Spagnolie Reference Chandler and Spagnolie2024). Specifically, minimising the sum of the elastic and surface free energies leads to
 \begin{equation} \left(n_{\gamma }\frac{{\partial }\mathrm{\mathcal{F}}}{{\partial }(\partial _{\gamma }Q_{\alpha \beta })}+\frac{{\partial }\mathrm{\mathcal{F}}_{s}}{{\partial }Q_{\alpha \beta }}\right)-\frac{\delta _{\alpha \beta }}{3}\mathrm{Tr}\left(n_{\gamma }\frac{{\partial }\mathrm{\mathcal{F}}}{{\partial }(\partial _{\gamma }Q_{\alpha \beta })}+\frac{{\partial }\mathrm{\mathcal{F}}_{s}}{{\partial }Q_{\alpha \beta }}\right)=0,\, \end{equation}
where
 $\partial _{\gamma }Q_{\alpha \beta }={\partial }Q_{\alpha \beta }/{\partial }x_{\gamma }$
.
2.2. Beris–Edwards equation and nematic model
The temporal evolution of the orientational order parameter Qαβ in flowing nematic liquid crystals is governed by the Beris–Edwards equation (Beris & Edwards Reference Beris and Edwards1994):
 \begin{equation} \left({\partial }_{t}+u_{\gamma }{\partial }_{\gamma }\right)Q_{\alpha \beta }-S_{\alpha \beta }\left(\boldsymbol{W},\boldsymbol{Q}\right)=\varGamma\! H_{\alpha \beta }, \end{equation}
where, u γ denotes the fluid velocity; Sαβ represents the shear response; W is the velocity gradient tensor; Γ is the collective rotational diffusion constant controlling relaxation towards the minimum free energy; and H is the molecular field. The shear term S is expressed as
 \begin{align} S_{\alpha \beta }\left(\boldsymbol{W},\boldsymbol{Q}\right)&=\left(\xi D_{\alpha \pi }+\varOmega _{\alpha \pi }\right)\left(Q_{\pi \beta }+\frac{1}{3}\delta _{\pi \beta }\right)+\left(Q_{\alpha \pi }+\frac{1}{3}\delta _{\alpha \pi }\right)\left(\xi D_{\pi \beta }-\varOmega _{\pi \beta }\right)\nonumber\\&\quad -2\xi \left(Q_{\alpha \beta }+\frac{1}{3}\delta _{\alpha \beta }\right)Q_{\pi \sigma }W_{\sigma \pi }, \end{align}
with Dαβ = (1/2)(Wαβ + Wβα ) and Ωαβ = (1/2)(Wαβ − Wβα ) denoting the symmetric strain-rate and antisymmetric vorticity tensors, respectively. The parameter ξ controls whether the nematic fluid tumbles or aligns in shear, reflecting the effective aspect ratio of the molecules. The molecular field H , driving relaxation of Q αβ , is the functional derivative of the Landau–de Gennes free energy with respect to Q αβ :
 \begin{equation} H_{\alpha \beta }=-\frac{\delta \mathrm{\mathcal{F}}}{\delta Q_{\alpha \beta }}+\frac{\delta _{\alpha \beta }}{3}\mathrm{Tr}\frac{\delta \mathrm{\mathcal{F}}}{\delta Q_{\alpha \beta }}. \end{equation}
Its explicit form is
 \begin{align} H_{\alpha \beta }&=-A_{0}\left(1-\gamma /3\right)Q_{\alpha \beta }+A_{0}\gamma \left(Q_{\alpha \mu }Q_{\mu \beta }-\frac{1}{3}{Q}_{\mu \nu }^{2}\delta _{\alpha \beta }\right)\nonumber\\&\quad -A_{0}\gamma {Q}_{\mu \nu }^{2}Q_{\alpha \beta }+K{\partial }_{\alpha }{\partial }_{\mu }Q_{\mu \beta }+K{\partial }_{\mu }({\partial }_{\mu }Q_{\alpha \beta }-{\partial }_{\alpha }Q_{\mu \beta }). \end{align}
To simulate sedimentation, we employ a hybrid lattice Boltzmann method (Ladd Reference Ladd1994a , Reference Laddb ), using the lattice Boltzmann method for hydrodynamics and a finite-difference scheme for the Q -tensor evolution. For an incompressible fluid, the velocity field satisfies the continuity and momentum equations:
 \begin{align} \partial _{\alpha }u_{\alpha }&=0, \end{align}
 \begin{align} \rho _{f}(\partial _{t}+u_{\beta }\partial _{\beta })u_{\alpha }&=\partial _{\beta }(\varPi _{\alpha \beta })+\eta \partial _{\beta }(\partial _{\alpha }u_{\beta }+\partial _{\beta }u_{\alpha }), \end{align}
where ρ f , η and Παβ are, respectively, the fluid density, viscosity and stress tensor. Here Παβ can be expressed as (Thampi, Golestanian & Yeomans Reference Thampi, Golestanian and Yeomans2014)
 \begin{align} \varPi _{\alpha \beta } &=-p_{0}\delta _{\alpha \beta }+2\xi \left(Q_{\alpha \beta }+\frac{1}{3}\delta _{\alpha \beta }\right)Q_{\mu \nu }H_{\mu \nu } -\xi H_{\alpha \mu }\left(Q_{\mu \beta }+\frac{1}{3}\delta _{\mu \beta }\right)\nonumber\\&\quad -\xi \left(Q_{\alpha \mu }+\frac{1}{3}\delta _{\alpha \mu }\right)H_{\mu \beta } -{\partial }_{\alpha }Q_{\mu \nu }\frac{\delta \mathrm{\mathcal{F}}}{\delta {\partial }_{\beta }Q_{\mu \nu }}+Q_{\alpha \mu }H_{\mu \beta }-H_{\alpha \mu }Q_{\mu \beta }, \end{align}
where
 ${\partial }_{\alpha }Q_{\mu \nu }({\delta \mathrm{\mathcal{F}}}/{\delta {\partial }_{\beta }Q_{\mu \nu }})$
is defined as
 \begin{equation} {\partial }_{\alpha }Q_{\mu \nu }\frac{\delta \mathrm{\mathcal{F}}}{\delta {\partial }_{\beta }Q_{\mu \nu }}=-K{\partial }_{\alpha }Q_{\mu \beta }{\partial }_{\nu }Q_{\mu \nu }. \end{equation}
2.3. Physical problem
This study investigated the sedimentation of spherical particles, from dilute to dense regimes, in an unbounded nematic liquid-crystal flow. Simulations were performed in a cubic domain with fully periodic boundary conditions in all three directions, with gravity applied along the negative z axis (see figure 1). The particle volume fraction was defined as
 \begin{equation} \phi =\frac{\pi Nd^{3}}{6L^{3}}, \end{equation}
where d denotes the particle diameter, N represents the particle number and the domain dimensions are L × L × L = 10.5d × 10.5d × 10.5d. For N = 700, the corresponding volume fraction reaches ϕ = 31.6 %. The gravitational–viscous force balance is characterised by the Galileo number (Huang, Yang & Lu Reference Huang, Yang and Lu2014; Dash & Lee Reference Dash and Lee2015):
 \begin{equation} {Ga}=\frac{\sqrt{\left(\rho _{p}/\rho _{f}-1\right)gd^{3}}}{\nu }, \end{equation}
where g is the gravitational acceleration, ρ p is the particle density and ν is the kinematic viscosity of the fluid.
Schematic of particle sedimentation within a cubic domain. Periodic boundary conditions are applied along the x, y and z axes of the cubic domain. An anchoring condition is imposed on the particle surfaces, with gravitational acceleration g applied along the negative z axis. Initially, N non-overlapping spheres, each with a diameter of 16 lattice units, were randomly distributed within the computational domain and subjected to static sedimentation.

A soft-sphere potential model is employed to describe interparticle repulsion, expressed as (Nguyen & Ladd Reference Nguyen and Ladd2002)
 \begin{align} V_{\textit{ij}}\left(h_{\textit{ij}}\right)=\begin{cases} {\epsilon} \left(\frac{\sigma }{h_{\textit{ij}}}\right)^{\psi },& h_{\textit{ij}}\lt h_{c}\\[8pt] 0, & h_{\textit{ij}}\geq h_{c}, \end{cases} \end{align}
where ɛ is the potential strength, σ is the interaction length scale and ψ is the exponent controlling the decay rate. The variable h ij = r ij − d denotes the surface-to-surface separation between two particles, with r ij being their centre-to-centre distance. The model parameters are set to ɛ = 0.001, σ = 1, ψ = 2 and the cutoff distance h c = 3. Further details are available in the Ludwig code repository (http://github.com/ludwig-cf/ludwig). The corresponding repulsive force, derived from the potential gradient as F rep = −∇V ij , is explicitly incorporated into the Newton–Euler equations of motion. This highly localised force effectively acts as a hard-sphere barrier, strictly preventing non-physical particle overlap while minimising artificial long-range interference.
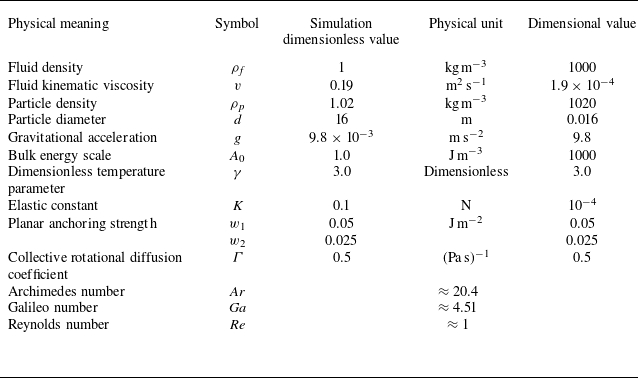
Initially, N non-overlapping spheres of diameter d were randomly distributed within the domain and allowed to sediment from rest (figure 1). The principal simulation parameters were set to ρ
f
= 1,
 $v$
= 0.19, ρ
p
= 1.02, d = 16 and g = 9.8 × 10⁻³, all in lattice units. Anchoring conditions are applied to particle surfaces. Under a 32-core CPU configuration, a total run time of t = 4 × 10⁵ steps required approximately 120 h of computation per simulation case.
3. Validation
3.1. Sedimentation of a single spherical particle in an unbounded flow
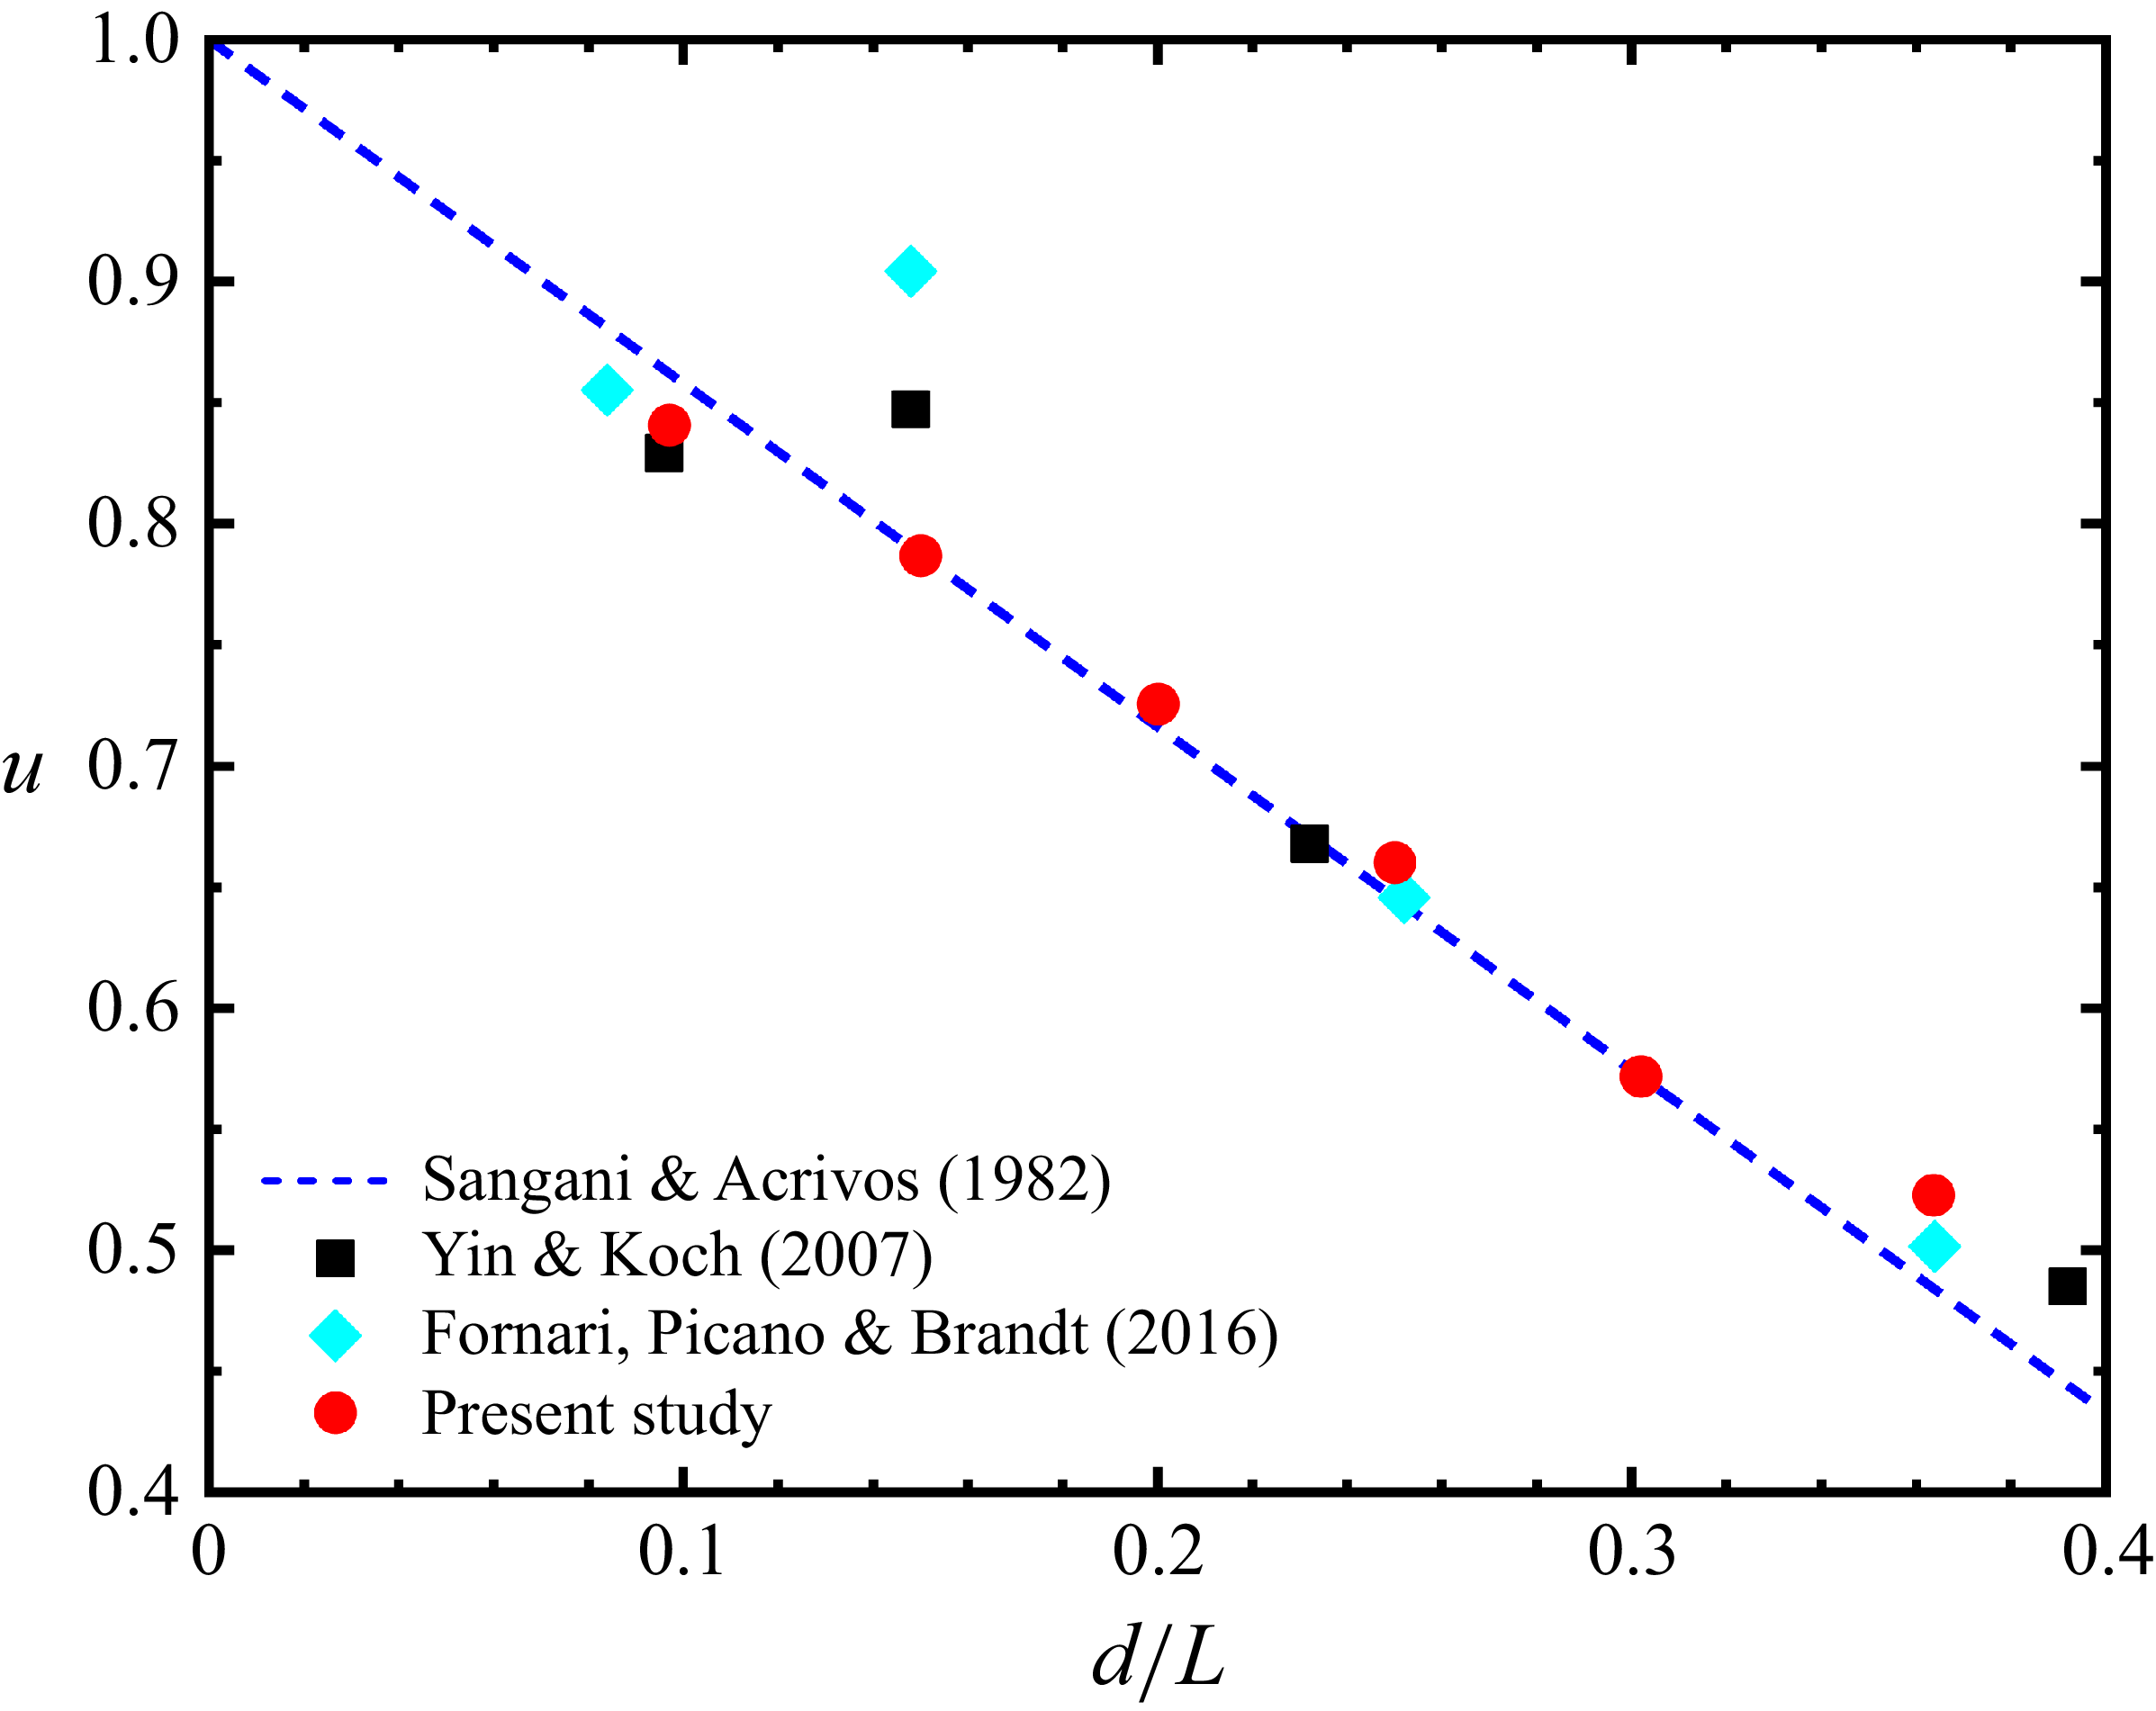
To verify the influence of periodic boundary conditions on the terminal settling velocity of a single spherical particle in Stokes flow, we measured the terminal settling velocity u
t
for different domain sizes. The particle diameter is set to d = 16 (Yin & Koch Reference Yin and Koch2007; Ye et al. Reference Ye, Ouyang and Lin2025), and the Reynolds number is defined as Re = u
t
d/
 $v$
. The obtained results were compared with the analytical expressions of Hasimoto (Reference Hasimoto1959) and Sangani & Acrivos (Reference Sangani and Acrivos1982):
 \begin{equation} u=\frac{u_{t}}{u_{c}}=1-1.7601\phi ^{1/3} ,\end{equation}
where u c denotes the Stokes settling velocity, given by
 \begin{equation} u_{c}=\frac{2}{9}\frac{(\rho _{p}/\rho _{f}-1)g(d/2)^{2}}{v} .\end{equation}
As depicted in figure 2, our results showed quantitative consistency with previous studies (Yin & Koch Reference Yin and Koch2007; Fornari, Picano & Brandt Reference Fornari, Picano and Brandt2016).
Terminal velocity of a single spherical particle under periodic boundary conditions of varying dimensions. The results for Re ≈ 1 are presented as red circles. Reference data from Yin & Koch (Reference Yin and Koch2007) and Fornari et al. (Reference Fornari, Picano and Brandt2016) are shown as black squares and blue diamonds, respectively.

3.2. Sedimentation of spherical particles in an unbounded flow
This section examines multiparticle sedimentation to further validate the accuracy of our code in handling particle–particle interactions. The drag coefficient for an isolated spherical particle is given by CD
= 4gd(ρ
p
− ρ
f
)/(3ρ
f
u
t
2), with the Archimedes number defined as Ar = Ga
2 = (ρ
p
/ρ
f
− 1)gd
3
/
 $v$
2 (Yin & Koch Reference Yin and Koch2007). The variation of CD
with Re is described by the piecewise function:
 \begin{align} C_{{D}}=\begin{cases} \frac{24}{{\textit{Re}}}\left[1+0.1315{\textit{Re}}^{(0.82-0.05{\log _{10}}{\textit{Re}})}\right],&0.01\lt {\textit{Re}}\lt 20\\[8pt] \frac{24}{{\textit{Re}}}\left[1+0.1935{\textit{Re}}^{0.6305}\right],&20\lt {\textit{Re}}\lt 260. \end{cases} \end{align}
Based on the drag coefficient, Archimedes number and (3.3), the following relationship can be derived:
 \begin{align} C_{{D}}&=\frac{4{Ar}}{3{\textit{Re}}^{2}}, \end{align}
 \begin{align} {Ar}&=\begin{cases} 18{\textit{Re}}\left[1+0.1315{\textit{Re}}^{(0.82-0.05{\log _{10}}{\textit{Re}})}\right]\!,&0.01\lt {\textit{Re}}\lt 20\\[6pt] 18{\textit{Re}}\left[1+0.1935{\textit{Re}}^{0.6305}\right]\!,& 20\lt {\textit{Re}}\lt 260. \end{cases} \end{align}
Mean settling velocity of particles in a Newtonian fluid at Re ≈ 1, Ar ≈ 20.4 and L/d = 10.3 with particle volume fraction in the range 0.48 % ≤ ϕ ≤ 32.94 %. The red circles denote the numerical solutions in this study, while the black squares correspond to the results of Yin & Koch (Reference Yin and Koch2007). The blue solid line represents the classical power-law correlation of Richardson & Zaki (Reference Richardson and Zaki1954), the black solid line denotes the correlation proposed by Garside & Al-Dibouni (Reference Garside and Al-Dibouni1977), the brown solid line denotes the asymptotic prediction of Batchelor (Reference Batchelor1972) and the magenta solid line denotes the optimal power-law fit suggested by Yin & Koch (Reference Yin and Koch2007).

For an isolated particle at L/d = 10.3, we obtained Re ≈ 1 and Ar ≈ 20.4, as calculated from (3.5). Simulations were performed on 64 computational nodes with a total run time of t = 1.5 × 10⁵. After reaching steady state, results from four simulations with different initial conditions were ensemble-averaged. Instantaneous particle velocities were sampled every 100 steps between 3 × 10⁴ and 1.2 × 10⁵. Figure 3 compares the present results with the experimental data of Yin & Koch (Reference Yin and Koch2007), showing close agreement. At low volume fraction and low Reynolds number, the hindered settling velocity decreases approximately linearly with volume fraction, consistent with Batchelor’s (1972) relation: 〈U〉 = 1 – 6.55ϕ (solid brown line). In the intermediate range (10 % ≤ ϕ ≤ 25 %), the Richardson & Zaki (Reference Richardson and Zaki1954) law 〈U〉 = (1 – ϕ) n with n = 4.4 for Re = 1 provides a better fit, while at higher concentrations (ϕ> 25 %), the Garside & Al-Dibouni (Reference Garside and Al-Dibouni1977) correction with n = 4.88 yields improved accuracy. For dilute suspensions (ϕ< 10 %), deviations from both models are captured more accurately using a modified relation: 〈U〉 = k(1 – ϕ) n , with k ∈ [0.8, 0.9] (Yin & Koch Reference Yin and Koch2007).
Summary of parameters used in the nematic liquid-crystal model.

(a) Mean settling velocity of particles in an unbounded flow field as a function of volume fraction at Re ≈ 1 and Ar ≈ 20.4. Here, P and H denote planar and homeotropic anchoring, respectively. (b) Enlarged view of (a).

4. Results and discussion
4.1. Sedimentation of spherical particles in nematic liquid-crystal fluids
This section examines the sedimentation of particles under different anchoring conditions, with liquid-crystal parameters specified in table 1 (the detailed nomenclature is provided in Appendix A), unless otherwise stated. The initial orientation vector n of the nematic phase is aligned with the settling direction (z axis), ensuring that boojums induced by planar anchoring and Saturn rings induced by homeotropic anchoring adopt axially symmetric configurations relative to gravity. In contrast, alternative initial orientations break this symmetry, introducing lateral forces or torques on the particles. Figure 4(a) shows the variation of the mean settling velocity with volume fraction (0.09 % ≤ ϕ ≤ 31.6 %). The primary finding is that the mean settling velocity in nematic liquid crystals first increases and then decreases with ϕ, in contrast to the monotonically decreasing behaviour observed in Newtonian fluids. Within this multidimensional parameter space, ϕ acts as the primary governing factor by dictating the interparticle spacing and the onset of long-range interactions. Concurrently, surface anchoring acts as a morphological controller that determines the specific defect structures and aggregation patterns, while intrinsic material parameters (such as K and Γ) serve to fine-tune the strength and relaxation dynamics of these defect-mediated interactions (simulations fixing either K or Γ while varying the other can be found in Appendix B).
Defect structures on the particle surface (Re ≈ 1, Ar ≈ 20.4). Visualisation thresholds are q = 0.3325 (planar) and q = 0.31 (homeotropic). Volume fractions (a–d) ϕ = 2.2 % and (e–h) ϕ = 13.5 %. Under planar anchoring conditions (a,e) K = 0.1, Γ = 0.5, (b, f) K = 0.05, Γ = 0.2, (c,g) K = 0.05, Γ = 0.5. Under homeotropic anchoring conditions (d,h) K = 0.1, Γ = 0.5. (i–l) Defect structures on the particle surface. (i) Boojum defects; (j) sectional view of boojum defects; (k) Saturn-ring defects; (l) sectional view of Saturn-ring defects.

Figure 5 illustrates the defect structures surrounding particles at various ϕ values. At large interparticle separations (very low volume fractions, e.g. ϕ = 0.45 %), the fundamental topological configurations around isolated particles become evident (see close-up views in figure 5 i–l). Under planar anchoring, confining the liquid-crystal director parallel to the particle surface creates a topological mismatch with the uniform far field, inevitably generating two point defects (boojums) at the poles. Conversely, homeotropic anchoring imposes a radial director arrangement, forcing the formation of a topological disclination line encircling the equatorial plane, known as a Saturn ring. The local elastic stress fields induced by these specific defect structures substantially enhance the drag on the particles. A similar enhancement of drag for isolated particles was recently documented by Ye et al. (Reference Ye, Ouyang and Lin2025). Although their study focused on single-particle settling within a confined active nematic system, their analysis in the passive limit confirms that topological defects severely hinder the mobility of isolated spheres. In this regime, particles remain largely isolated and dispersed, and the mean settling velocity is lower than in Newtonian fluids. As ϕ increases (0.45 % < ϕ ≤ 9.0 %), the interparticle spacing decreases, long-range interactions intensify and either the fusion of boojums or the entanglement of Saturn rings promotes particle aggregation (figure 5 a–d). We infer that defect fusion reaches a maximum at a characteristic ϕ, producing strong interparticle synergy. This defect-driven aggregation significantly reduces the effective frontal area of the resulting clusters (as quantitatively detailed in Appendix C). By sharing a common hydrodynamic wake, these compact structures experience substantially diminished collective drag. Furthermore, the settling velocity exhibits substantial particle-to-particle variation. This occurs because aggregate structures, facilitated by nematic elasticity, settle rapidly and recirculate within the periodic domain, whereas isolated particles sediment more slowly (Phillips Reference Phillips2010; Vishnampet & Saintillan Reference Vishnampet and Saintillan2012; Murch & Shaqfeh Reference Murch and Shaqfeh2020).
Beyond this point (ϕ> 9.0 %), defect networks fill the interparticle voids (figure 5 e–h), and the system develops a layered, ordered structure. This ordering enhances hydrodynamic drag, causing the settling velocity to decrease with ϕ, analogous to the behaviour in Newtonian suspensions. In Newtonian fluids, aggregation typically occurs at high Reynolds numbers or very low ϕ due to wake interactions, exemplified by the DKT phenomenon. At low Reynolds numbers, however, no significant aggregation occurs, and particles align more uniformly with increasing ϕ (Uhlmann & Doychev Reference Uhlmann and Doychev2014; Zaidi et al. Reference Zaidi, Tsuji and Tanaka2014; Zaidi et al. Reference Zaidi, Tsuji and Tanaka2015; Fornari et al. Reference Fornari, Picano and Brandt2016). Thus, at high volume fractions, both the nematic system (constrained by a dense defect network) and the low-Reynolds-number Newtonian system converge to a uniformly ordered particle distribution, leading to the macroscopic hindered settling effect.
The anchoring conditions on particle surfaces play a crucial role in governing interparticle interactions. As shown in figure 4, the mean settling velocity exhibits a clear divergence between the two anchoring configurations as ϕ increases. For ϕ> 0.45 %, the velocity under homeotropic anchoring consistently exceeds that under planar anchoring. Under homeotropic anchoring (see figure 5 d), multiple particles become entangled via Saturn rings, forming structurally robust aggregates (Araki & Tanaka Reference Araki and Tanaka2006; Wood et al. Reference Wood, Lintuvuori, Schofield, Marenduzzo and Poon2011). By contrast, planar anchoring induces boojums at the particle poles, which fuse to form either short chains (head–tail fusion) or parallel arrangements (head–head fusion), as shown in figure 5(a). This mechanism resembles the formation of particle chains in viscoelastic fluids (Yu et al. Reference Yu, Phan-Thien, Fan and Tanner2002; Vishnampet & Saintillan Reference Vishnampet and Saintillan2012). The underlying mechanism for aggregation can be understood through energy minimisation of the defect structures. Under homeotropic anchoring, the Saturn-ring defect line possesses a positive line tension. The entanglement or fusion of Saturn rings with neighbouring particles reduces the total defect length and the associated elastic distortion energy, yielding a strong, isotropic attraction that facilitates the formation of dense, irregular aggregates (Araki & Tanaka Reference Araki and Tanaka2006; Ravnik & Zumer Reference Ravnik and Žumer2009). In contrast, under planar anchoring, the boojum point defects at the poles can fuse when particles align end-to-end along the director. This fusion alleviates the severe splay and bend deformations, lowering the Frank elastic energy and promoting the formation of chain-like structures (Muševič et al. Reference Muševič, Skarabot, Tkalec, Ravnik and Zumer2006). The side-by-side configuration, while also energetically favourable in specific contexts, typically results from a weaker elastic interaction, consistent with the observed smaller aggregate sizes. The weaker elastic interactions mediated by boojums under planar anchoring lead to reduced aggregation compared with homeotropic anchoring (figures 5 a and 5 d). Interestingly, as seen in figure 5(d), an isolated disclination line occasionally emerges when intense local hydrodynamic shear overrides elastic binding forces to detach particles. In the present periodic simulation domain, this disclination line traverses the boundaries and connects with its own periodic image. Such a topological constraint artificially prevents its natural shrinkage and annihilation, highlighting an inherent limitation of the fixed computational domain size (see Appendix D for the temporal evolution of this defect). Notably, the velocity peak under planar anchoring appears at lower ϕ compared with homeotropic anchoring. This is because Saturn rings under homeotropic anchoring can fuse into a continuous network even at high ϕ, producing stronger particle bonding (Foffano et al. Reference Foffano, Lintuvuori, Tiribocchi and Marenduzzo2014).
The influence of liquid-crystal material parameters is further examined in figure 4. Reducing the elastic constant K from 0.1 to 0.05 has a negligible effect on the settling velocity, whereas reducing the rotational diffusion constant Γ from 0.5 to 0.2 significantly increases it. A lower Γ prolongs the relaxation of the orientation field, thereby strengthening interparticle interactions and promoting the formation of stable, long-chain aggregates (figure 5
b). These chain-like structures facilitate cooperative settling and reduce hydrodynamic drag, thereby accelerating the ensemble-averaged settling velocity. The pronounced influence of Γ, compared with K, on the settling velocity underscores the critical role of defect dynamics. A lower Γ implies slower relaxation of the orientation field, which effectively stabilises the defect structures (boojums or Saturn rings) against hydrodynamic disturbances. This stability enables the development and persistence of long-range, chain-like aggregates under planar anchoring, thereby streamlining sedimentation. In contrast, a high Γ enables rapid defect reconfiguration, preventing the sustained particle associations necessary for significant settling enhancement. The relative insensitivity to K over the range studied suggests that the interaction range, set by the nematic correlation length (which scales with
 $\sqrt{K}$
), is sufficient to mediate particle interactions at the examined volume fractions, and that the dynamics is more strongly governed by the relaxation rate of the director field than the absolute energy scale of the deformations. By contrast, single-particle studies reveal that the settling velocity decreases approximately linearly with K and increases monotonically with increasing Γ. Ye et al. (Reference Ye, Ouyang and Lin2025) attributed the K dependence to a simplified force balance on spheres, and noted that the competition between the relaxation rate of the order parameter (determined by Γ) and the inertia of nematic distortion governs the particle sedimentation.
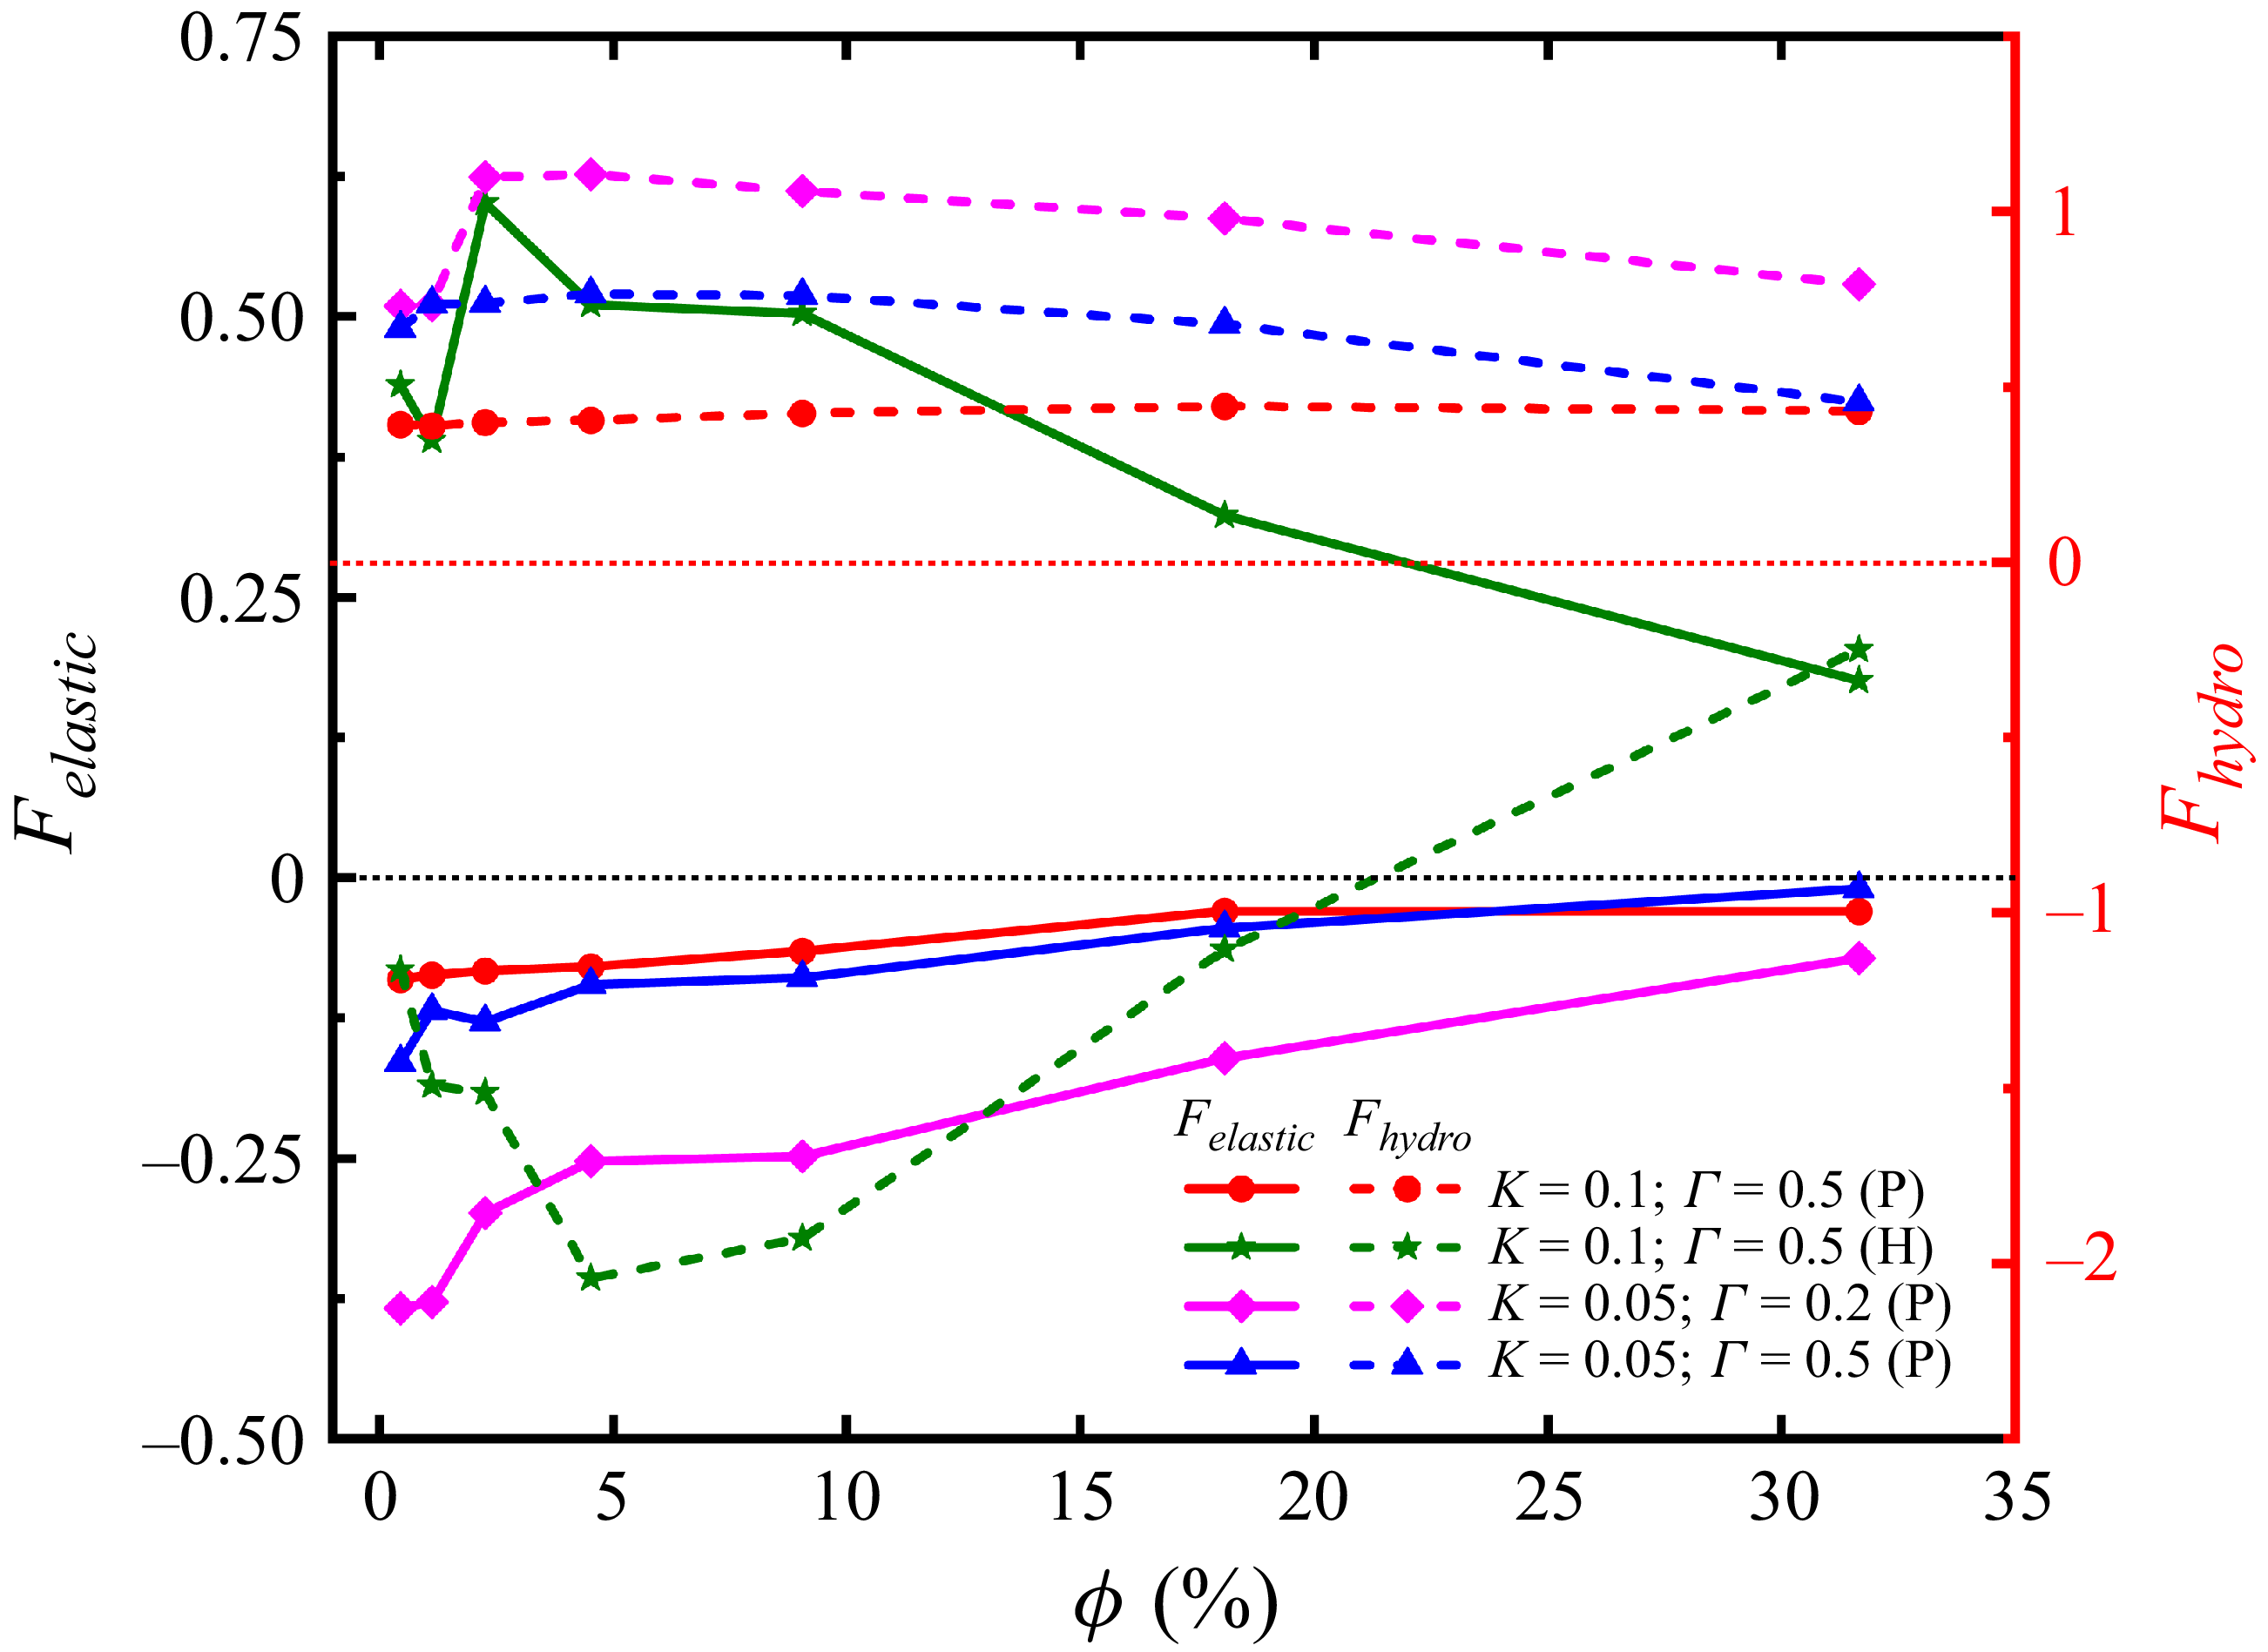
Analysing the average elastic force Felastic and hydrodynamic drag Fhydro as a function of volume fraction provides a deeper understanding of the variations in settling velocity. We evaluate these forces by integrating the local elastic stress and viscous deviatoric stress over the particle surfaces during the terminal settling stage. The results depicted in figure 6 reveal that under planar anchoring conditions, the mean elastic force acting on the particles is negative (pointing downward). This downward pull, which is further amplified at lower Γ values, quantitatively confirms that the fusion of point defects reduces elastic distortion energy and actively drives the formation of chain-like aggregates, thereby accelerating the particles. To maintain force equilibrium, the fluid consequently exerts a larger positive (upward) hydrodynamic drag. In stark contrast, under homeotropic anchoring conditions, the elastic force on the particles is positive (upward) and significantly stronger. Here, Saturn-ring defects induce profound topological entanglement and tighter interparticle aggregation. This highly compact spatial clustering synergistically entrains a substantial volume of interstitial fluid downward. Consequently, the effective hydrodynamic drag undergoes a directional reversal, becoming negative (i.e. the local fluid actively pushes the aggregate downward). This localised ‘drafting’ effect perfectly correlates with the dramatic enhancement in collective settling velocity. However, in the high-volume-fraction regime, the intense global fluid backflow necessitated by severe spatial crowding overpowers this local downward entrainment. As a result, the hydrodynamic drag reverts to a strongly positive value, leading to the rapid decline in settling velocity.
Variation of the average elastic force Felastic and hydrodynamic drag Fhydro (integrated over the particle surface) as a function of the volume fraction ϕ. The solid line represents Felastic , corresponding to the left axis. The dashed line represents Fhydro , corresponding to the right axis.

4.2. Particle spatial distribution
This section examines particle aggregation and microstructure at varying volume fractions in both Newtonian fluids and nematic liquid crystals. The analysis is performed in the statistically steady regime of the simulations, with mean quantities obtained by averaging instantaneous data over multiple time steps.
Previous studies have shown that the increase in mean settling velocity during sedimentation is attributable to the formation of agglomerates or chain-like structures generated by synergistic interactions between particles (Kajishima Reference Kajishima2004; Uhlmann & Doychev Reference Uhlmann and Doychev2014; Fornari, Picano & Brandt Reference Fornari, Picano and Brandt2018). To quantify the relationship between aggregation and settling velocity, we employ the Voronoi tessellation method. This partitions the computational domain into N non-overlapping cells, such that every point in a cell is closer to the centre of mass of its associated particle than to any other particle (Monchaux, Bourgoin & Cartellier Reference Monchaux, Bourgoin and Cartellier2010; Tagawa et al. Reference Tagawa, Roghair, Prakash, van Sint Annaland, Kuipers, Sun and Lohse2013; Jiang, Xu & Zhao Reference Jiang, Xu and Zhao2024). The degree of inhomogeneity in the particle distribution is characterised by the normalised Voronoi volume, defined as
 \begin{equation} \overline{V}_{\textit{Voro}}\left(i\right)=\frac{V_{\textit{Voro}}(i)N}{V_{\textit{tot}}}, \end{equation}
where
 $\overline{V}_{\textit{Voro}}(i)$
is the normalised Voronoi volume of the ith particle and V
tot
is the total volume of the computational domain. For uniformly distributed particles,
 $\overline{V}_{\textit{Voro}}\approx 1$
, whereas
 $\overline{V}_{\textit{Voro}}\lt 1$
indicates local clustering.
Figure 7 shows the statistical distribution of normalised Voronoi volumes for particles in Newtonian fluids and nematic liquid crystals at different volume fractions. At ϕ = 4.5 %, the distribution in nematic liquid crystals is significantly broader and shifted towards lower values than in Newtonian fluids (figure 7 a), indicating a stronger propensity for localised aggregation. This effect is further amplified when the rotational diffusion coefficient Γ is reduced or when homeotropic anchoring is applied, reflecting enhanced collective interactions and the formation of denser particle clusters. These features lead to accelerated particle settling, consistent with the results in figure 4.
Probability density distribution of normalised Voronoi volume at Re ≈ 1 and Ar ≈ 20.4. (a) Comparison between Newtonian fluid and nematic liquid crystals at ϕ = 4.5 %. (b) Results for the nematic case with K = 0.1 and Γ = 0.5 (planar anchoring), at different volume fractions.

Moreover, figure 7(b) shows that at either very low (ϕ = 0.45 %) or very high (ϕ = 31.6 %) volume fractions, the normalised Voronoi volume of the particle clusters approaches unity. By contrast, at intermediate low volume fractions (1.1 % ≤ ϕ ≤ 4.5 %),
 $\overline{V}_{\textit{Voro}}\lt 1$
, whereas at high volume fractions (ϕ = 9.0 %, 18.0 %),
 $\overline{V}_{\textit{Voro}}$
is near unity. This indicates that aggregation is most pronounced at intermediate low volume fractions, arising from particle–particle interactions induced by surface defects (figure 5
a–d). At very low ϕ, however, such interactions are rare, and the distribution remains nearly uniform. At very high ϕ, the reduced interparticle spacing promotes defect fusion and interpenetration, leading to densely packed aggregates that resemble quasi-rigid structures. This close packing suppresses collective particle–fluid dynamics, thereby weakening cooperative sedimentation (Wood et al. Reference Wood, Lintuvuori, Schofield, Marenduzzo and Poon2011). In addition, the attenuation of wake-induced interactions at high ϕ further inhibits cluster formation, contributing to the observed decline in settling velocity (Zaidi et al. Reference Zaidi, Tsuji and Tanaka2014).
To provide a more intuitive measure of particle aggregation, the clustering index C is defined based on the standard deviation of the normalised Voronoi volume of dispersed particles (Tagawa et al. Reference Tagawa, Roghair, Prakash, van Sint Annaland, Kuipers, Sun and Lohse2013):
 \begin{equation} C=\frac{\sigma \bigl(\overline{V}_{\textit{Voro}}\bigr)}{\sigma \bigl(\overline{V}_{\textit{Voro},\textit{rand}}\bigr)}. \end{equation}
Here,
 $\sigma (\overline{V}_{\textit{Voro},\textit{rand}})$
denotes the standard deviation of the normalised Voronoi volume when N particles are randomly distributed within the computational domain. To minimise statistical error and ensure reliability, the clustering index C was computed by averaging over multiple realisations with randomly initialised particle positions. By definition, a clustering index C> 1 indicates spatial aggregation, with larger values corresponding to stronger clustering. Figure 8(a) shows the variation of C with particle volume fraction ϕ.
Clustering index C as a function of particle volume fraction at Re ≈ 1 and Ar ≈ 20.4. (a) The clustering index C (left axis, solid lines) and the dimensionless average settling velocity
 $\langle U \rangle$
/u
t
(right axis, dashed lines) as a function of volume fraction ϕ. (b) The clustering index as a function of the elastic constant parameter K.

In Newtonian fluids, C peaks at ϕ = 2.2 % but remains consistently below unity, indicating nearly uniform particle distributions with negligible clustering across the examined range. In nematic liquid crystals, clustering is substantially stronger. Under planar anchoring with K = 0.1 and Γ = 0.5, C peaks at ϕ = 1.1 % before decreasing, eventually falling below the Newtonian case at ϕ = 31.6 %. Reducing K to 0.05 shifts the clustering peak to ϕ = 0.45 %. To explicitly demonstrate the effect of the elastic constant, we extracted the clustering index C under planar anchoring conditions (ϕ = 4.5 %, Γ = 0.5) across different K values. As shown in figure 8(b), C increases rapidly as K rises from 0.05 to 0.1, and then plateaus as K further increases to 0.12. Furthermore, reducing Γ to 0.2 sustains elevated clustering across the entire ϕ range, highlighting the pronounced role of low rotational viscosity in promoting aggregation. Under homeotropic anchoring, clustering remains consistently higher than in all other cases. For all nematic systems, however, C declines once ϕ> 18.0 %, suggesting that interparticle repulsion effects at high volume fractions suppress clustering and promote uniform particle alignment. As depicted in figure 8(a), the relationship between the settling velocity and the clustering index as a function of volume fraction demonstrates that stronger clustering generally leads to higher settling velocities. However, there is a distinct offset between their peak positions (e.g. under homeotropic anchoring, aggregation peaks at ϕ ≈ 18.0 % while velocity peaks earlier at ϕ ≈ 9.0 %), reflecting a competition where the local drag reduction gained from aggregation is eventually overpowered by the intense fluid backflow induced by global spatial crowding. The settling velocity depends not only on the degree of aggregation but also on the type of structures formed: chain-like aggregates enhance cooperative settling, whereas densely packed clusters increase drag and slow down sedimentation.
This negative correlation between Voronoi volume and settling velocity confirms the ‘swarm effect’ – a phenomenon where the collective motion of particles reduces the overall drag compared with the same number of isolated particles, thereby enhancing the settling velocity (Koch & Hill Reference Koch and Hill2001; Wang et al. Reference Wang, Zhang, Li, Xiao and Yang2022). However, its efficacy is modulated by aggregate morphology. Chain-like aggregates, prevalent at low Γ with planar anchoring, streamline the flow and create a cooperative director field distortion, effectively reducing the per-particle drag by sharing a common hydrodynamic and elastic wake. In contrast, the dense, isotropic clusters formed under homeotropic anchoring, while also settling faster than isolated particles, incur greater form drag due to their larger frontal area. At very high volume fractions, the defect networks percolate and the system approaches a uniformly ordered state, which maximises the hydrodynamic hindrance by restricting fluid backflow and forcing all particles to sediment through a densely entangled elastic medium, thus explaining the velocity decline (Wood et al. Reference Wood, Lintuvuori, Schofield, Marenduzzo and Poon2011).
Subsequently, the nearest-neighbour distance (NND) statistical method is introduced to further characterise the spatial organisation of particle aggregation (Zaidi et al. Reference Zaidi, Tsuji and Tanaka2014). The NND of the ith particle is defined as
 \begin{equation} d_{\textit{NN}}(i)=\min _{j=1,2\dots N,j\neq i}| | \boldsymbol{x}_{i}-\boldsymbol{x}_{j}| | , \end{equation}
where x i denotes the centre of mass position of particle i. Figure 9 compares the d NN distribution for particles in Newtonian fluids and nematic liquid crystals at varying ϕ (real), together with the corresponding random distributions (rand). In all cases, the distributions shift leftward relative to the random case, indicating enhanced local aggregation during sedimentation. A direct comparison between nematic and Newtonian suspensions (figure 9 a) shows that the nematic distribution shifts markedly further left, consistent with the Voronoi analysis in figure 7. This arises because defects in the nematic phase enhance interparticle attraction, promoting the formation of particle pairs (figure 5 a–d). In nematic suspensions, homeotropic anchoring yields stronger leftward shifts and higher probabilities at small d NN than planar anchoring, indicating enhanced aggregation. Under planar anchoring, lowering Γ produces a similar shift, consistent with the promotion of chain-like structures (figure 5 b). By contrast, in Newtonian fluids the NND distribution remains close to random, confirming that the DKT mechanism is negligible at Re ≈ 1, where wake-induced interactions are weak.
Distributions of particle NND at Re ≈ 1 and Ar ≈ 20.4. (a) Comparison between Newtonian fluid and nematic liquid crystals at ϕ = 4.5 %. (b) Nematic case with K = 0.1 and Γ = 0.5 (planar anchoring), at different volume fractions.

Further analysis reveals a strong link between Voronoi volume and particle settling velocity. As shown in figure 10, a negative correlation is evident: particles with smaller Voronoi cells sediment faster, indicating that aggregates possess higher transport efficiency (Jiang et al. Reference Jiang, Xu and Zhao2024). Figure 10(a) shows that Voronoi volume in the nematic suspensions spans a broad range, reflecting a non-uniform spatial distribution. In contrast, particles in the Newtonian fluid exhibit a narrower distribution, indicating a more uniform and homogeneous particle arrangement. Figure 10(b) shows that the settling velocity increases at low ϕ but decreases at higher ϕ, consistent with the tendency towards uniform particle distribution that suppresses cooperative settling.
Mean particle settling velocity as a function of normalised Voronoi volume at Re ≈ 1 and Ar ≈ 20.4. (a) Comparison between Newtonian fluid and nematic liquid crystals at ϕ = 4.5 %. (b) Nematic case with K = 0.1 and Γ = 0.5 (planar anchoring), at different volume fractions.

4.3. Particle–fluid interactions
Figure 11 presents the joint probability density function of particle Voronoi volume and the vertical fluid velocity sampled on the particle surface for 1.1 % ≤ ϕ ≤ 9.0 %. At larger volume fractions (ϕ> 9.0 %), the correlation becomes negligible. The local vertical velocity U z f@p is defined as the vertical mean fluid velocity on a spherical shell of radius 1.5d centred at the particle’s centre of mass (Kidanemariam et al. Reference Kidanemariam, Chan-Braun, Doychev and Uhlmann2013). The results show that particles with small Voronoi volumes are associated with strong downward flows (〈U z f@p 〉 > 0), while those with large Voronoi volumes experience weak downward or even upward flows. This demonstrates that collective sedimentation is promoted in regions of strong downward motion, whereas isolated particles are hindered by counteracting upward flows.
Joint probability density function (j.p.d.f.) of normalised Voronoi volume and local fluid velocity U z f@p , normalised by the maximum value, at Re ≈ 1 and Ar ≈ 20.4. Columns correspond to different volume fractions: (a,e,i,m,q) ϕ = 1.1 %, (b, f, j,n,r) ϕ = 2.2 %, (c,g,k,o,s) ϕ = 4.5 %, (d,h,l,p,t) ϕ = 9.0 %. Rows correspond to different fluid types: (a–d) Newtonian fluid; (e–h) nematic liquid crystal with planar anchoring: K = 0.1, Γ = 0.5; (i–l) nematic liquid crystal with planar anchoring: K = 0.05, Γ = 0.2; (m–p) nematic liquid crystal with planar anchoring: K = 0.05, Γ = 0.5; (q–t) nematic liquid crystal with homeotropic anchoring: K = 0.1, Γ = 0.5.

In the Newtonian fluid, the probability distribution is narrowly concentrated at
 $\overline{V}_{\textit{Voro}}\approx 1$
(figure 11
a–d), confirming uniform particle dispersion and negligible aggregation at low Reynolds numbers. In nematic liquid crystals, by contrast, the distribution shifts towards
 $\overline{V}_{\textit{Voro}}\lt 1$
, broadening, and develops a pronounced tail (figure 11
e–t). This suggests that defect-mediated quadrupolar interactions facilitate non-uniform aggregation, resulting in the formation of localised clusters and voids. An intriguing phenomenon is observed at lower volume fractions (e.g. ϕ = 1.1 %; figure 11
i,m), where the distribution becomes bimodal. At such a concentration, the spaces between particles are large, resulting in long-range elastic interactions that are inadequate for forming large-scale stable particle clusters. The system therefore enters a transitional regime in which a few nascent clusters coexist with predominantly isolated particles. With increasing volume fraction, the bimodal character disappears and the distribution concentrates around a strongly cooperative sedimentation mode dominated by aggregates.
Figure 12 shows the joint probability density distribution of particle settling velocity and local vertical fluid velocity. A strong positive correlation is evident between the mean particle settling velocity 〈U〉 and the local vertical fluid velocity 〈U z f@p 〉, forming a distinct linear band. This indicates that when the fluid flows downward in concert with the particles, sedimentation is significantly accelerated, whereas upward flows hinder settling. As the volume fraction increases, the distribution broadens as particle–particle and particle–fluid interactions introduce greater variability in settling velocities. Compared with Newtonian fluids, nematic liquid crystals – particularly at low rotational diffusion constants – exhibit a wider distribution and a primary mode that shifts towards the upper right, demonstrating that particle aggregation enhances cooperative interactions with the fluid. The synchronous acceleration of both fluid and particle velocities is consistent with the Voronoi analysis in figure 10, which showed that aggregates associated with small Voronoi volumes reside in strong downward flows and achieve higher settling velocities through synergistic effects.
Joint probability density function (j.p.d.f.) of particle settling velocity versus local vertical fluid velocity 〈U z f@p 〉, normalised by the maximum value, at Re ≈ 1 and Ar ≈ 20.4. Columns correspond to different volume fractions: (a,e,i,m,q) ϕ = 1.1 %, (b, f, j,n,r) ϕ = 2.2 %, (c,g,k,o,s) ϕ = 4.5 %, (d,h,l,p,t) ϕ = 9.0 %. Rows correspond to different fluid types: (a–d) Newtonian fluid; (e–h) nematic liquid crystal with planar anchoring: K = 0.1, Γ = 0.5; (i–l) nematic liquid crystal with planar anchoring: K = 0.05, Γ = 0.2; (m–p) nematic liquid crystal with planar anchoring: K = 0.05, Γ = 0.5; (q–t) nematic liquid crystal with homeotropic anchoring: K = 0.1, Γ = 0.5.

Figure 12(a,b) compares the local vertical fluid velocity 〈U z f@p 〉, sampled on a spherical shell around the particle surface, with the global mean vertical velocity 〈U z f 〉 of the fluid. In nematic suspensions, 〈U z f@p 〉 increases initially with ϕ before decreasing, whereas 〈U z f 〉 remains negative across the entire volume-fraction range, showing a rapid decline for ϕ ≤ 9.0 % and a slower decrease with a slight recovery for ϕ> 18.0 %. For ϕ ≤ 18.0 %, 〈U z f@p 〉 consistently exceeds 〈U z f 〉, indicating that particles preferentially sample downward flows and further intensify them through aggregation, thereby establishing an efficient cooperative settling mechanism (see figure 11). At ϕ = 31.6 %, however, under K = 0.1 and Γ = 0.5, 〈U z f@p 〉 falls below 〈U z f 〉, reflecting enhanced fluid drag as particles adopt a more uniform alignment that suppresses local flow acceleration. In contrast, under homeotropic anchoring and low rotational diffusion constants, particle distribution remains less uniform, enabling sustained cooperative sedimentation and relatively high settling velocities.
Furthermore, the relative motion between particles and the fluid was examined. We define the relative velocity
 $\langle {U}_{rel}^{L}\rangle =U-\langle {U}_{z}^{f@p}\rangle$
between a particle and its local fluid environment, as well as the bulk relative velocity 〈U
rel
〉 = U − 〈U
z
f
〉 with respect to the bulk fluid. Except under planar anchoring, the particle–local relative velocity (figure 13
c) exhibits a narrow range. It decreases almost linearly with increasing ϕ, indicating strong coupling between particles and their surrounding fluid. In contrast, 〈U
rel
〉 (figure 13
d) spans a much broader range and attains a maximum at intermediate concentrations (ϕ ≈ 9.0 %), reflecting the cooperative acceleration of aggregates relative to the bulk flow. At higher ϕ, both measures decrease as uniform alignment and enhanced drag suppress collective effects. These results demonstrate that while local particle–fluid coupling remains robust, cooperative sedimentation occurs primarily at the bulk scale through aggregate–fluid interactions.
Velocity variation as a function of particle volume fraction at Re ≈ 1 and Ar ≈ 20.4. (a) Mean local vertical velocity 〈U
z
f@p
〉 sampled on a spherical shell around each particle; (b) mean vertical velocity 〈U
z
f
〉 of the fluid over the entire computational domain; (c) relative velocity between particles and the local fluid
 $\langle {U}_{rel}^{L}\rangle$
; (d) relative velocity between particles and the global fluid 〈U
rel
〉.

Interactions between particles alter the overall dynamics of the system. To gain a deeper understanding of particle behaviour, we calculate the mean drag coefficient. The mean drag coefficient
 $\overline{{C}_{d}^{L}}$
is defined based on the average hydrodynamic drag and the relative velocity between the particle and the surrounding fluid, expressed as
 \begin{equation} \overline{{C}_{d}^{L}}=\frac{\left\langle F_{z}\right\rangle }{\frac{1}{2}\rho _{f}\left\langle {U}_{rel}^{L}\right\rangle ^{2}A}. \end{equation}
Here, F z represents the vertical component of the hydrodynamic force acting upon the particle. In a statistically steady state, the time-averaged value of F z balances the particle’s net buoyant weight, i.e. 〈F z 〉 = π(ρ p − ρ f )gd 3/6. Here, A = πd 2/4 denotes the characteristic frontal area of the particle.
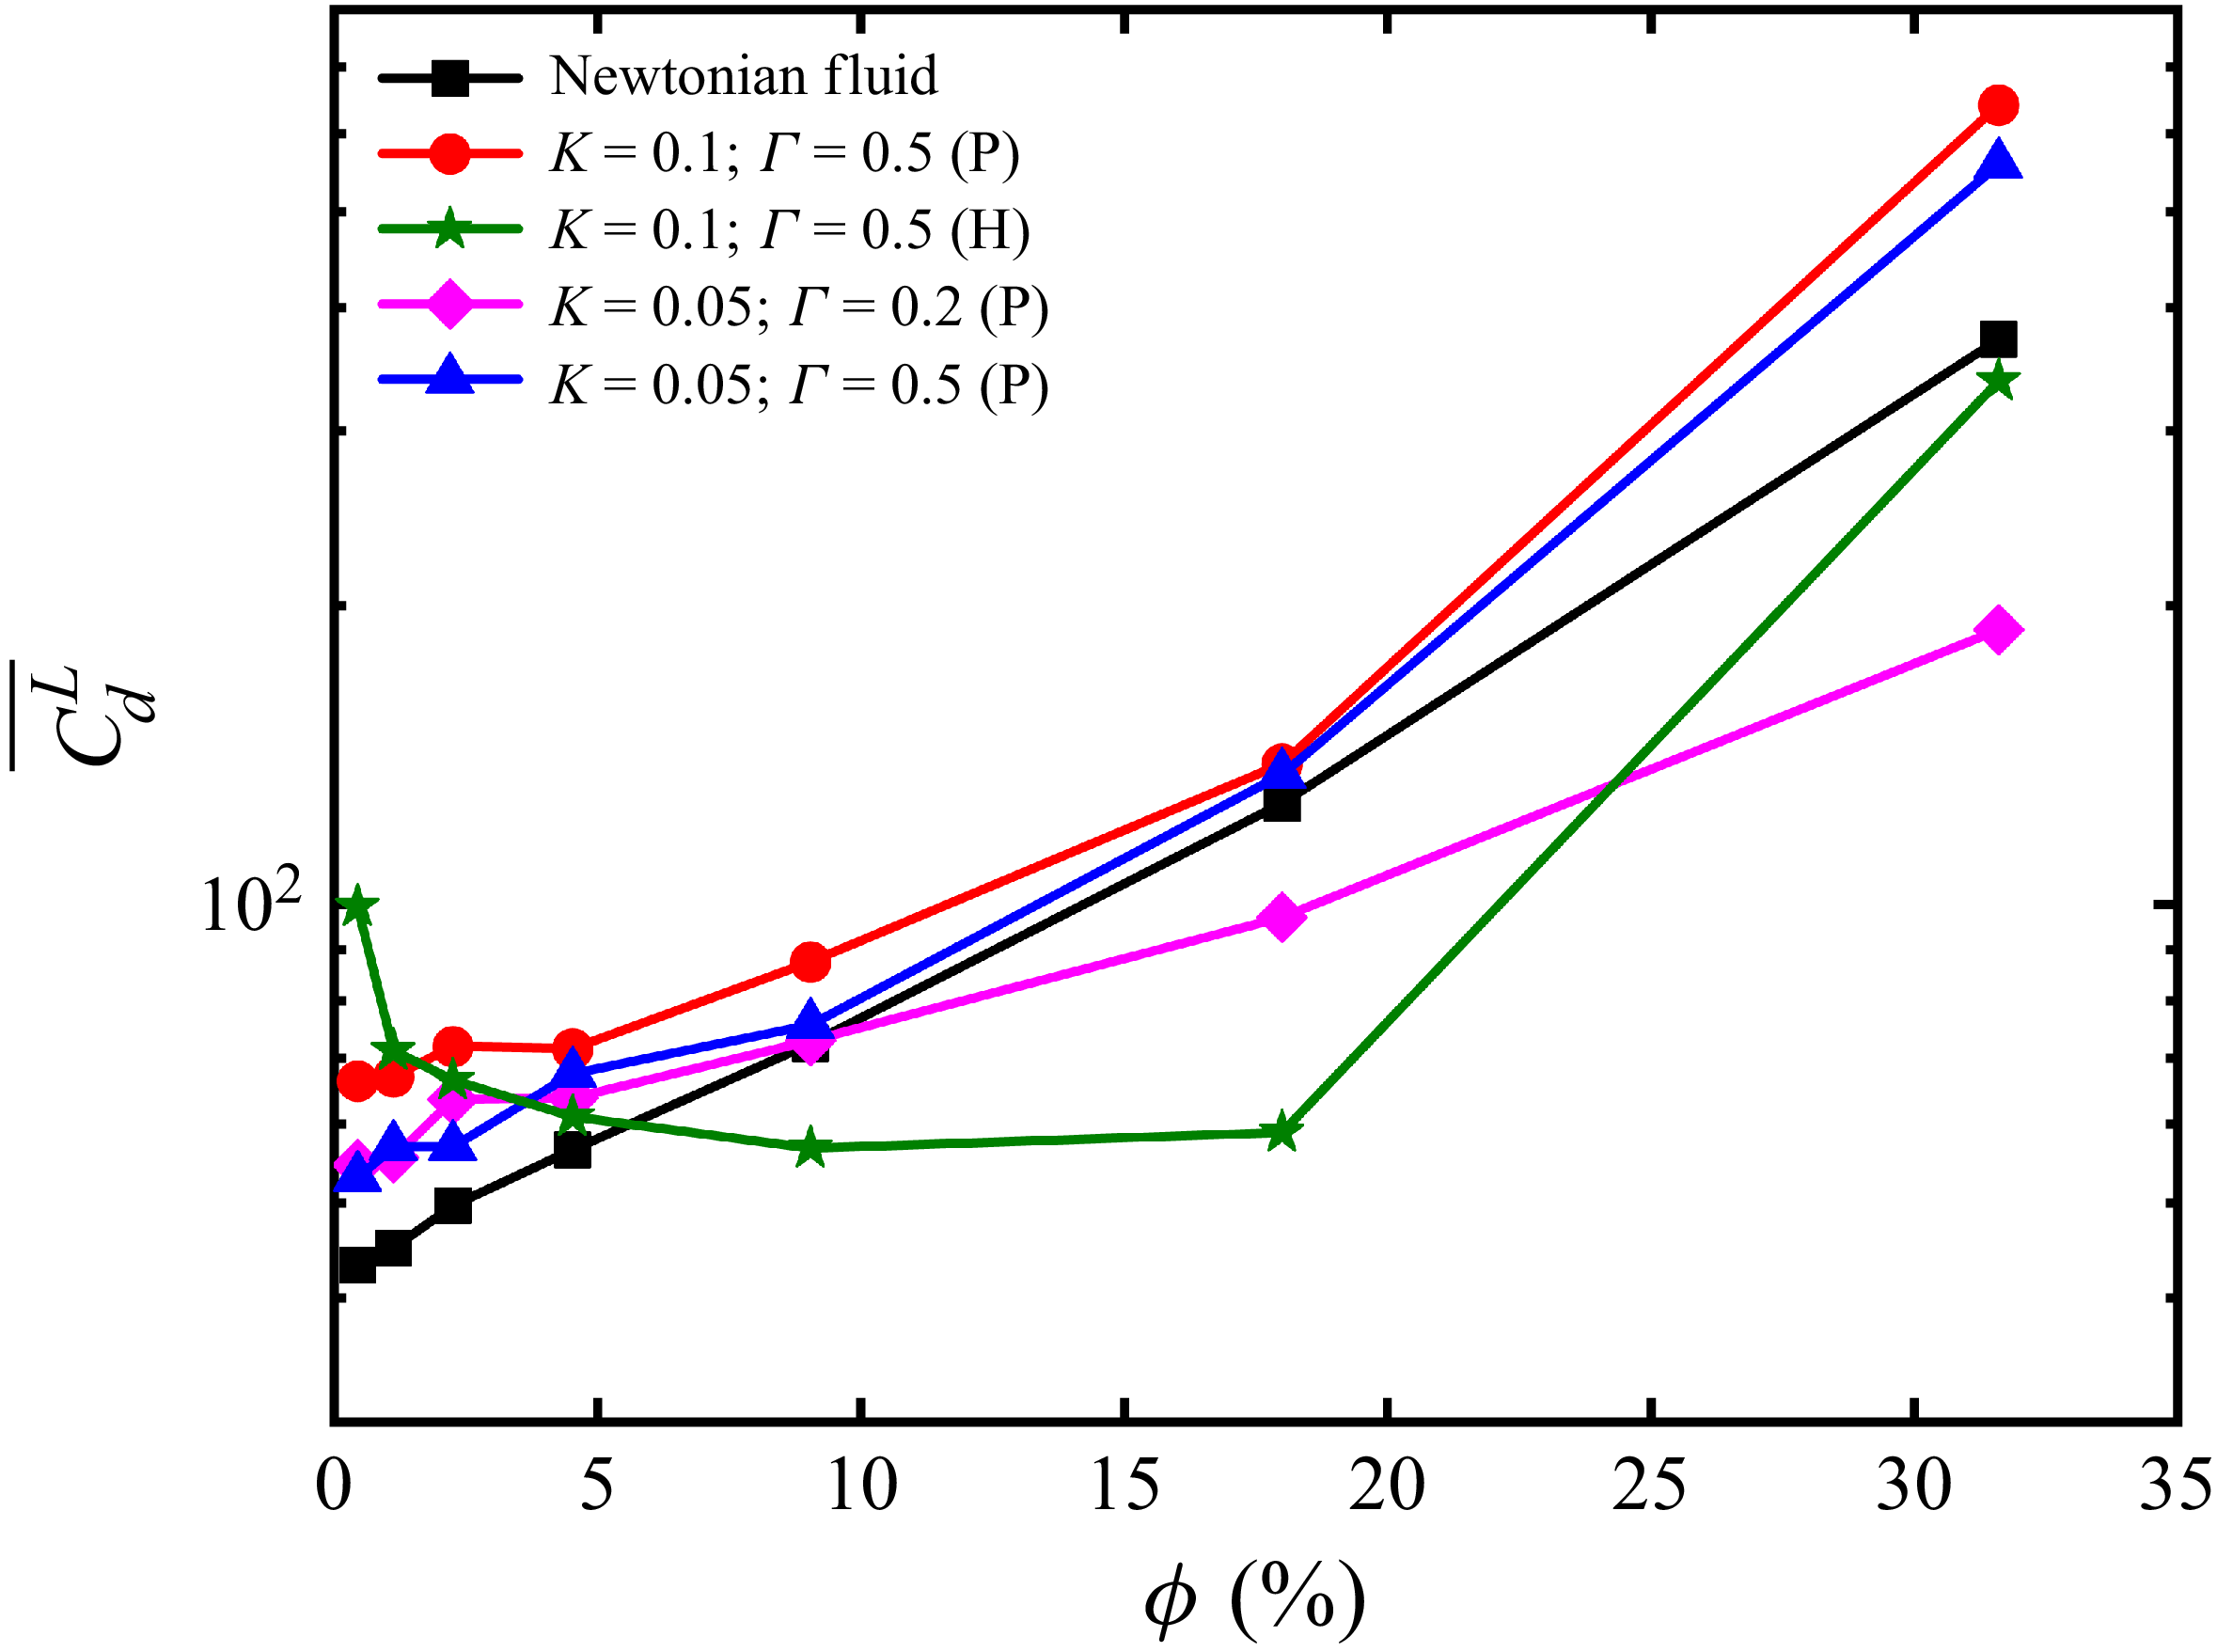
Figure 14 shows the variation of
 $\overline{{C}_{d}^{L}}$
with the particle volume fraction ϕ. In liquid-crystal systems, an intriguing phenomenon emerges under different anchoring conditions. For planar anchoring,
 $\overline{{C}_{d}^{L}}$
increases monotonically with ϕ, qualitatively resembling the trend observed in Newtonian fluids. Notably, as particles sediment in the liquid crystals, they must overcome additional energy dissipation associated with elastic deformation of the nematic field. Consequently, at volume fractions where particles are relatively isolated,
 $\overline{{C}_{d}^{L}}$
is significantly higher than those in Newtonian fluids. When ϕ ≥ 9.0 %, the mean drag coefficient for the Γ = 0.2 system becomes lower than that of the Γ = 0.5 system and Newtonian fluids. This indicates that low rotational diffusion coefficients promote local particle aggregation and suppress the transition towards a uniformly distributed state at high volume fractions, thereby reducing hydrodynamic drag through a synergistic effect. In contrast, under homeotropic anchoring,
 $\overline{{C}_{d}^{L}}$
exhibits non-monotonic behaviour with respect to ϕ, initially decreasing and subsequently increasing. This can be attributed to the fact that, at low volume fractions, particles are relatively isolated and the effective viscosity of a single vertically anchored particle in the passive nematic limit is substantially higher than that of a planar anchored particle (Foffano et al. Reference Foffano, Lintuvuori, Morozov, Stratford, Cates, Marenduzzo, Foffano, Lintuvuori, Tiribocchi and Marenduzzo2012), resulting in elevated drag. As the volume fraction increases, aggregation becomes more pronounced. Collective effects facilitate coordinated motion, thereby reducing the overall hydrodynamic resistance and leading to a decrease in the mean drag coefficient. However, at very high volume fractions (ϕ = 31.6 %), particle aggregation is suppressed. The resulting near-uniform distribution of particles causes the mean drag coefficient to increase markedly.
Mean drag coefficient as a function of particle volume fraction at Re ≈ 1 and Ar ≈ 20.4.

4.4. Particle microstructures
Previous studies have shown that particle sedimentation in nematic liquid crystals is strongly influenced by defect–particle interactions, leading to a non-uniform spatial distribution of particles. To elucidate this behaviour, it is instructive to examine particle microstructures, which provide insight into how nematic liquid crystals regulate sedimentation dynamics. A useful measure is the particle pair distribution function, P( r ) (Yin & Koch Reference Yin and Koch2007; Zaidi et al. Reference Zaidi, Tsuji and Tanaka2015; Jiang et al. Reference Jiang, Xu and Zhao2024), which quantifies the probability of finding another particle at a separation vector r from a reference particle, defined as
 \begin{equation} P\left(r,\theta \right)=\frac{1}{2\pi }{\int }_{0}^{2\pi }P(\boldsymbol{r})\,\mathrm{d}\theta =\frac{1}{2\pi }{\int }_{0}^{2\pi }P(r,\theta )\,\mathrm{d}\theta . \end{equation}
Given the axial symmetry of P( r ) with respect to the gravitational direction, we computed its isotropic plane average, i.e. the mean value along the x–y plane, and expressed the pair distribution function in terms of the particle spacing r = || r || and the polar angle θ (defined as the angle between the negative z axis and r ).
Figure 15 shows the pair distribution function for particles suspended in different media (Newtonian fluid and nematic liquid crystal) and at varying volume fractions. In the Newtonian fluid, P(r, θ) approaches zero in the range 0° ≤ θ ≤ 90° and 1 ≤ r/d ≤ 2, with only minor perturbations at low volume fractions (figure 15 a–d). This suggests that, at low Reynolds numbers, particles exhibit little tendency to form localised aggregation structures in Newtonian fluids. By contrast, within the same range, the values of P(r, θ) in the liquid crystal are significantly higher, confirming that particles are more prone to aggregation in the nematic environment.
Pair distribution function, normalised by its maximum value at Re ≈ 1 and Ar ≈ 20.4. Columns correspond to different volume fractions: (a,e,i,m,q) ϕ = 1.1 %, (b, f, j,n,r) ϕ = 2.2 %, (c,g,k,o,s) ϕ = 4.5 %, (d,h,l,p,t) ϕ = 9.0 %. Rows correspond to different fluid types: (a–d) Newtonian fluid; (e–h) nematic liquid crystal with planar anchoring: K = 0.1, Γ = 0.5; (i–l) nematic liquid crystal with planar anchoring: K = 0.05, Γ = 0.2; (m–p) nematic liquid crystal with planar anchoring: K = 0.05, Γ = 0.5; (q–t) nematic liquid crystal with homeotropic anchoring: K = 0.1, Γ = 0.5.

Under planar anchoring conditions, P(r, θ) exhibits only modest perturbations within 30° ≤ θ ≤ 90° for both K = 0.1, Γ = 0.5 and K = 0.05, Γ = 0.5. Two characteristic microstructures are observed in this regime: short-chain configurations and side-by-side arrangements (figures 5 a and 5 c). At low rotational diffusion constants, P(r, θ) exhibits significantly elevated values along θ = 0, extending to r/d = 5, indicating the formation of stable chain-like structures (figure 5 b). In contrast, under homeotropic anchoring conditions, P(r) exhibits a pronounced peak at r/d = 1. This arises from quadrupolar interactions mediated by defect lines, which tightly bind multiple particles together, giving rise to large, irregular aggregates. Such aggregates substantially enhance the settling velocity.
To obtain further insight, we calculated the probability of attracting particle pairs P in (r, θ). This function accounts only for pairs in proximity with relative radial velocity W r < 0, thereby directly reflecting the strength and orientation of the attractive interactions between particles. It is defined as
 \begin{equation} {W}_{r}^{\left\{i,j\right\}}=\frac{(\boldsymbol{\upsilon }_{i}-\boldsymbol{\upsilon }_{j})\boldsymbol{\cdot }(\boldsymbol{x}_{i}-\boldsymbol{x}_{j})}{\left|\left|\boldsymbol{x}_{i}-\boldsymbol{x}_{j}\right|\right|}, \end{equation}
where i and j denote the indices of the two particles. Figure 16 shows the dependence of P in (r, θ) on the separation distance r and polar angle θ for different media and particle volume fractions. In Newtonian fluids, P in (r, θ) attains its minimum in the range r/d = 1–2, indicating the absence of effective mutual attraction and hence the inability of particles to form aggregates. In contrast, nematic liquid crystals exhibit pronounced perturbations in P in (r, θ), reflecting the role of viscoelastic interactions in promoting microscopic aggregation.
Probability of attracting particle pairs as a function of separation distance r at Re ≈ 1 and Ar ≈ 20.4. Columns correspond to different volume fractions: (a,e,i,m,q) ϕ = 1.1 %, (b, f, j,n,r) ϕ = 2.2 %, (c,g,k,o,s) ϕ = 4.5 %, (d,h,l,p,t) ϕ = 9.0 %. Rows correspond to different fluid types: (a–d) Newtonian fluid; (e–h) nematic liquid crystal with planar anchoring: K = 0.1, Γ = 0.5; (i–l) nematic liquid crystal with planar anchoring: K = 0.05, Γ = 0.2; (m–p) nematic liquid crystal with planar anchoring: K = 0.05, Γ = 0.5; (q–t) nematic liquid crystal with homeotropic anchoring: K = 0.1, Γ = 0.5.

Under planar anchoring, large Γ yields a weak attraction leading to short chains or side-by-side configurations, while small Γ produces strong vertical alignment signals (θ ≈ 0) that stabilise extended chains. Under homeotropic anchoring, P in (r, θ) exhibits sharp peaks at contact distance (r/d ≈ 1) across all angles, reflecting defect-mediated quadrupolar interactions that bind particles into dense clusters. These trends, consistent with figure 15, elucidate the mechanisms of particle aggregation in nematic liquid crystals.
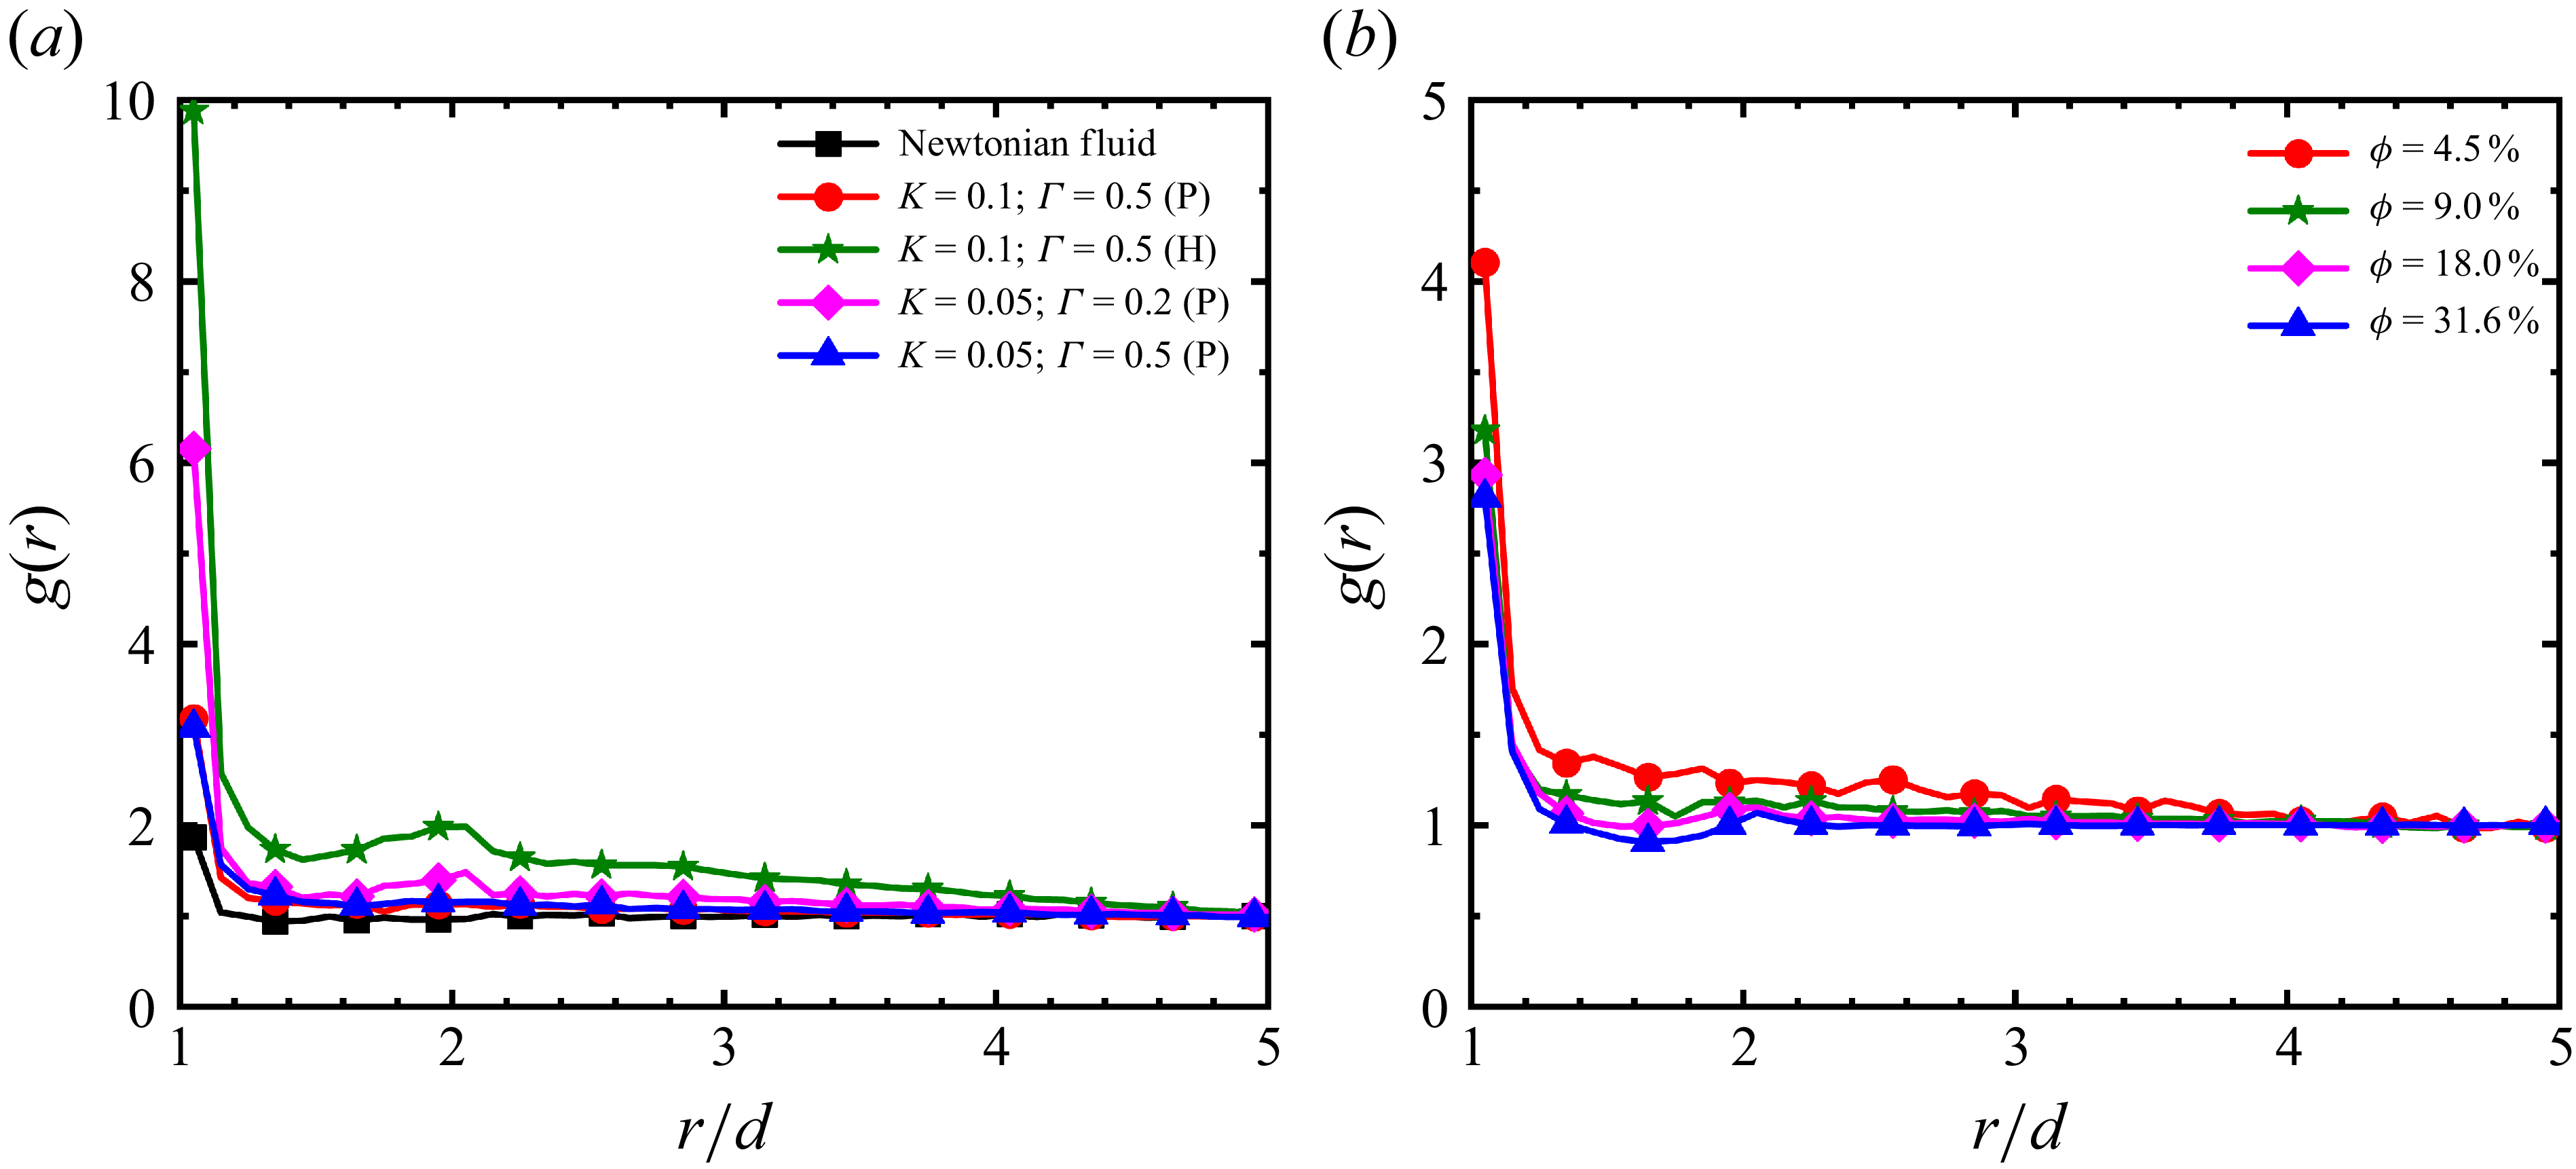
To quantitatively characterise particle microstructures, we introduce the radial distribution function g(r). This function represents the relative probability density of finding another particle within a spherical shell of radius r centred on a reference particle, and is computed from P(r, θ) (Yin & Koch Reference Yin and Koch2007):
 \begin{equation} g\left(r\right)=\frac{1}{2}{\int }_{0}^{\pi }P(r,\theta )\sin \theta \,{\rm d}\theta . \end{equation}
As shown in figure 17(a), g(r) exhibits a pronounced peak at small separations (r/d), followed by a rapid decay towards g(r) ≈ 1 as the separation increases. This indicates that clustering is predominantly a short-range phenomenon. In Newtonian fluids, by contrast, g(r) ≈ 1 reflects a nearly uniform distribution, whereas nematic liquid crystals markedly enhance spatial correlations among particles. Anchoring conditions critically influence the strength of aggregation: homeotropic anchoring produces much stronger correlations than planar anchoring. In the planar case, the correlation strength is particularly sensitive to Γ; reducing Γ enhances particle clustering more effectively than varying the elastic constant K, consistent with the macroscopic observation that aggregation is stronger at low Γ. Furthermore, figure 17(b) shows that g(r) decreases monotonically with increasing volume fraction. At high concentrations, reduced interparticle spacing drives g(r) → 1, indicating the breakdown of microstructures and the transition towards a uniform suspension.
Radial distribution function at Re ≈ 1 and Ar ≈ 20.4. (a) At ϕ = 9 % in Newtonian and nematic fluids. (b) At K = 0.1, Γ = 0.5 (planar anchoring) for different volume fractions.

To quantitatively characterise the orientation of particle microstructures, we computed the order parameter
 $\langle P_2 \rangle$
(r), defined as the ensemble average of the second Legendre polynomial at a given particle separation distance r (Yin & Koch Reference Yin and Koch2007; Fornari et al. Reference Fornari, Picano and Brandt2018):
 \begin{equation} \left\langle P_{2}\right\rangle \left(r\right)=\frac{{\int }_{0}^{\pi }P(r,\theta )P_{2}(\cos \theta )\sin \theta \,{\rm d}\theta }{{\int }_{0}^{\pi }P(r,\theta )\sin \theta \,{\rm d}\theta }. \end{equation}
Here, P 2(cos θ) = (3cos2 θ − 1)/2. The values of the order parameter carry clear physical meaning: 〈P 2〉(r) = 1 indicates perfect vertical alignment at spacing r; 〈P 2〉(r) = −1/2 denotes perfect horizontal alignment; and 〈P 2〉(r) = 0 corresponds to an isotropic disordered distribution. Figure 18(a) shows 〈P 2〉(r) as a function of interparticle distance for different media at ϕ = 4.5 %. In the Newtonian fluid (Re ≈ 1), 〈P 2〉(r) reaches a minimum of −0.06 at r/d ≈ 1.25, and approaches zero at larger distances, consistent with results of Yin & Koch (Reference Yin and Koch2007), indicating near-isotropic particle distributions under the current Reynolds number. By contrast, particles in nematic liquid crystals exhibit pronounced anisotropic alignment due to elastic interactions.
Order parameter of particle pairs as a function of radial separation distance r at Re ≈ 1 and Ar ≈ 20.4. (a) At ϕ = 4.5 % in Newtonian and nematic liquid fluids. (b) At K = 0.1, Γ = 0.5 (planar anchoring), for different volume fractions. (c–e) Defect structures of particles.

Under planar anchoring, 〈P 2〉(r) > 0 at the contact distance r/d = 1, indicating vertical alignment and chain formation (figure 18 c). As the distance increases to r/d ≈ 1.25, the value of 〈P 2〉(r) becomes negative, reflecting horizontal alignment (figure 18 d). At larger separation distances, 〈P 2〉(r) remains positive, confirming long-range interactions mediated by liquid-crystal elasticity, particularly at low Γ, with decay only beginning around r/d ≈ 7. Homeotropic anchoring, in contrast, produces isotropic, tightly packed clusters due to strong defect entanglement (figure 18 e), resulting in 〈P 2〉(r) approaching zero at r/d = 1. The effect of volume fraction was also examined under planar anchoring (K = 0.1, Γ = 0.5 (P)). For all examined volume fractions, 〈P 2〉(r) remains positive at r/d = 1 and reaches a minimum at r/d ≈ 1.25. With increasing volume fraction, the overall amplitude of fluctuations in 〈P 2〉(r) decreases, and it approaches zero more rapidly at large separations, indicating that high particle concentrations enhance the disorder in the system.
Particles sediment under the action of gravity, and the instantaneous mean particle concentration in the vertical direction, 〈ζ〉 z (x, y), provides a useful measure for analysing the microstructures formed in different media. In addition, the instantaneous mean vertical velocity, 〈U z 〉 z (x, y), is employed to assess fluid–particle interactions within the flow field. Following Jiang et al. (Reference Jiang, Xu and Zhao2024), 〈ζ〉 z (x, y) and 〈U z 〉 z (x, y) are defined as
 \begin{align} \left\langle \zeta \right\rangle _{z}\left(x,y\right)&=\frac{1}{L_{z}}{\int }_{0}^{L_{z}}\zeta (x,y,z)\,{\rm d}z, \end{align}
 \begin{align} \langle U_{z}\rangle _{z}(x,y)&=\frac{1}{L_{z}}{\int }_{0}^{L_{z}}[1-\zeta (x,y,z)]U_{z}(x,y,z)\,{\rm d}z. \end{align}
Here, the indicator function equals 1 if the spatial point (x, y, z) lies inside a particle and 0 otherwise. The non-uniform distribution of 〈ζ〉 z (x, y) across the horizontal plane indicates the presence of particle microstructures.
Figure 19 illustrates the distribution of the instantaneous vertical mean particle concentration, 〈ζ〉 z (x, y), together with the instantaneous mean vertical fluid velocity, 〈U z 〉 z (x, y). In Newtonian fluids, particle concentration remains nearly uniform, and the fluid flow is relatively stable with low velocities, indicating weak fluid–particle interactions. In contrast, nematic liquid crystals exhibit markedly non-uniform particle concentration, primarily due to defect-mediated elastic forces that promote particle attraction and aggregation. In figure 19, red contour lines highlight aggregation regions, while blue contours indicate voids. This aggregation–void pattern reflects the entrainment of fluid by particle aggregates during cooperative sedimentation, accompanied by compensating upward flow that maintains global flux balance.
Instantaneous vertical mean particle concentration 〈ζ〉 z (x, y), with contours showing the instantaneous mean vertical fluid velocity 〈U z 〉 z , at Re ≈ 1 and Ar ≈ 20.4. Columns correspond to different volume fractions: (a,e,i,m,q) ϕ = 1.1 %, (b, f, j,n,r) ϕ = 2.2 %, (c,g,k,o,s) ϕ = 4.5 %, (d,h,l,p,t) ϕ = 9.0 %. Rows correspond to different fluid types: (a–d) Newtonian fluid; (e–h) nematic liquid crystal with planar anchoring: K = 0.1, Γ = 0.5; (i–l) nematic liquid crystal with planar anchoring: K = 0.05, Γ = 0.2; (m–p) nematic liquid crystal with planar anchoring: K = 0.05, Γ = 0.5; (q–t) nematic liquid crystal with homeotropic anchoring: K = 0.1, Γ = 0.5.

The coupled flow mechanism is especially evident under planar anchoring at low rotational diffusion coefficients and under homeotropic anchoring. As shown in figure 19(i–l), planar anchoring with small Γ produces localised particle accumulation consistent with the chain-like structures identified in figure 15, with the associated fluid velocity reaching its maximum across the domain. Under homeotropic anchoring, stronger agglomeration enhances overall sedimentation, with fluid–particle coupling more pronounced than in Newtonian fluids. This interaction leads to synergistic vertical co-sedimentation of particles and fluid.
5. Conclusion
This numerical study demonstrated that the collective sedimentation of spherical particles in nematic liquid crystals is governed by defect-mediated elastic interactions, leading to a distinctive non-monotonic dependence of the mean settling velocity on particle volume fraction – a marked departure from the behaviour in Newtonian fluids. We investigated the sedimentation of spherical particles in nematic liquid crystals at moderate Reynolds numbers (Re ≈ 1, Ar ≈ 20.4), considering both planar and homeotropic anchoring across a wide range of volume fractions (0.09 %–31.6 %). We systematically examined the roles of the elastic constant K, rotational diffusion constant Γ and anchoring type on the settling velocity and particle microstructure. The core findings are summarised as follows:
-
(i) Non-monotonic settling velocity: Unlike the monotonic decrease observed in Newtonian fluids, the mean settling velocity in nematic liquid crystals varies non-monotonically with volume fraction. It increases at low to intermediate concentrations owing to defect-mediated aggregation, but decreases at higher concentrations as collective resistance dominates.
-
(ii) Effects of the elastic constant K and rotational diffusion constant Γ: Varying the elastic constant K from 0.1 to 0.05 has a relatively weak impact on the mean settling velocity. In contrast, the rotational diffusion constant Γ plays a critical role in regulating the microstructure: a low Γ value stabilises chain-like assemblies and markedly enhances the sedimentation velocity. Anchoring conditions decisively dictate the sedimentation behaviour: homeotropic anchoring generates strong quadrupolar interactions that promote the formation of large aggregates and rapid settling, whereas planar anchoring yields weaker, short-chain or side-by-side structures associated with a slower descent.
-
(iii) Microstructural evolution: Microstructural analyses, including the pair distribution function, attraction probability and radial distribution function, confirm that nematic elasticity drives strong, anisotropic clustering, which stands in stark contrast to the nearly uniform distributions in Newtonian suspensions. Planar anchoring favours short chains or parallel arrangements, with low Γ stabilising extended vertical chains, while homeotropic anchoring induces quadrupolar binding into dense clusters. Order parameter analysis further reveals that these aggregates exhibit long-range orientational correlations, which are enhanced at low Γ but weakened at high volume fractions.
Overall, these results demonstrate that defect-mediated elastic interactions control both the microstructural organisation and macroscopic sedimentation in nematic suspensions. The coupling between particle aggregation and fluid motion provides a robust physical framework for tuning sedimentation dynamics through anchoring conditions and material parameters. The mechanistic insights from this work suggest potential pathways for controlling particle transport and assembly in applied contexts. For example, by leveraging the interplay between anchoring conditions, liquid-crystal elasticity and particle concentration, one could design novel strategies for the fabrication of structured materials via directed self-assembly, manipulate particle separation in microfluidic devices or optimise industrial processes involving the sedimentation of particles in anisotropic complex fluids.
While the present study focuses on direct numerical simulations, our findings provide a robust theoretical framework for future experimental validation. An ideal experimental system could employ a well-characterised, room-temperature nematic liquid crystal, such as 4-cyano-4′-pentylbiphenyl, seeded with heavy microparticles (e.g. silica spheres with a diameter of 10–50 μm) to ensure that gravity dominates the sedimentation dynamics. The crucial surface anchoring conditions can be precisely controlled via chemical treatments: coating the spheres with polyvinyl alcohol to induce planar anchoring, or with N,N-dimethyl-N-octadecyl-3-aminopropyltrimethoxysilyl chloride to achieve homeotropic anchoring. By coupling polarised optical microscopy with particle tracking techniques, future studies could simultaneously visualise the macroscopic evolution of defect networks (e.g. boojums and Saturn rings) and quantify the collective settling velocities, thereby physically validating the defect-mediated aggregation mechanisms elucidated in this work.
Detailed information on the symbols used in the text.

Acknowledgements
The authors thank all funding agencies listed above for their financial support.
Funding
This work was supported by the National Natural Science Foundation of China [grant numbers 12172152, 52376059, 12302333]; the Zhejiang Provincial Natural Science Foundation of China [grant number LR26A020004]; and the International Sci-tech Cooperation Projects under the ‘Innovation Yongjiang 2035’ [grant number 2024H016].
Declaration of interests
The authors report no conflict of interest.
Author contributions
Y.L. and H.Y. have contributed equally to this work.
Appendix A. Nomenclature
To ensure the universality and reproducibility of the model, table 2 details the key physical quantities, simulation parameters and relevant dimensionless numbers. Because the simulations are conducted using the lattice Boltzmann method, the native computational parameters are intrinsically expressed in lattice units. To map these computational values to a macroscopic physical system, we apply fundamental scaling factors for space Δx = 10−3 m, time Δt = 10−3 s and density Δρ = 103 kg m−3. Furthermore, the Archimedes number Ar serves as the primary input control parameter governing the flow regime. To guarantee that the sedimentation dynamics consistently remains within the creeping flow regime (targeting a terminal Reynolds number of Re ≈ 1), we utilise the classic empirical correlation for single-particle settling in Newtonian fluids (Yin & Koch Reference Yin and Koch2007), which yields a theoretically required nominal value of Ar ≈ 20.4.
Appendix B. Parametric study of elastic and rotational diffusion constants
To further investigate the variation characteristics of the average settling velocity with the volume fraction, additional parametric studies were conducted, as shown in figure 20. As shown in figure 20(a), fixing Γ = 0.5 and varying K = 0.05, 0.10 and 0.12, unexpectedly, further increasing the value of K to 0.12 did not continue to enhance the settling velocity of the particles. Conversely, when the volume fraction ϕ > 9 %, the average settling velocity of the particles exhibited a sharp decrease, with a magnitude of reduction far exceeding that of the K = 0.05 and K = 0.10 cases. This indicates that at higher elastic constants and volume fractions, the system enters a strongly coupled state. Specifically, this transition occurs when the decreased interparticle spacing causes the topological defect networks generated by multiple particles to severely overlap. In this regime, the excessively strong elastic interactions completely overwhelm the hydrodynamic drag reduction effect, conversely and significantly hindering particle sedimentation.
As shown in figure 20(b), fixing K = 0.05 and varying Γ = 0.2, 0.5 and 0.8, when Γ = 0.2, the particles exhibit a stronger tendency to aggregate and form chain-like structures, which leads to an average settling velocity much greater than that of the case where Γ = 0.5. However, when we continue to increase Γ to 0.8, it is found that the average settling velocity of the particles shows a relatively significant downward trend at ϕ > 9 %. As the rotational diffusion constant increases, its weakening effect on particle aggregation and settling velocity gradually tends to saturate.
Variation of the average settling velocity of the particle swarm with volume fraction at Re ≈ 1. (a) Fixed Γ = 0.5 with K = 0.05, 0.10, 0.12. (b) Fixed K = 0.05 with Γ = 0.2, 0.5, 0.8.

Appendix C. Quantitative analysis of defect volume and effective frontal area
To explicitly quantify how defect fusion modifies the effective hydrodynamic radius or frontal area, an additional structural analysis was conducted. In our model, by setting a scalar order parameter threshold of q ≤ 0.3325, liquid-crystal defect regions are identified, and particle aggregates are determined based on defect connectivity and the minimum distance between particles. For the identified defect grid points, we sum the defect volumes allocated to all particles within the aggregate, thereby obtaining the net defect volume V d tot of the aggregate. To ensure the generality of the results, we use the average defect volume V d of an isolated single particle for non-dimensionalisation, defining the dimensionless defect volume as V d * = V d tot /V d . Meanwhile, we introduce the effective frontal area ratio R to represent the ratio of the aggregate’s frontal area to the total area of its constituent particles. Specifically, R = A tot /A p N, where A tot is the projected area of the aggregate in the settling z direction, N is the number of constituent particles and A p is the projected area of a single particle. If R < 1, it indicates a reduction in the effective frontal area. As shown in figure 21, we present the relationship between the effective frontal area ratio R and the dimensionless defect volume V d *. The results show that as V d * increases, the effective frontal area ratio R decreases significantly. This indicates that the defects induce particle aggregation, allowing the resulting clusters to simultaneously exploit the hydrodynamic shielding effect, thereby significantly reducing the effective frontal area. Specifically, under planar anchoring condition, the fusion of point defects typically generates short and slightly inclined vertical chain-like structures or side-by-side structures, corresponding to a moderate V d * and a moderate reduction in R. Conversely, under homeotropic anchoring condition, the entanglement of line defects promotes the formation of larger and more isotropic compact clusters, which naturally possess a larger defect volume V d *. Therefore, at the same volume fraction, the homeotropic anchoring case exhibits a larger defect volume V d * and a significantly smaller effective area ratio R. This minimised R translates to a decrease in the effective hydrodynamic radius per unit mass – that is, the aggregate bears a driving force that is N times the gravitational force of a single particle, but encounters a hydrodynamic drag lower than N times the single-particle drag.
The relationship between the effective frontal area ratio R of particle aggregates and their defect volume
 $V_d^*$
at different volume fractions at t
* = 302.5: (a) K = 0.1, Γ = 0.5 (planar anchoring); (b) K = 0.1, Γ = 0.5 (homeotropic anchoring).

Appendix D. Dynamics of defect detachment and topological stability
We define the dimensionless time as t * = tu t /d, which represents the time required for a particle moving at the terminal velocity u t to travel a distance of one particle diameter d. A detailed evolutionary tracking of the particle disclination line was conducted between t * = 264.7 and t * = 302.5, with the specific analysis as follows.
The observed detachment process reflects the dynamic competition between hydrodynamic shear and local elastic binding during the sedimentation process. In the early stage of sedimentation (figure 22 a; t * = 264.7), the disclination line spans the periodic domain, pulling the particles into entangled clusters through long-range elastic interactions. As time progresses, the local flow shear induced by sedimentation continuously intensifies. When the fluid shear force overcomes the elastic binding, the particles undergo topological detachment from the defect line (figure 22 b–d). Eventually, at t * = 283.59 (figure 22 e), the particles completely detach, leaving the disclination line to exist independently. As observed between t * = 287.37 and 302.5 (figure 22 f–h), this independent defect line does not dissipate but maintains a high degree of stability. Therefore, it is not a transient defect.
The fundamental reason for its persistence is that this disclination line penetrates the entire computational domain in the direction of sedimentation. Due to the periodic boundary conditions in the z direction, this line is topologically equivalent to a closed loop crossing the boundary, thereby acquiring topological protection, which prevents its spontaneous contraction and annihilation driven by line tension. Such isolated, long-lived defect lines are an occasional phenomenon in our simulations, typically forming only in specific regions where the local hydrodynamic stress is extremely high, accompanied by the violent breakup of large clusters.
Time evolution of the disclination line at q = 0.31: (a) t * = 264.7, (b) t * = 272.25, (c) t * = 276.03, (d) t * = 279.81, (e) t * = 283.59, (f) t * = 287.37, (g) t * = 294.93, (h) t * = 302.5.