Implications
The differential milk response, traffic movement and use of automatic milking systems by United States Holstein or New Zealand Friesian cows were compared on two pasture-based systems. Different milk production, milking frequency and traffic behavior was observed between genotypes. The concurrent use of high stocking rate and partial mixed ration changed the milkings/day and the distribution of milkings/h, but maintained dry matter intake, milk production and pasture utilization/area. The prediction of improved feed efficiency of cows with greater milk production was confirmed by the study.
Introduction
Past research has confirmed several benefits of the adoption of automatic milking systems (AMS) in dairy farms. These benefits often include reductions in labor hours and cost, opportunity for flexible milking, better monitoring of cows and increased milk production (de Koning and Rodenburg, Reference de Koning and Rodenburg2004). However, only few published studies have explored the realized benefits of AMS in pasture-based farms (Jago et al., Reference Jago, Jackson and Woolford2007; Lyons et al., Reference Lyons, Kerrisk and Garcia2013a).
Multiple management and animal factors can affect the use of AMS in a pasture-based system. Both, the stocking rate of the AMS (i.e. cows/AMS stall) and pasture (cows/ha) have been shown to affect the milk revenue per AMS stall (Jago and Bruke, Reference Jago and Bruke2010). Likewise, feed-based incentives, such as timely, frequent and accurate allocation of pasture and/or supplements could affect the level of cow traffic and the frequency and distribution of milkings in the AMS. However, the milk response to changes in milking frequency could be highly variable both within and between cows and feeding systems (Utsumi, Reference Utsumi2011; Lyons et al., Reference Lyons, Kerrisk and Garcia2014). In previous studies, the location and amount of partial mixed ration (PMR) (Sporndly and Wredle, Reference Sporndly and Wredle2004), the timing of PMR feeding (Lyons et al., Reference Lyons, Kerrisk and Garcia2013b) or the level of concentrate offered in the AMS (Jago et al., Reference Jago, Jackson and Woolford2007) had little or no effects on the number of milkings/day and milk production. Conversely, the walking distance to pasture and both the size and frequency of pasture breaks/day can change the grazing behavior of cows and the subsequent distribution of milkings at the AMS (Ketelaar-de Lauwere et al., Reference Ketelaar-de Lauwere, Ipema, Lokhorst, Metz, Noordhuizen, Schouten and Smits2000; Lyons et al., Reference Lyons, Kerrisk and Garcia2013a).
In grazing-based AMS farms, supplements can be used as a tactical decision to either cover pasture deficits, increase milk yield or both. However, the biological efficiency of supplementation can vary widely as it can be affected by several co-varying factors, including the level of pasture allowance and pasture intake, and the type and amount of supplementation (Dillon, Reference Dillon2006). Grazing cows fed starch- or silage-based supplements are known to achieve satiety sooner, thus reaching faster cessation of grazing with concurrent decreases in pasture intake (Hills et al., Reference Hills, Wales, Dunshea, Garcia and Roche2015). Consequently, the resulting substitution rate, or decrease of pasture intake per kilogram of supplement, could reduce the marginal milk response per kilogram of supplementation (Bargo et al., Reference Bargo, Muller, Delahoy and Cassidy2002; Dillon, Reference Dillon2006). As a general rule, greater milk response to supplementation is obtained in high stocking rate (HSR) systems because conditions that are necessary to minimize pasture substitution (i.e. low pasture allowance and/or herbage mass) can be achieved more easily (Fariña et al., Reference Fariña, Garcia, Fulkerson and Barchia2011). On the other hand, the differential response to supplementation can vary widely between cows of different genetic merit, as shown by past comparisons of genotypes and their adaptability to pasture-based systems in conventional parlor milking systems (Kennedy et al., Reference Kennedy, Curran, Mayes, McEvoy, Murphy and O’Donovan2003; Horan et al., Reference Horan, Dillon, Faverdin, Delaby, Buckley and Rath2005; Fulkerson et al., Reference Fulkerson, Davison, Garcia, Hough, Goddard, Dobos and Blockey2008). Limited information is available on the differential response to AMS by genotypes that are managed in grazing systems with different stocking rate and supplementation level.
The main objective of this study was to investigate the concurrent effect of increasing stocking rates and PMR on the use of AMS, and the subsequent effects on milk production, dry matter intake (DMI) and feed conversion efficiency (FCE) by two genotypes of dairy cows. The prediction of divergent response in milk production, DMI, FCE and use of pasture and AMS by cows of different potential for milk production was tested. The variable use of PMR in amounts that were equivalent to transient deficits of herbage in a HSR system was expected to minimize farm system differences in pasture utilization/ha compared with a control low stocking rate (LSR) treatment with no PMR.
Material and methods
Study site
The study was carried out at the Michigan State University’s Pasture Dairy Research Center (PDRC) located at the W.K. Kellogg Biological Station, Hickory Corners, MI, USA, during an 8-week period (56 days) in the months of August, September and October of 2011. Protocols for animal handling have been reviewed, approved and conducted according to the University’s Institutional Animal Care and Use Committee office (Project number: 9/10-144-00).
Soils at PDRC are typical hapludalfs with a sandy loam layer over the first 30 cm followed by variable clay and gravelly sand layers. These soils have deep profile, high drainage capacity, rapid infiltration and moderate water-holding capacity. The annual precipitation ranges between 760 and 915 mm, the mean annual air temperature 9.5°C (range: −16.7°C to 32.2°C) and the frost-free period ranges between 140 and 150 days.
Experimental design and animals
The study followed a completely randomized design with a 2×2 factorial arrangement of two genotypes of dairy cattle and two pasture-based feeding treatments. Feeding treatments were as follows: (a) an LSR system (2 cows/ha) fed temperate pasture and concentrate, and (b) an HSR system (3 cows/ha) fed same pasture and concentrate, as in LSR, plus PMR. The HSR and LSR treatments were grazed separately by two herds of 47±3 cows (on given study day) from which 28 mid-lactation cows (127±4 days in milk (DIM)) in total, including 14 United States Holstein cows (USH) and 14 New Zealand Friesian cows (NZF), were used for comparisons. A randomized allocation of USH and NZF cows to grazing treatments was used, but adjustments in the final order were made to achieve groups balanced for DIM. The characteristics of cows were as follows: USH cows: parity: 1.4±0.10, DIM: 130±7, BW: 521±11 kg, and NZF cows: parity: 1.0±0, DIM: 124±4, BW: 376±5 kg. The resulting composition of animal groups by lactation number was as follows: USH-HSR and USH-LSR groups: three second lactation cows and four first lactation cows, respectively, and NZF-HSR and NZF-LSR groups: seven first lactation cows, respectively. All cows were well conditioned to being managed on routing settings controlling the voluntary and independent use of milking stalls, access to pasture, feed yard, and allocation of concentrates in milking stalls and automatic feeders.
Milking barn and pasture layout
The PDRC included separated grazing platforms for HSR (16 ha) and LSR (24 ha) connected via two-way laneways to a central milking barn. The split design of the milking facility allowed the separate management of HSR and LSR cows according to a voluntary milking system. The milking facility included two identical pens laid out on a ‘free traffic system.’ Each pen was equipped with one single-stall AMS (Lely A3; Lely Industries, N.V., Maassluis, The Netherlands), one grain feeder (Lely Cosmix; Lely Industries, N.V.) and freestalls (58 stalls/AMS) on double rows. Pens also had a feed yard (48 m long) equipped with headlock system (80 cm/cow) for supplementation of PMR (offered only in HSR). The AMS was always accessible for milking except during cleaning cycles at 0500 and 1700 h for about 35 min each time. Upon a cow visit, the AMS proceeded either with the completion of the milking routine or the denial of the cow for milking, in which case the visit was defined as a ‘milking refusal.’ This selective permission for milking varied for each cow and was based on a minimum milking interval of 6 h and an expected yield per milking of at least 9 kg. Cows were able to milk up to four times per day. When the AMS failed on six consecutive attempts to complete attachments or to milk a cow, the visit was ended and registered as a ‘milking failure.’ All failed cows were allowed permission to be milked again immediately. However, any failed cow and those cows remaining in the barn with a previous interval of 16 h or longer were brought for a supervised milking before the morning and afternoon cleaning cycles. Cows gained access to pasture through sorting gates (Lely Grazeway; Ley Industries, N.V.) controlled by the AMS; cows were drafted to pasture if they have been successfully milked according to the pre-defined milk setting described above. Otherwise, were returned to the barn for milking. Any failed cow or those remaining in the barn with a previous interval of 16 h or longer were brought for a supervised milking before the morning and afternoon AMS cleaning cycles. All cows had access to the milking barn at all times during the duration of the study. The two-way laneways (4 m wide) guided the traffic of cows between grazing paddocks and the milking barn. Fresh, clean water was always available in water troughs (3 m wide) distributed across the milking facility. No water was available at pasture.
Grazing management and feeding protocols
Grazing management consisted in the rotational grazing across 1-ha paddocks containing orchardgrass (Dactylis glomerata), tall fescue (Festuca arundinacea), perennial ryegrass (Lolium perenne), and alfalfa (Medicago sativa), red clover (Trifolium pratense) and white clover (Trifolium repens) as dominant species. The proportion of legumes was 40% to 50%. Each day, the HSR and LSR groups received one break of fresh pasture, using a one-way grazing system. Pasture breaks were made available at 0500 h, coincident with the offering of PMR in the HSR system. A similar average distance to grazing paddocks of 275±7 m (one way) was used for HSR and LSR.
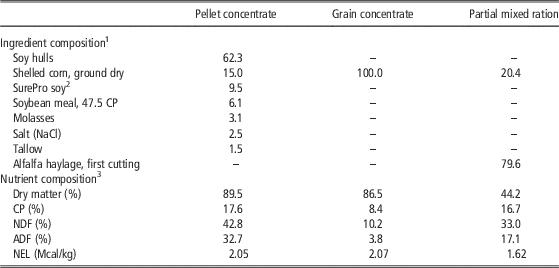
The approximate daily allowance was 42 kg dry matter (DM)/cow in LSR and 31 kg DM/cow in HSR, respectively. The criteria to define pasture allocations considered the following rules: (a) maintenance of pre-grazing herbage mass of 2000 kg DM/ha, (b) maintenance of post-grazing herbage mass or residual of 1200 kg DM/ha, (c) maintenance of an average herbage mass of 1600 kg/DM across the site and (d) an average consumption of 38 Mcal/day of metabolizable energy or the equivalent of 16 kg DM/cow in LSR or same 16 kg DM/cow from the combination of pasture and PMR in HSR. Therefore, PMR in HSR was used to minimize herbage deficits that resulted from the increase in stocking rate, but without sacrificing pasture growth rate (PGR), use of pasture/ha or modifying DMI (Fariña et al., Reference Fariña, Garcia, Fulkerson and Barchia2011). The PMR was predominantly forage (Table 1) and formulated to a similar energy value as that of pasture. The amount of PMR fed was adjusted weekly according to variations in PGR and herbage mass. From week 1 to week 8, average PMR supplementation was 4.2, 5.3, 4.9, 4.5, 4.5, 4.9, 5.3 and 5.1±0.5 kg DM/cow, respectively. The concentrate offered to LSR and HSR cows (Table 1) included 1 kg DM of pellet concentrate per every 6 kg of milk (range: 2 to 7 kg DM/day), fed during milkings in the AMS, and a flat rate of 1.36 kg DM/day of ground corn made available in automatic grain feeders. Cows had free access to mineral and vitamin supplements available in the barn.
Ingredient and nutrient composition of supplemental feedstuffs

NEL=net energy for lactation.
1 Composition determined as-fed.
2 Treated soybean meal, 74% bypass protein (Land O’Lakes, Shoreview, MN, USA).
3 Composition determined on a dry weight basis.
Pasture measurements
Herbage mass, growth rate and forage chemical analysis
The pre-grazing and post-grazing herbage mass was determined indirectly through double sampling of sward height (Mannetje and Jones, Reference Macoon, Sollemberger, Staples, Portier, Fike and Moorell2000). Sward height before and after grazing was measured with an electronic rising plate meter (RPM F400; Farmworks, Feilding, New Zealand), using 30 sward height readings distributed alongside pasture allocations. A pre-defined equation (y=92x; R 2=87; n=132) was developed on site to convert sward height (x, cm) into herbage mass (y, kg DM/ha). Pasture disappearance (kg DM/ha) was the difference between the pre-grazing and post-grazing herbage mass recorded by the plate meter. Grazing intensity was the pasture disappearance divided by the pre-grazing mass.
PGR (kg DM/ha per day) was determined weekly, using indirect estimations of herbage mass by a portable optical device (CDAX rapid pasture meter; Agricultural Solutions, Ltd, Palmerston North, New Zealand). The device provided high-resolution data of sward heights (sampling rate was 200 MHz) alongside a linear transect in all paddocks. The calculation of herbage mass (y, kg DM/ha) from sward height (x, mm) was conducted with a pre-defined equation (y=417+7.5x; R 2=92; n=73) developed on site. The resulting PGR was the difference of herbage mass between two consecutive measurements, divided by the days between measurements. Paddocks being grazed or that had been grazed during the measurement interval were not included in the calculation.
In addition, composite herbage samples were collected once per week through clipping to ground level of three 50×50 cm quadrats in HSR and LSR. Samples were dried for 48 h at 60°C, ground on a Christy mill through a 1 mm screen and stored for analysis of CP (Combustion System 4010 CN; Costech Analytical Techologies, Inc., Valencia, CA, USA), NDF and ADF (Ankom 200 Analyzer; ANKOM Technology Corp., Fairport, NY, USA), and 48 h in vitro true digestibility (IVTD; Ankom Daisy II; ANKOM Technology Corp.).
Animal measurements
AMS data and milk sampling
The AMS identified each cow visit by an electronic ID collar and collected information on BW, milk production, milkings/day, refusals/day, failures/day, and amount of concentrates distributed in milking stalls and grain feeders. Daily records of individual cows were retrieved by the use of software interface (T4C software; Lely Industries N.V.). Milk samples of morning milkings starting after 0500 h were automatically collected by the AMS (Shuttle milk sampling unit; Lely Industries N.V.) on weeks 1, 4 and 8, and samples were submitted to the dairy herd improvement laboratory (NorthStar Cooperative, Inc., East Lansing, MI, USA) for determination of milk fat, milk protein, milk urea nitrogen (MUN) and somatic cell count. Calculation of average energy-corrected milk (ECM) was conducted by the equation: ECM=kg×(383×fat%+242×protein%+783.2)/3140 (Tyrrell and Reid, Reference Tyrrell and Reid1965).
DMI and feed conversion
Individual DMI was measured once, during weeks 4 and 5, using Cr2O3 as indigestible marker. Cows were orally dosed with gelatin capsules containing 10 g of Cr2O3, once daily for 10 days at 0700 h. Fecal grab samples were taken once daily for the last 5 days of the dosing period. Fecal samples were dried at 55°C in a forced air oven and ground through a 1 mm screen for analysis of Cr concentration (Parker et al., Reference Parker, McCutcheon and Carr1989) by atomic absorption spectroscopy (model 3110; PerkinElmer, Waltham, MA, USA). During the period of DMI determination, additional composite samples of pasture (above a 5 cm height, approximately), PMR and concentrates were collected, processed and analyzed for CP, NDF, ADF and 48-h IVTD, as described previously. Average consumption of PMR in HSR was determined daily as the difference between PMR offered and orts, divided by the number of cows. Similar to the study by Haque et al. (Reference Haque, Cornou and Madsen2014), individual intake of PMR was estimated as the average consumption of PMR (on a % BW basis) weighed by the BW of each cow. Following Bargo et al. (Reference Bargo, Muller, Delahoy and Cassidy2002), the DMI of pasture was determined by the equation: pasture DMI=[(g Cr/day)/(g Cr/g fecal DM)−grain concentrate DMI×(1−IVTD of grain concentrate)−pellet DMI×(1−IVTD of pellet)]/(1−IVTD of pasture) for LSR, and total DMI=[(g Cr/day)/(g Cr/g fecal DM)−grain concentrate DMI×(1−IVTD of grain concentrate)−pellet DMI×(1−IVTD of pellet)−estimated PMR DMI×(1−IVTD of PMR)]/(1−IVTD of pasture) for HSR. Total DMI intake for LSR cows was grain concentrate DMI+pellets DMI+pastures DMI, and for the HSR cows was grain concentrate DMI+pellet DMI+PMR DMI+pasture DMI. Forage DMI was assumed to be pasture DMI in LSR and pasture DMI+PMR in HSR. The total DMI determined by the Cr2O3 technique was used to evaluate the FCE, calculated as the quotient between ECM and DMI.
Traffic of cows and time budget
Traffic movement was recorded on a subset of 12 focal cows in total, six USH and six NZF cows, with half of the cows in HSR and the other half in LSR, respectively. Cows were fitted with Global Positioning System (GPS) collars (Lotek 3300; Lotek Wireless, Inc., Newmarket, ON, Canada). The GPS was set to collect locations (±5 m error) every 5 min, with a 1-day break between days 16 and 17 for battery replacement. Differentially corrected data were imported into GIS (ArcGIS 9.3; Environmental Systems Research, Inc., Redlands, CA, USA) for analysis of traveled distance (m/day), duration (min) and number of pasture visits/day, and time budget, including time at pasture, milking barn and laneways. For the purpose of this study, a ‘pasture visit’ and its duration was defined by the series of consecutive GPS fixes co-occurring within a given pasture allocation. The distance traveled/day (without grazing) was calculated as the two-way walking distance to a given paddock multiplied by the number of visits.
Statistical analyses
Data were analyzed by least-squares ANOVA using the MIXED procedure of SAS (version 9.2; SAS Institute, Inc., Cary, NC, USA). Herbage characteristics were analyzed using paddocks as individual replicates. The following repeated measure mixed model was used:
 $$Y_{{ijk}}=\mu {\plus}T_{i} {\plus}P_{j} {\plus}W_{k} {\plus}T_{i} W_{k} {\plus}e_{{ijk}} $$
where Y ijk is the dependent response variable, μ the overall mean, T i the treatment i (HSR or LSR), P j the random effect of paddock j, W k the repeated measure effect of week k (1 to 8), T i W j the interaction between treatment and week, and e ijk the residual error term.
All animal production variables and AMS use variables considered the experimental cows as individual replicates (Kennedy et al., Reference Kennedy, Dillon, Delaby and Faverdin2011). The difference in parity of cows (one and two for primiparous and multiparous cows, respectively) was included in models as covariate. Consequently, the following repeated measure mixed model was used:
 $$\eqalign {Y_{{ijklm}} = \mu {\plus}P_{i} {\plus}T_{j} {\plus}G_{k} {\plus}T_{j} G_{k} {\plus}C_{{l(jk)}} {\plus}W_{m} \cr {\plus}T_{j} W_{m} {\plus}G_{k} W_{m} {\plus}T_{j} G_{k} W_{m} {\plus}e_{{ijklm}} $$
where Y ijklm is the dependent response variable, μ the overall mean, P i the parity (one or two) used as a covariate, T j the treatment j (HSR or LSR), G k the genotype k (USH or NZF), T j G k the interaction between treatment and genotype, C l(jk) the random effect of cow l, W m the repeated measure effect of week m (1 to 8), T j W m the interaction between treatment and week, G k W m the interaction between genotype and week, T j G k W m the interaction between treatment, genotype and week, and e ijklm the residual error term.
Data of time budget and cow traffic were pooled by cow before analysis. The following mixed model was used:
 $$Y_{{ijkl}} =\mu {\plus}P_{i} {\plus}T_{j} {\plus}G_{k} {\plus}T_{j} G_{k} {\plus}e_{{ijkl}} $$
where Y ijkl is the dependent response variable, μ the overall mean, P i the parity (one or two) used as a covariate, T j the treatment j (HSR or LSR), G k the genotype k (USH or NZF), T j G k the interaction between treatment and genotype, and e ijklm the residual error term.
Before the final analyses, selection for best covariance among unstructured, compound symmetry and autoregressive order 1 structure were conducted by the lowest Bayesian information criterion (Littell et al., Reference Littell, Milliken, Stroup, Wolfinger and Schabenberger2006). All mixed models used Kenward–Rogers as method for calculation of denominator degrees of freedom. Significance was declared at 5% α. Significant interactions were examined by post hoc analysis of means using a protected Tukey–Kramer test (α=5%).
The analysis of milking distribution was conducted using the FREQUENCY procedure of SAS. Significance for χ 2 tests (α=0.05) were used to test differences between treatments (HSR or LSR) or genotypes (USH or NZF) in relative frequency of milkings at any particular hour.
Results
Weather
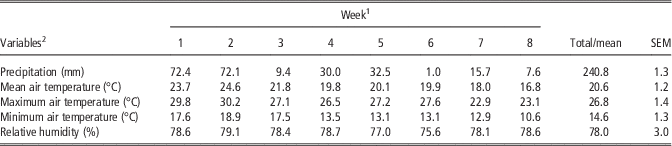
Variable weather was observed (Table 2). Dry condition at study onset (data not shown) was followed by uneven rainfall events with 60% of the total precipitation in the first 2 weeks (Table 2). Average and maximum air temperature were highest in the first 2 weeks; after which average air temperature range was between 22°C and 17°C. Sunrise on the 1st day of the experiment occurred at 0624 h and sunset at 2112 h, whereas in the last day of the study sunrise was at 0722 h and sunset at 1951 h. Daylight length range during the study was 14 h 48 min to 12 h 29 min.
Weather characteristics during the study

1 Week=week of study.
2 Collected on site using a wireless weather monitoring station ET107 (Campbell Scientific, Inc., Logan, UT, USA).
Pasture herbage mass, growth rate and chemical characteristics
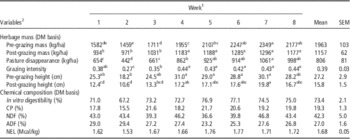
There were no differences (P>0.05) between grazing treatments or interactions between grazing treatments and week on herbage mass, pasture height or pasture chemical characteristics, therefore average values are reported (Table 3). Significant variation across weeks was detected on pre-grazing and post-grazing herbage mass and height, grazing intensity and pasture disappearance (Table 3). Pre-grazing herbage mass and height, grazing intensity and pasture disappearance were lower in the first 2 weeks and increased from week 3 until the end of the study (Table 3). No differences in pasture CP, NDF, ADF or IVTD were detected across weeks (Table 3).
Herbage mass and chemical characteristics

DM=dry matter; NEL=net energy for lactation.
1 Week=week of the study.
2 Herbage mass and chemical composition variables were determined on a dry weight basis.
a,b,c,d,eValues within a row with different superscripts differ significantly (Tukey–Kramer; P<0.05).
Animal response
Milk production and use of AMS
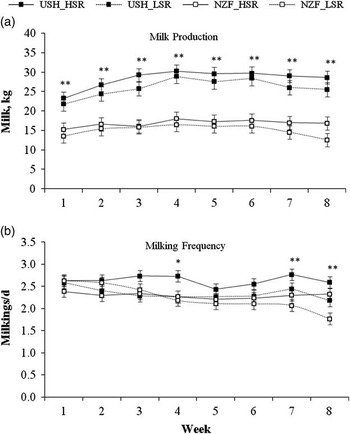
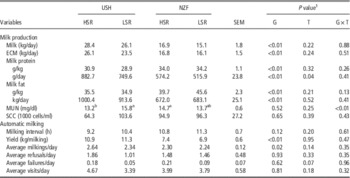
Milk production was affected (P=0.05) by a treatment×genotype×week interaction (Figure 1a), whereas a marginal tendency for the same three-way interaction was observed on milking intervals (P=0.08) and milkings/day (P=0.07; Figure 1b). The production of ECM was not affected (P=0.21) by the same three-way interaction, but a significant (P=0.004) interaction between genotype and week was observed on ECM. The difference in milk production between genotypes varied across weeks (P<0.0001) owing to greater increase in milk yield by USH cows from week 4 to week 8 (Figure 1a).
Milk production (a) and milking frequency (b) by United States Holstein (USH) and New Zealand Friesian (NZF) cows (n=28) milked with automatic milking systems and managed on a high stocking rate (HSR=3 cows/ha) v. low stocking rate (LSR=2 cows/ha). Diets included temperate pasture and concentrate feed in LSR or pasture and same level of concentrate feed plus feeding of partial mixed ration in HSR. There was a significant genotype×treatment×week interaction on milk production (P=0.05) and a significant genotype×week interaction on milking frequency (P<0.01). Vertical bars represent SEM. Asterisk symbols denote significant differences among the four genotype–stocking rate groups (a) or genotypes (b) within a given study week (**P<0.05; *P<0.10).

The milking frequency and resulting milking intervals were also affected by a significant (P<0.0001) treatment×week interaction, whereas a tendency (P=0.09) for the same two-way interaction on milk production was attributed to a more consistent milk yield in HSR cows receiving PMR supplementation (Figure 1a). On average, the USH cows had higher (P<0.0001) milk production (27.3±1.2 kg) than the NZF counterparts (16.0±1.2 kg), regardless of the week or stocking rate treatment. Conversely, the NZF cows, particularly those in LSR, reduced (P=0.05) their milking frequency by the last weeks of the study (Figure 1b), and despite the fact that the two genotypes visited the AMS on a same frequency throughout the entire duration of the study (4.0±0.4 visits/day; Table 4).
Milk production, milk characteristics and composition, and use of automatic milking systems by two genotypes of dairy cows on two pasture-based feeding systems

USH=United States Holstein; NZF=New Zealand Friesian; HSR=high stocking rate system fed pasture, concentrate and partial mixed ration; LSR=low stocking rate system fed pasture and concentrate with no inclusion of partial mixed ration; ECM=energy-corrected milk; MUN=milk urea nitrogen; SSC=somatic cells count.
1 ANOVA effect of G: genotype; T: stocking rate feeding system treatment; G×T interaction.
a,bValues within a row with different superscripts differ significantly (Tukey–Kramer; P<0.05).
Milk composition
A significant (P=0.001) treatment×week interaction was detected on milk fat concentration, explained by the increase and decrease in milk fat over time for LSR and HSR, respectively. Milk protein was not different between treatments, but increased (P<0.0001) from 31.4±0.5 g/kg in week 1 to 33.0±0.5 g/kg in week 8. Milk fat and milk protein concentrations were higher for NZF (milk fat: 42.7±1.6 g/kg, milk protein: 34.0±0.7 g/kg) than USH cows (milk fat: 35.3±1.6 g/kg, milk protein: 30.1±0.7 g/kg). Conversely, milk protein and fat yield were greater for USH (milk protein: 816.2±33.6 g/day; milk fat: 957.0±44.1 g/day) than NZF cows (milk protein: 545.1±33.6 g/day; milk fat: 677.57±44.1 g/day). A grazing treatment×genotype interaction was detected on MUN, which was related to a greater MUN in USH-LSR cows compared with USH-HSR animals (Table 4).
Feed intake and FCE
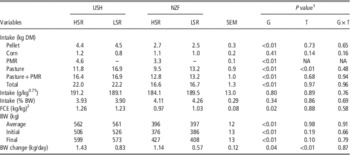
Differences in total DMI and DMI of most dietary components were detected between genotypes (Table 5). On average, USH cows consumed 22.1±0.8 kg DM, whereas NZF cows consumed 16.6±0.8 kg DM. The difference in DMI disappeared with adjustments for BW or metabolic BW (Table 5). Cows consumed 4.1±0.1% of their BW or the equivalent of 188.5±1.5 g/kg0.75. No difference in FCE between grazing treatments or interaction between grazing treatments and genotypes were observed (Table 5). The FCE was 25% higher (P=0.02) for USH (1.25±0.06) than NZF cows (1.01±0.06).
Feed intake, feed conversion efficiency (FCE) and BW change by two genotypes of dairy cows milked with automatic milking systems on two pasture-based feeding systems

USH=United States Holstein; NZF=New Zealand Friesian; HSR=high stocking rate system fed pasture, concentrate and partial mixed ration (PMR); LSR=low stocking rate system fed pasture and concentrate with no inclusion of PMR; DM=dry matter; NA=not applicable.
1 ANOVA effect of G: genotype; T: stocking rate feeding system treatment; G×T interaction.
2 FCE: feed conversion efficiency=energy-corrected milk/total dry matter intake.
Traffic and time budget
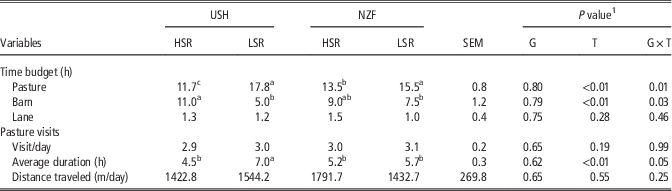
The time spent at pasture (h/day and h/visit) and inside the milking barn were the only variables explaining differences in time budget (Table 6). The time at pasture was also affected by a significant treatment×genotype interaction (Table 6). The USH and NZF cows fed PMR in HSR reduced the time at pasture by 6 and 2 h, respectively (Table 6). Conversely, USH-LSR cows increased the duration of pasture visits compared with all other three groups (Table 6). No difference in total distance traveled/day was observed between treatments or genotypes (Table 6).
Time budget and traffic by two genotypes of dairy cows milked with automatic milking systems on two pasture-based feeding systems

USH=United States Holstein; NZF=New Zealand Friesian; HSR=high stocking rate system fed pasture, concentrate and partial mixed ration; LSR=low stocking rate system fed pasture and concentrate with no inclusion of partial mixed ration.
1 ANOVA effect of G: genotype; T: stocking rate feeding system treatment; G×T interaction.
a,b,cValues within a row with different superscripts differ significantly (Tukey–Kramer; P<0.05).
Milking distribution
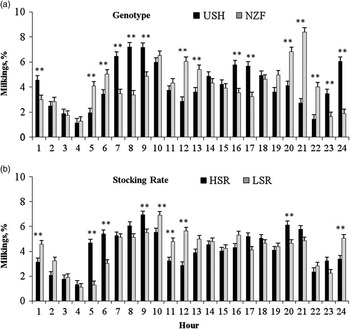
Differences in distribution of milkings/h were observed between treatments and genotypes. As shown in Figure 2, AMS occupation between 0300 and 0400 h was always low regardless of the genotype (Figure 2a) or grazing treatment (Figure 2b), but feeding of PMR at 0500 h in HSR immediately increased the utilization of AMS from 0500 to 0900 h. Cows in LSR increased the use of the AMS from 0600 to 1000 h and maintained a steady use of the AMS from 1100 to 2100 h. Opposite, yet complementary milking patterns by USH and NZF were observed (Figure 2a). Visitations to the AMS by USH peaked between 0700 and 0900, 1600 and 1700, and 2300 and 0100 h. Conversely, visitations to the AMS by NZF were highest between 0500 and 0600, 1200 and 1300, and 2000 and 2200 h (Figure 2a).
Daily distribution of milkings by two genotypes of dairy cattle (a), United States Holstein (USH) or New Zealand Friesian (NZF) cows (n=28), milked with automatic milking systems at two stocking rates (b), high stocking rate system (HSR=3 cows/ha) or low stocking rate system (LSR=2 cows/ha). Diets were temperate pasture and concentrate feed in LSR, or pasture and same level of concentrate feed plus once a day feeding of partial mixed ration at 0500 h in HSR. There was a significant genotype and treatment effect (P<0.001). Vertical bars represent SEM. Differences between genotypes (a) or stocking rate treatments (b) for a given hour of the day are indicated by asterisk symbols (**P<0.05).

Discussion
The objective of this study was to examine potential genotype–environmental (i.e. feeding systems) interactions that can affect the milk production and use of AMS in pasture-based systems. The study lasted 8 weeks and included cows of two dairy breeds (USH v. NZF) that were commonly managed on two pasture-based feeding systems (PMR v. no PMR supplementation) with separate AMS units and pasture allocations. Therefore, results on animal responses are discussed with the acknowledgment and caution of the short duration of measurements (8 weeks) and the lack of independent replication of treatments across grazing groups.
Milk production and use of AMS
The results are discussed in the context of genotype×environmental interactions, as differences in milk production between genotypes were significantly affected by changes in herbage mass (Table 3), mostly driven by prevailing changes in precipitation (Table 2). First, the response to changes in herbage mass over time was greater for USH than NZF counterparts (Figure 1a). This differential response was related to sharper decreases in milk production by high-producing cows when herbage mass fell below prescribed values (2000 kg DM/ha). This observation is consistent with previous reports showing lower milk production with pre-grazing herbage mass below 1700 (Tuñon et al., Reference Tuñon, Lopez-Villalobos, Kemp, Kennedy, Hennessy and O’Donovan2011) to 1800 kg/ha (Macoon et al., Reference Mannetje and Jones2011). Second, the differential feeding of PMR in HSR was related to a different marginal response (i.e. milk per unit of PMR fed) by genotypes. From week 1 to week 4, USH cows increased about 1.1 kg of milk/kg of PMR offered, whereas NZF cows increased 0.6 kg of milk/kg of PMR fed. However, no marginal response to PMR was observed beyond week 4. Similar findings were reported by Stockdale (Reference Stockdale1994), who found responses of 0.8 to 1.2 kg of milk for each of the first 4 to 5 kg of silage offered to cows grossly underfed ryegrass or persian clover. Stockdale (Reference Stockdale1994) also reported no marginal milk response with silage above 5 kg, because apparent feed deficits were already rectified. Holden et al. (Reference Holden, Muller, Varga and Hillard1995) also found lack of milk response to silage supplementation when herbage mass and intake were not limiting the production by unsupplemented cows. Thus, findings indicate that the temporal divergence in milk production and milk response to PMR were dependent on the response by genotypes to changes in herbage mass. The NZF cows had lower BW, milk production and overall requirements, which may have explained the lower response to PMR feeding and the more stable but lower milk production, even when herbage mass may have limited the milk production by USH cows. Finally, cows visited the AMS an average of four times per day, but the actual milking frequency per day was lower owing to the occurrence of selective machine refusals (Table 4). In addition, the milking frequency was different between genotypes and weeks, which was likely a differential response of genotypes to differences in pasture cover that were driven by changes in weather factors. Interestingly, the USH cows nearly maintained a greater number of milkings/day, despite the changes of milk production over time (Figure 1b). Conversely, NZF cows particularly those in LSR reduced the number of milkings/day (Figure 1b), but maintained a low milk production (Figure 1a). Thus, milkings/day and its changes over time had little or no effect on milk production, particularly in low-producing animals. This suggests that cows were able to cope with low milking frequency (at ~2× milking) and that milk production was more likely limited by nutrition (i.e. change in herbage mass) and/or genetic potential (Clark et al., Reference Clark, Phyn, Tong, Collis and Dalley2006). Results therefore suggest that a more effective approach to increase the revenue of the AMS in pasture-based systems is through increases in cows/AMS and not milkings/day on individual cows.
Intake and FCE
The results of DMI are discussed with the acknowledgment of possible overestimations by the chromium technique (Holden et al., Reference Holden, Muller, Lykos and Cassidy1994) and potential social interferences on pasture access, intake and feed efficiency that may have resulted from the management of genotypes in a common grazing group (Hills et al., Reference Hills, Wales, Dunshea, Garcia and Roche2015). As expected by the strategic feeding of PMR, no differences in total DMI or DMI of pasture v. DMI of pasture+PMR were detected between LSR and HSR. Conversely, as predicted by the experimental design, total DMI was 30% greater in USH cows, but differences between genotypes disappeared when DMI was corrected for BW. This result may indicate similar consumption capacity by genotypes, when both were exposed to pasture-based systems differing in stocking rate, PMR allocation and concentrates. Likewise, FCE (kg of ECM/kg DMI) was not different between grazing treatments, but a 25% difference was observed between genotypes. The greater gross FCE by USH cows was most likely related to an increased capacity of high-producing animals to partition more nutrients for milk production and synthesis of more milk solids, and to a greater dilution of maintenance requirements (Dijkstra et al., Reference Dijkstra, France, Ellis, Strathe, Kebrab and Bammik2013). This differential FCE in favor of USH cows is supported by earlier studies that have documented greater FCE response in high-producing cows when feed availability in pasture-based systems is not a limiting factor to high milk production (Kennedy et al., Reference Kennedy, Curran, Mayes, McEvoy, Murphy and O’Donovan2003; Horan et al., Reference Horan, Dillon, Faverdin, Delaby, Buckley and Rath2005). Finally, NZF cows had greater concentration of milk fat and protein, but produced lower total milk solids owing to their lower milk yield.
Time budget
As expected, HSR cows fed PMR spent less time at pasture (per visit and overall). Despite this difference, the number of pasture visits and visitations to the AMS did not differ between LSR and HSR. The USH and NZF cows in the HSR treatment consumed an average of 4.6 and 3.3 kg/cow of PMR while reducing voluntarily the time at pasture by about 360 min (6 h) and 120 min (2 h), respectively (Table 6). Therefore, reductions of 78 and 36 min of access time to pasture per kg of PMR fed were found for USH and NZF cows, respectively. Interestingly, the observed changes in access to pasture had no effect on milk production, because cows may have relied on different grazing strategies to cope with environmental changes or dietary differences between HSR and LSR. Previous studies showed that cows were able to adjust the grazing behavior at pasture in response to PMR supplementation and/or duration of scheduled pasture allocations (Bargo et al., Reference Bargo, Muller, Delahoy and Cassidy2002). Cows increasingly restricted to graze at pasture generally increase the proportion of time spent grazing and/or the intake per bite, two compensatory strategies that maximize the instantaneous intake rate (Pérez-Ramírez et al., Reference Pérez-Ramírez, Delagarde and Delaby2008; Kennedy et al., Reference Kennedy, Dillon, Delaby and Faverdin2011). Conversely, increasing silage supplementation on same restricted cows can reduce grazing time and/or the proportion of time spent grazing (Pérez-Ramírez et al., Reference Pérez-Ramírez, Delagarde and Delaby2008; Kennedy et al., Reference Kennedy, Dillon, Delaby and Faverdin2011). Thus, cows of the present study may have adjusted the duration and/or intensity of grazing in response to PMR supplementation and available opportunities to access pasture on a voluntary basis.
Milking distribution
The pattern of milkings in HSR shifted with an increase in milkings/h following PMR feeding at 0500 h. Besides this change, a typical diurnal pattern of AMS use was characterized by a reduced frequency of milkings from 0200 to 0500 h (Figure 2b). The pattern of milkings/h also shifted between genotypes (Figure 2a), suggesting a complementary use of the AMS. Although NZF and USH cows had a low frequency of milkings/h between 0200 and 0400 h, NZF cows may have programmed the use of the AMS more opportunistically by avoiding hours of high AMS use by USH cows. This programmed use of AMS could be a behavioral response to differences in dominance status and social rank (Jago et al., Reference Jago, Davis, Copeman, Ohnstad and Woolford2003). Heavier–bolder high-producing USH cows may have induced low ranking, timid NZF cows to use the AMS at hours of lower visitations. This observation is supported by the study of Ketelaar-de Lauwere et al. (Reference Ketelaar-de Lauwere, Devir and Metz1996), who also found that cows with consistently low rank shifted visitations to the AMS to avoid competition by high rank animals. Thus, findings suggest that there might be potential to exploit complementary behaviors among individuals or breeds in order to maintain or improve even distribution of milkings in the AMS.
Conclusion
The prediction of divergent responses by genotypes of dairy cattle to environmental changes in a pasture-based AMS system was confirmed, as well as on the use of PMR as a tool to maintain desirable pasture use/ha, DMI and milk production in highly stocked systems. The NZF cows had more stable milk production and therefore were more resilient to limitations of herbage mass at study onset. However, when herbage mass improved USH cows excelled in milk production efficiency. Differences between genotypes included greater ECM, milk protein and milk fat yield, and BW gain in response to a better FCE by USH cows. The USH cows also achieved greater milkings/day and the NZF cows shifted their distribution of milkings/h to different hours of the day. Finally, the increase in stocking rate with the concurrent, commensurate feeding of PMR is suggested as a tactical practice for farmers that have desire to maintain (or perhaps increase) DMI and milk production without sacrificing utilization of pasture. Although the present study provided valuable evidence on the milk response and use of AMS by dairy breeds, additional carefully designed research conducted over longer time periods is needed to examine the effects of stocking rates and feeding systems on the entire lactation performance of cows and pasture utilization over the entire grazing season.
Acknowledgments
Authors want to thank the KBS dairy staff for their assistance with the study, and David Weed and Stacey Vanderwulp who assisted with laboratory analyses. This study was partially funded by a grant of the W.K. Kellogg Foundation to MSU-KBS, contributions from MSU-AgBioResearch, the USDA National Institute of Food and Agriculture, project (MICL02224), and support to Christine Nieman and Katherine Steensma through NSF fellowships.