This study focuses on geographical variation in grammatical constraints on the English particle verb (PV) alternation, exemplified in (1) and (2), which hinges here on the variation in the ordering of the direct object, the book, and the postverbal particle up.Footnote 1
(1) the continuous variant/order (V-P-O):
My 6yo [sic] old actually picked up the book and started reading it! <GloWbE:NZ>
(2) the split variant (V-O-P):
I have not picked the book up in 2 years. <GloWbE:CA>
In this paper, we investigate the degree of (in)stability in the factors, such as the length and information status of the direct object, which probabilistically influence the choice between these variants among different varieties of English around the world. Particle placement has been a popular research topic in recent years, especially in usage-based studies of variation (e.g., Cappelle, Reference Cappelle, Bergs and Diewald2009; Goldberg, Reference Goldberg, Nash and Samvelian2016; Gries, Reference Gries2003; Lohse, Hawkins, & Wasow, Reference Lohse, Hawkins and Wasow2004; Szmrecsanyi, Grafmiller, Heller, & Röthlisberger, Reference Szmrecsanyi, Grafmiller, Heller and Röthlisberger2016), as well as in diachronic studies (e.g., Elenbaas, Reference Elenbaas2013; Rodríguez-Puente, Reference Rodríguez-Puente2016; Thim, Reference Thim2012), and L1 and L2 acquisition research (e.g., Diessel & Tomasello, Reference Diessel and Tomasello2005; Gilquin, Reference Gilquin2014; Gries, Reference Gries and Medina2011). Bringing together insights from these various domains, the present study contributes to a growing body of work investigating the nature and limits of grammatical variation among so-called World EnglishesFootnote 2 in order to identify cross-varietal differences in the factors conditioning syntactic variables (see also Bernaisch, Gries, & Mukherjee, Reference Bernaisch, Gries and Mukherjee2014; Bresnan & Ford, Reference Bresnan and Ford2010; Bresnan & Hay, Reference Bresnan and Hay2008). In doing so, we present an innovative technique for comparative sociolinguistic research (Poplack & Tagliamonte, Reference Poplack and Tagliamonte2001; Tagliamonte, Reference Tagliamonte, Chambers and Schilling2013) that incorporates both predictive modeling and linguistic distance measures to examine the degree to which the grammatical system that underlies particle placement has been, and continues to be, evolving and diversifying in varieties across the globe.
No single feature or set of features shapes particle placement in a categorical, deterministic way, and numerous influential factors have been identified over the years. These include the length, information status, and conceptual accessibility of the direct object, as well as the semantics of the verb and the presence of a postmodifying prepositional phrase (pick the rock up off the ground) (see Cappelle [Reference Cappelle, Bergs and Diewald2009] for review). But what do we know about regional variability in particle placement? The answer: surprisingly little. A few studies have hinted at possible regional differences within the United Kingdom (e.g., Elenbaas, Reference Elenbaas2007) and the United States (Grieve, Reference Grieve2016:70–71), but until recently evidence for differences in the influence of the linguistic constraints on particle placement has been thin. Haddican and Johnson (Reference Haddican and Johnson2012) investigated regional variation in the influence of the length and information status of the direct object within the United States and United Kingdom, using judgment surveys and Twitter data, and found no evidence of regional variation within either of the two countries in the overall rate of use of PV variants, or in the influence of internal constraints on the choice of variant; however, they did nonetheless find a consistent difference in the overall rate of variant use between the two countries (see also Cappelle, Reference Cappelle, Bergs and Diewald2009:177–178). Notably, no significant interactions of country and linguistic features were found, suggesting that while UK and US speakers may vary in their overall use of PV variants, their choices are governed by a shared set of contextual constraints to roughly the same degree. That is, they share the same variable grammar.
If we zoom out to a wider perspective on the global English-speaking diaspora, even less is understood about PV variation, whether in other native, or “Inner Circle” (Kachru, Reference Kachru1992) varieties such as Canadian or Australian English, or more established “Outer Circle” varieties such as Indian or Philippines English. To the extent that PVs have been investigated in this domain, researchers have focused mainly on overall frequencies of PVs across varieties and/or genres (e.g., Zipp & Bernaisch, Reference Zipp, Bernaisch, Hundt and Gut2012) but have said little about variability in the choice between the two PV variants. Still, PVs are notoriously challenging for L2 learners, especially for speakers whose first language lacks particle constructions (e.g., González, Reference González2010; Liao & Fukuya, Reference Liao and Fukuya2004; Siyanova & Schmitt, Reference Siyanova and Schmitt2007), but there is some evidence that proficient L2 users can achieve native-like performance with respect to the influence of certain features (e.g., Blais & Gonnerman, Reference Blais and Gonnerman2013; Gilquin, Reference Gilquin2014). In light of this, we believe PVs offer a potentially fruitful test case for examining variation across World Englishes and for studying the ways in which variable grammars evolve and diversify.
For example, Szmrecsanyi et al. (Reference Szmrecsanyi, Grafmiller, Heller and Röthlisberger2016) investigated particle placement in spoken and written corpus data from four national varieties of English. They found that the split variant is used significantly less in the two Outer Circle varieties (Singapore and Indian English) than in the Inner Circle varieties (British and Canadian English), but also that the effects of some internal constraints, such as the length of the direct object, are substantially weaker in the Outer Circle varieties. They argue that in contexts where neither variant is substantially more difficult to process than the other(s), other forces—whether social, semantic, lexical, or just plain random fluctuation—are more likely to affect changes to the variable grammar. Szmrecsanyi et al. (Reference Szmrecsanyi, Grafmiller, Heller and Röthlisberger2016:133) characterized the interplay among these forces and their statistical associations with different grammatical variants, which shapes the grammar(s) of new varieties of English as the process of “probabilistic indigenization.”
Following Szmrecsanyi et al. (Reference Szmrecsanyi, Grafmiller, Heller and Röthlisberger2016), we conceptualize probabilistic indigenization in variable grammars as follows: To the extent that the conditioning constraints on a variable in a new variety A, for example, the probability of item x in context y, can be shown to differ from those of the mother variety, we can say that the new pattern represents a novel, if gradient, development in the variation grammar of A. These patterns may not be stable in the earlier stages of a variety's development, but they may provide indications of changes in progress and imply the emergence of a unique variable grammar. This approach assumes a probabilistic, usage-based model of grammar that is committed to the notion that grammar is the “cognitive organization of one's experience with language” (Bybee, Reference Bybee2006:711). Probabilistic grammars are usage-based in that quantitative patterns derived from experience are associated not only with surface forms or lexical items (as in pure exemplar models), but also with abstract features or constraints. Many of these features may reflect inherent, possibly universal aspects of linguistic structure, such as the tendency to map animate referents to more prominent structures or positions (e.g., Branigan, Pickering, & Tanaka, Reference Branigan, Pickering and Tanaka2008). A desirable feature of probabilistic grammar models is that they can account for gradient, experience-driven variability within the context of general constraints on the range of possible variation. From this perspective, inter- and intrasystemic variation arises from the interplay between biases in language production and comprehension and acquired form-meaning associations, and this interplay leads to variability in the distribution of forms that speakers implicitly learn (e.g., Bresnan & Ford, Reference Bresnan and Ford2010; Bresnan & Hay, Reference Bresnan and Hay2008). Over time, the aggregation of quantitative differences in such distributions gives rise to distinct variable grammars.
In mapping out a landscape of PV grammars across World Englishes, we confront questions central to research in the corpus-based variationist and comparative sociolinguistics traditions (e.g., Bresnan & Hay, Reference Bresnan and Hay2008; Szmrecsanyi et al., Reference Szmrecsanyi, Grafmiller, Heller and Röthlisberger2016; Tagliamonte, Reference Tagliamonte, Chambers and Schilling2013). To what extent can the effects of internal factors (e.g., the length or definiteness of a PV direct object), vary across regional varieties in their strength, direction, or relative importance? Methodologically, how can we compare variable grammars across multiple varieties in an empirically sound way? How does the variability we do (or do not) observe inform the notion of a “common core” (Quirk, Greenbaum, Leech, & Svartvik, Reference Quirk, Greenbaum, Leech and Svartvik1985:16) of English grammar? What role might external factors play in explaining this (lack of) variability? These questions motivate our study.
DATA SOURCES, VARIABLE EXTRACTION, AND ANNOTATION
Data sources
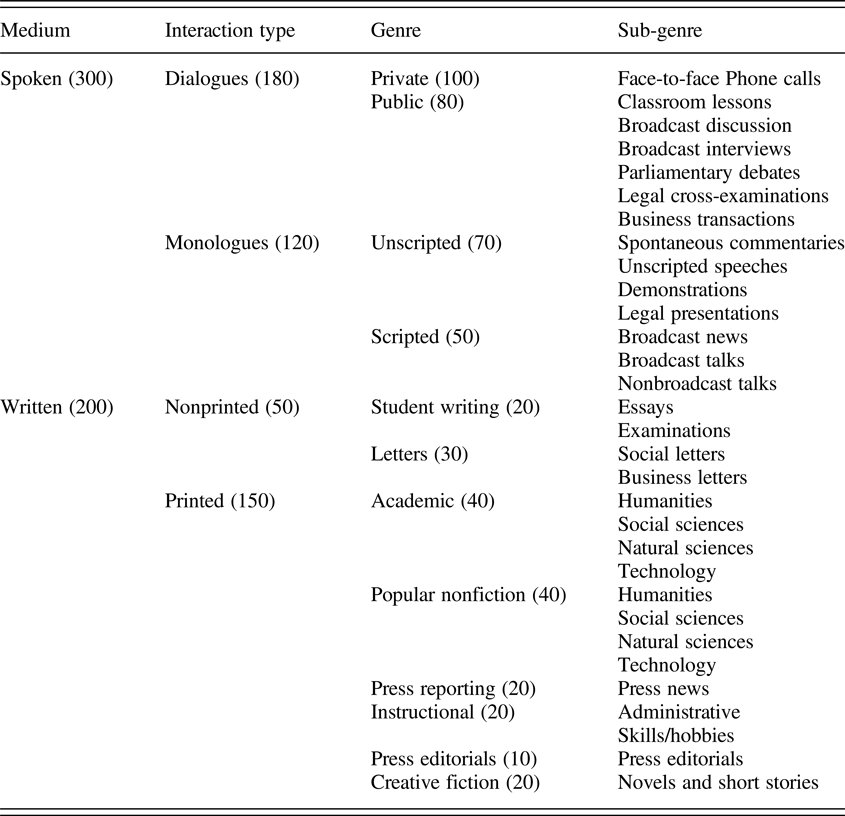
Data for the study were taken from nine components of the International Corpus of English (ICE; Greenbaum, Reference Greenbaum1996), and the corpus of Global Web-based English (GloWbE; Davies & Fuchs, Reference Davies and Fuchs2015): Great Britain (GB), Canada (CA), New Zealand (NZ), Ireland (IE), Jamaica (JA), Singapore (SG), Hong Kong (HK), India (IN), and Philippines (PH). ICE is an ongoing project, initiated in 1990, which was designed to create a set of parallel, balanced corpora representative of language usage across a wide range of (standard) national varieties. Each ICE component contains 500 texts of ~2000 words each, sampled from 12 spoken and written genres/registers, totaling ~1 million words. The structure of ICE components is shown in Table A1 in the Appendix.Footnote 3 Despite being published at different times over the past 20 years, all ICE components included here contain data from the early 1990s, with some also containing data collected as late as the early 2000s.
In addition, we included data from web-based language as represented in GloWbE with the aim of exploring the extent to which particle placement in an online medium might differ from language use in more “traditional” mediums. GloWbE contains data collected from 1.8 million English language websites—both blogs and general web pages—from 20 different countries (~1.8 billion words in all). To keep our dataset to a manageable size, we randomly sampled texts from each of the nine varieties, totaling ~500,000 words per variety. This resulted in a sample web-based corpus approximately half the size of our ICE corpus.
Extracting tokens and defining the variable context
To extract potential PV tokens, we used simple regular expression searches of the part-of-speech tagged versions of the two corpora, which looked for any verb followed within a 10-word window by 1 of the 10 particles in (3).
(3) around, away, back, down, in, off, on, out, over, up
These are the 10 most frequent particles according to Gries's (Reference Gries2003:203–210) list of transitive PVs from several dictionaries of English phrasal verbs (67).
Following the automatic extraction, we winnowed down the set of interchangeable PVs such as (4) by manually removing noninterchangeable tokens (5).
(4) You do have to be firm with lawyers to not send [endless] letters back and forth and run up the bill. (interchangeable)
(5) The lift was out of order, so he decided to run up the stairs (NOT interchangeable)
Such noninterchangeable tokens included intransitive (they called in at Port Ross) or passive PVs (a … mosaic brought back by crusaders), and any transitive PVs in which the direct object was a wh- form or a relative pronoun (What did Nasir bring back from the moon? The beliefs about god that this survey throws up). We also removed any token in which the particle/preposition occurred with a complement (get the ball in the net). In addition to excluding these clear-cut cases, we employed a number of tests to distinguish PVs from noninterchangeable “prepositional” verbs, as in (6).
(6) He called on the U.S. to end its economic embargo of Cuba.
These tests are discussed further in our annotation manual.Footnote 4
After inspection of the dataset, we further narrowed the envelope of variation according to two additional criteria: the length and category (pronominal versus nonpronominal) of the direct object noun phrase (NP) (see also Cappelle, Reference Cappelle, Bergs and Diewald2009). In our data, direct objects longer than six words categorically favor the continuous variant (n = 947 of 953, 99.4%), while the continuous order is almost never used when the direct object is a personal pronoun (n = 7 of 3245, 0.2%). Thus, tokens containing pronominal direct objects or direct objects longer than 6 words were excluded from the analysis to restrict the scope of the study to truly variable contexts (D'Arcy & Tagliamonte, Reference D'Arcy and Tagliamonte2015). The final dataset consisted of n = 11,340 PV tokens.
Annotation of conditioning factors
Each interchangeable PV token was annotated for numerous features hypothesized to influence the choice of particle placement.
Length of the direct object
Longer objects increasingly favoring the continuous variant. The general tendency for longer, or “heavier,” elements to be placed at the end of a phrasal unit in English is an example of the well-known principle of end weight (e.g., Wasow, Reference Wasow2002), and this effect has been widely documented in the PV literature. We use a measure of direct object length based on the number of words (median = 2, median absolute deviation = 1.5) rather than the number of letters, though the two measures are naturally very strongly correlated (r = .84).
Accessibility of the direct object
Accessibility-based theories of production preferences hold that elements that are more active in working memory are more likely to be uttered sooner (e.g., Bock & Warren, Reference Bock and Warren1985; Branigan et al., Reference Branigan, Pickering and Tanaka2008; MacDonald, Reference MacDonald2013). With this in mind, four features related to the conceptual accessibility of the direct object were annotated for: information status or givenness, definiteness, concreteness, and degree of topicality or “thematicity” (Osselton, Reference Osselton, Nixon and Honey1988). The first three factors have been consistently shown to influence particle placement, with less newsworthy, that is, discourse given, definite and/or concrete direct objects favoring the split variant (e.g., Gries, Reference Gries2003; Haddican & Johnson, Reference Haddican and Johnson2012). Givenness of the direct object was determined automatically via string matching for any instance of the direct object head lemma within the first 100 words of text preceding the token in which it occurred. If the head was found within this window, it was coded as “given,” otherwise it was coded as “new.” Definiteness was coded as a binary feature (“definite” versus “indefinite”) following guidelines developed by Garretson (Reference Garretson2004). Concreteness (“concrete” versus “nonconcrete”) was determined based on whether the referent of the direct object was visible and/or physically manipulable (Gries, Reference Gries2003). Thematicity was operationalized as the normalized text frequency (Hinrichs & Szmrecsanyi, Reference Hinrichs and Szmrecsanyi2007) of the direct object head noun. More discourse thematic direct objects are assumed to be more active in working memory, hence accessible, therefore we predict that the split variant should be more likely the greater the thematicity of the direct object.
Presence of a postmodifying directional PP
The presence of a postmodifying directional prepositional phrase (PP), as in (7), is also known to influence particle placement in present-day English (Fraser, Reference Fraser1976; Gries, Reference Gries2003; Rodríguez-Puente, Reference Rodríguez-Puente2016), thus we included a binary factor indicating the presence of a directional PP modifier following the verb phrase as in (7) (directional PP in italics).
(7) Well, as we have said, applying VAT on government contracts is taking money away from one government pocket and putting it in another. <ICE:PH-W2E-002>
According to Gries (Reference Gries2003), the split variant foregrounds the spatial meaning of the PV, thus the presence of additional material spelling out the direction or endpoint of spatial movement is to be expected with this variant.
Structural persistence/priming
The tendency for language users to reuse previously encountered grammatical structures is variously referred to as structural or syntactic “persistence” or “priming” (see Gries & Kootstra [Reference Gries and Kootstra2017] for a recent review). The basic idea is that recent use of a particular structure, for example, I picked the book up should make the use of that same structure, for example, I put the book down more likely than competing structures, I put down the book, in upcoming choice contexts. For this study, we focus only on priming from one choice context to the next. For each token, we coded for the PV variant that had been used most recently within a 100-word span preceding the token in question. If no interchangeable PV occurred within that span, the prime type was coded as “none”.
CV alternation
To investigate potential phonological/phonetic effects, we coded for the type (consonant [C] or vowel [V]) of the final segment of the verb form and the type of the initial segment of the particle: CC, VV, CV, VC (Browman, Reference Browman1986; Gries, Reference Gries and Medina2011).
(8) It was an hour long telephone interview where Essa laid down his law. (CC) <GloWbE:CA>
(9) His job was to throw people out for non-payment of rent. (VV) <ICE:IE:S1B-045>
(10) It took fire fighters an hour to put out the blaze. (CV) <ICE:PH:S2B-002>
(11) Letting me lie my head down for a few days in your Penthouse was great. (VC) <ICE:GB:W2F-012>
Gries (Reference Gries and Medina2011) found a horror aequi effect in children's PV usage, where the split variant was preferred when the two segments were of the same type (CC, VV), however, our data point mainly to a binary distinction between consonant clusters (CC) and the other patterns, therefore we coded this variable as “CC” versus “other.”
Rhythm
In natural usage, the tendency of English speakers to alternate stressed and unstressed syllables where permitted by the grammar has been shown to influence change and variation at multiple levels of grammatical structure (see Shih [Reference Shih, Gribanova and Shih2017] for review). To calculate the rhythmicity of a PV token, we counted the number of unstressed syllables at the boundary between the verb and particle in the continuous variant and the verb and direct object in the split variant. This resulted in a measure of “eurhythmy distance” (ED) for each variant, from which we calculated a measure of comparative rhythm by subtracting the split ED from the continuous ED.
(12) Split preference (Rhythm < 0)
a. handing out the stockings [ED = 1]
b. handing the stockings out [ED = 2]
(13) Continuous preference (Rhythm > 0)
a. throw away books [ED = 1]
b. throw books away [ED = 0]
(14) No preference (Rhythm = 0)
a. picking up gorgeous Samsons [ED = 1]
b. picking gorgeous Samsons up [ED = 1]
More positive measures indicate that the split variant is more rhythmic than the continuous variant, and more negative scores indicate that the continuous variant is more rhythmic than the split one. Scores of 0 reflect cases where neither is more rhythmically ideal than the other.
Semantic compositionality of the PV
To annotate for semantic compositionality, we used a binary coding that captured the difference between PV tokens whose meaning is entirely predictable from that of their parts, and those tokens whose meaning is not fully predictable. For annotation, we followed the heuristic of Lohse et al. (Reference Lohse, Hawkins and Wasow2004:244–246), who employed two entailment tests to determine semantic compositionality. If [X V (P) NP (P)] entails both [X V NP] (verb entailment) and [NP PredV P] (particle entailment)—where PredV represents a predication verb of the type be, become, come, go, stay—then the PV was coded as “compositional.” If either entailment test failed, the token was coded as “noncompositional.” Semantic annotation was conducted by the first author, after which a random sample of 200 tokens was coded independently by a trained research assistant and the ratings were compared. Agreement between coders was reasonably good given the task (90%, Cohen's κ = .75).
Information content of verb and particle
As an additional measure of verb-particle dependency, we calculated the informativity, or surprisal, of the verb and the particle as components of a PV, where surprisal is defined in the information-theoretic sense (Shannon, Reference Shannon1948) as the log inverse of the conditional probability of an item given a particular context. For a given verb-particle pair, we calculated the surprisal of the particle given the verb (Surprisal.P), and the surprisal of the verb given the particle (Surprisal.V). The formula in (15) illustrates how we calculate the surprisal of the particle up given the verb pick (Surprisal.P).
(15)
 $${\rm Surprisal}(up \vert pick) = -{\rm lo}{\rm g}_2P(up \vert pick) = -{\rm lo}{\rm g}_2\displaystyle{{Freq\lpar {pick \vert up} \rpar } \over {Freq\lpar {pick} \rpar }}\fleqno$$

Informally, the less predictable a word is in a given context, the more surprising or informative it is. We interpret the surprisal measures in much the same fashion as Lohse et al.’s (Reference Lohse, Hawkins and Wasow2004) entailment tests, that is, as measures of the relative syntactic/semantic (in)dependence of the verb and particle. From an information-theoretic perspective, we associate higher informativity (lower predictability) with greater independence, since more informative verbs/particles are those that occur more often in contexts without their respective PV component. PV types with especially low Surprisal.P scores are those for which, once we know the verb, we can predict the particle with a high degree of confidence. We hypothesize such PVs will strongly favor the continuous variant.
External predictors
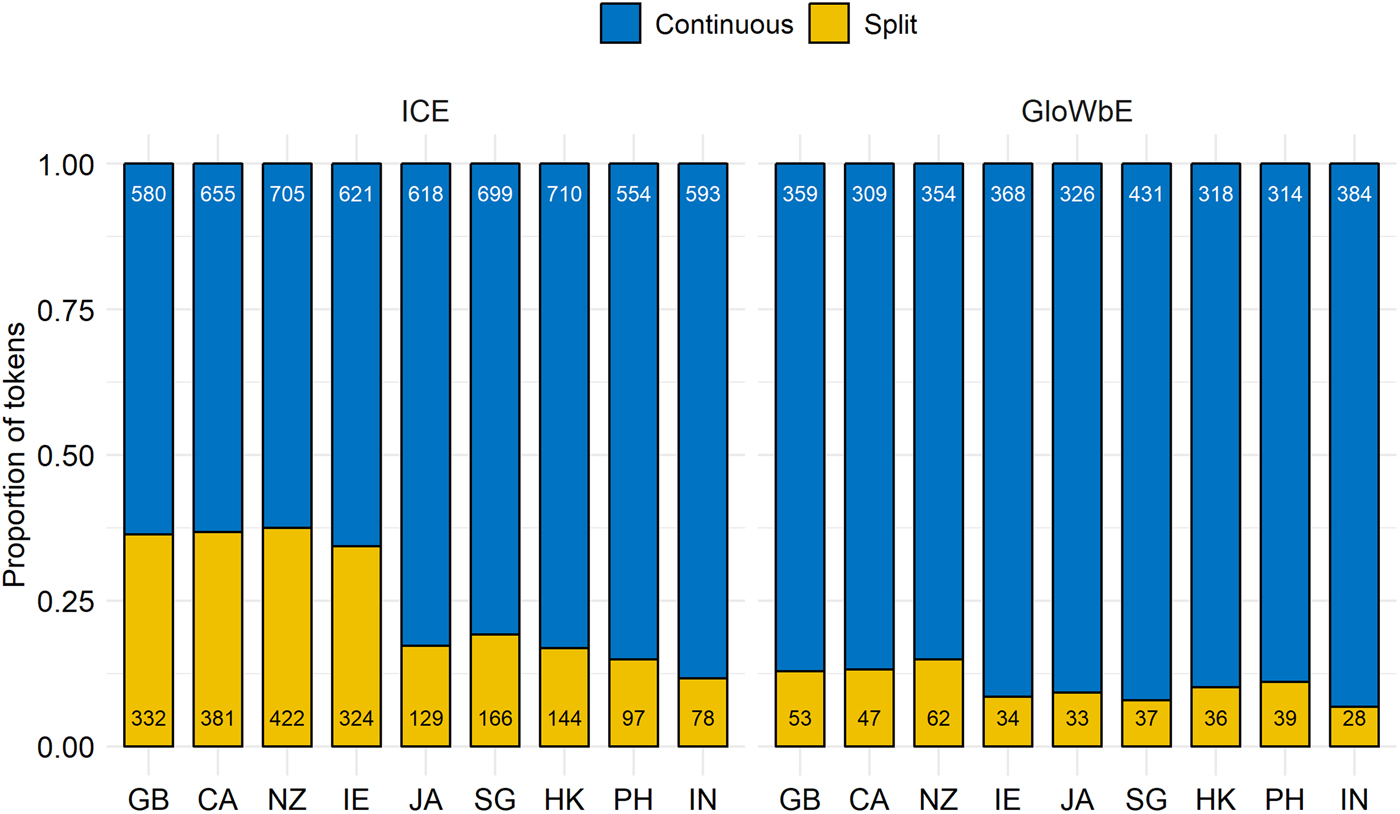
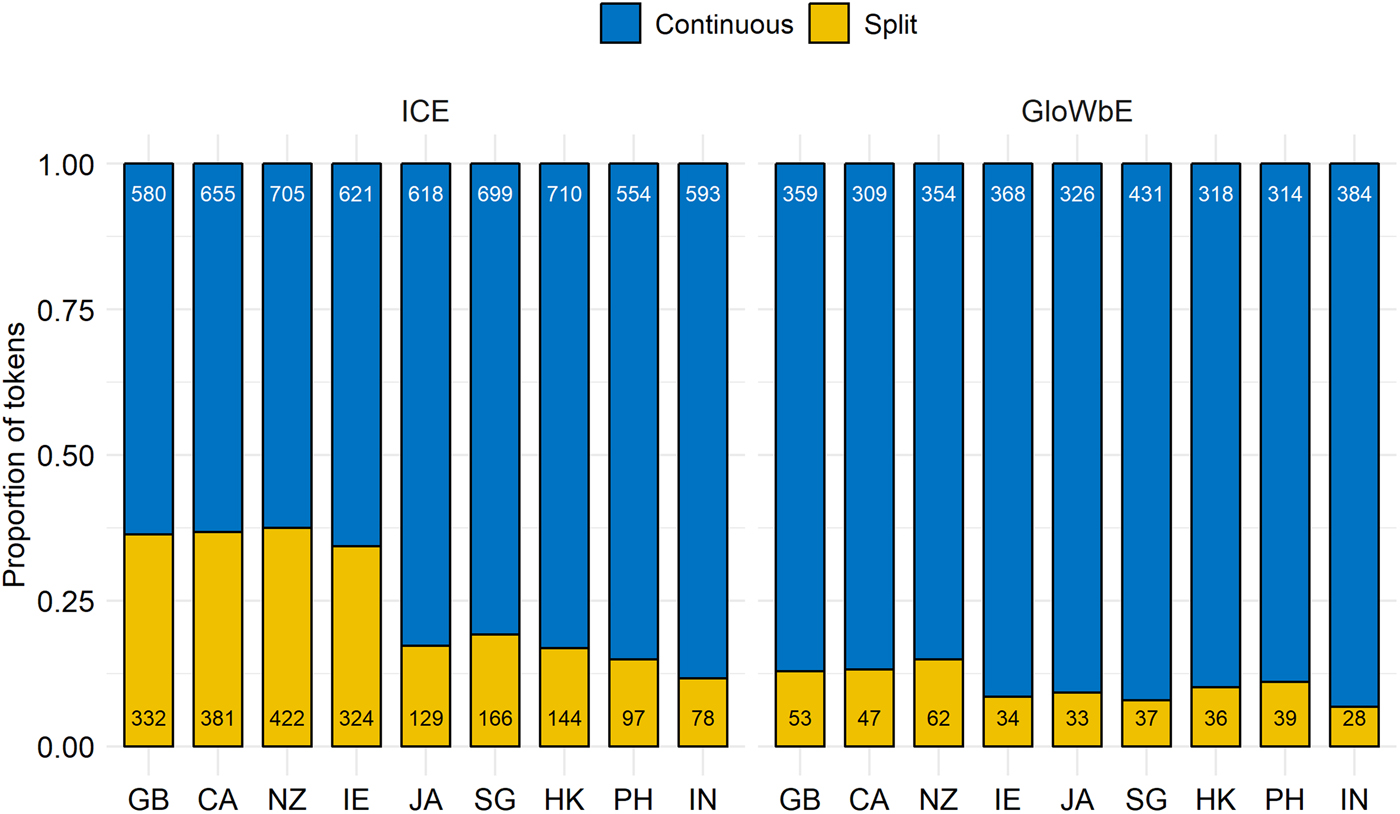
Due to the lack of sufficient sociolinguistic metadata for some of our corpora, we limit our external predictors mainly to variety and genre. Looking at the distribution of PV variants across varieties (Figure 1), we find the biggest difference lies in the ICE data in which the discontinuous variant is clearly more frequent in the four Inner Circle varieties (GB, CA, NZ, IE), than the remaining varieties. This contrast is not found in the GloWbE data, however.
Distribution of PV variants by variety and corpus. The length of bars reflects the proportion of variants and the values represent the number of tokens of a given variant.
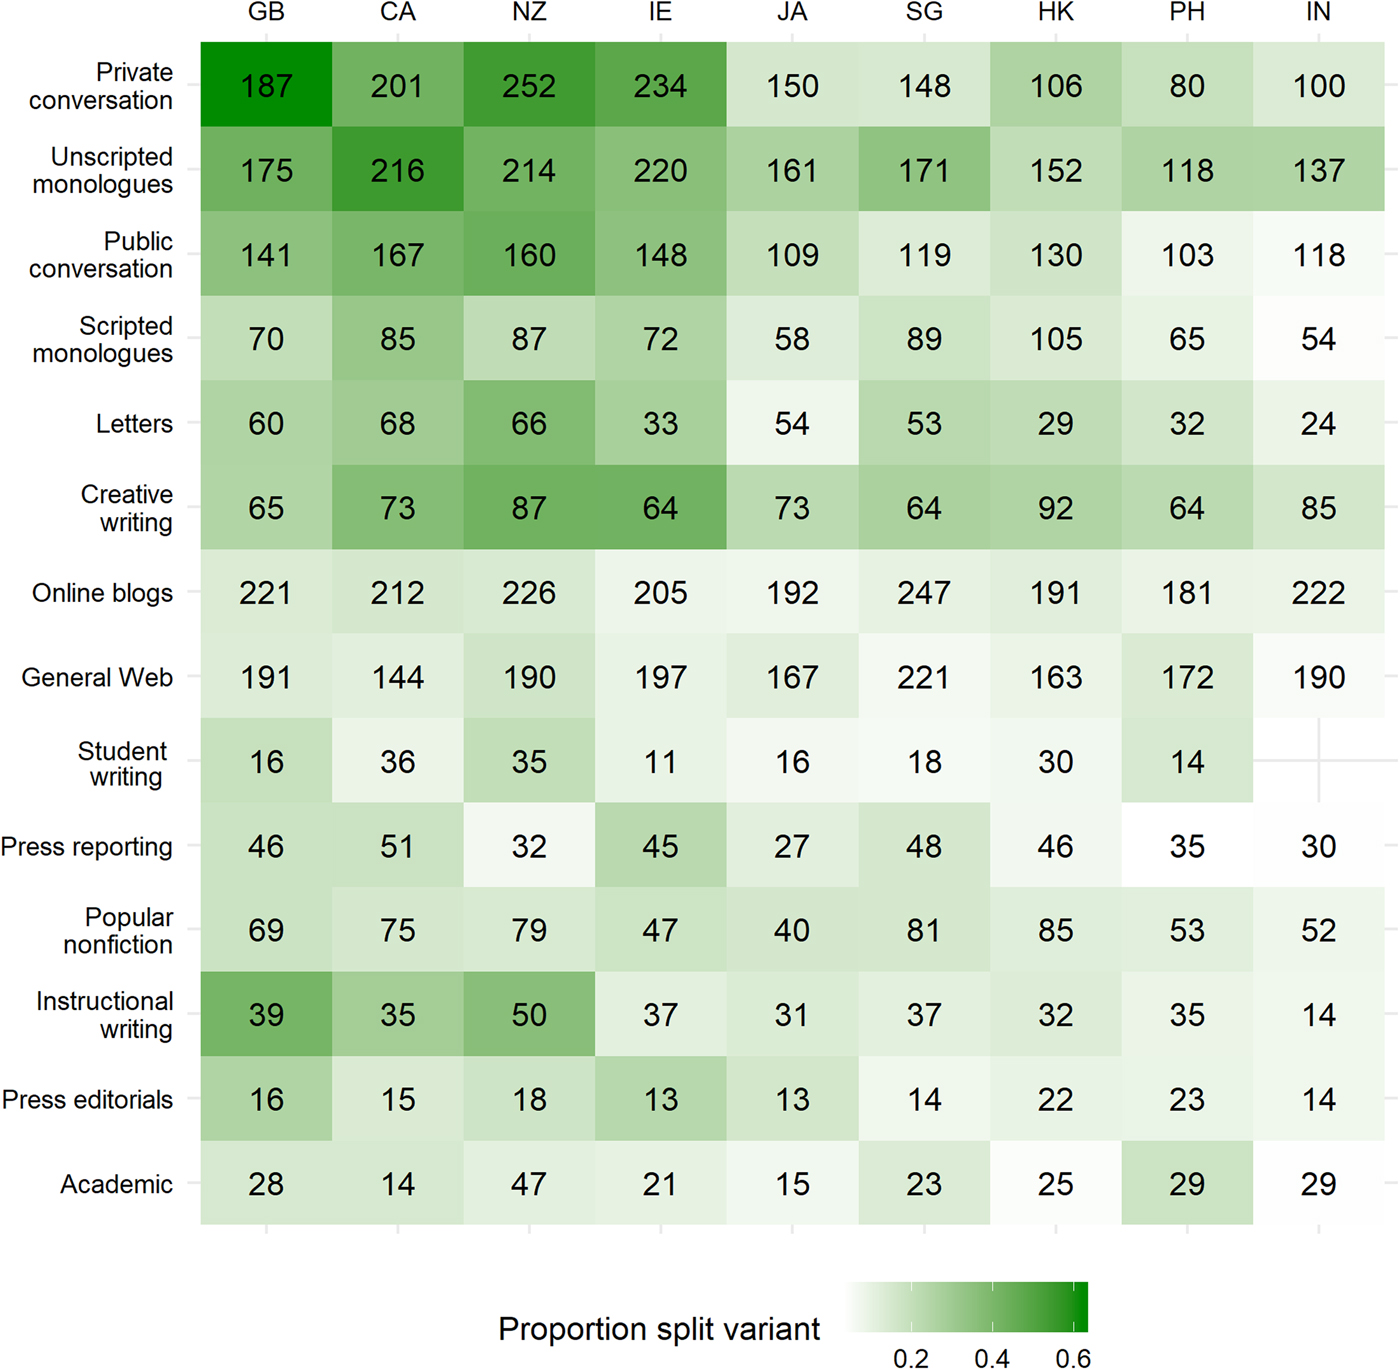
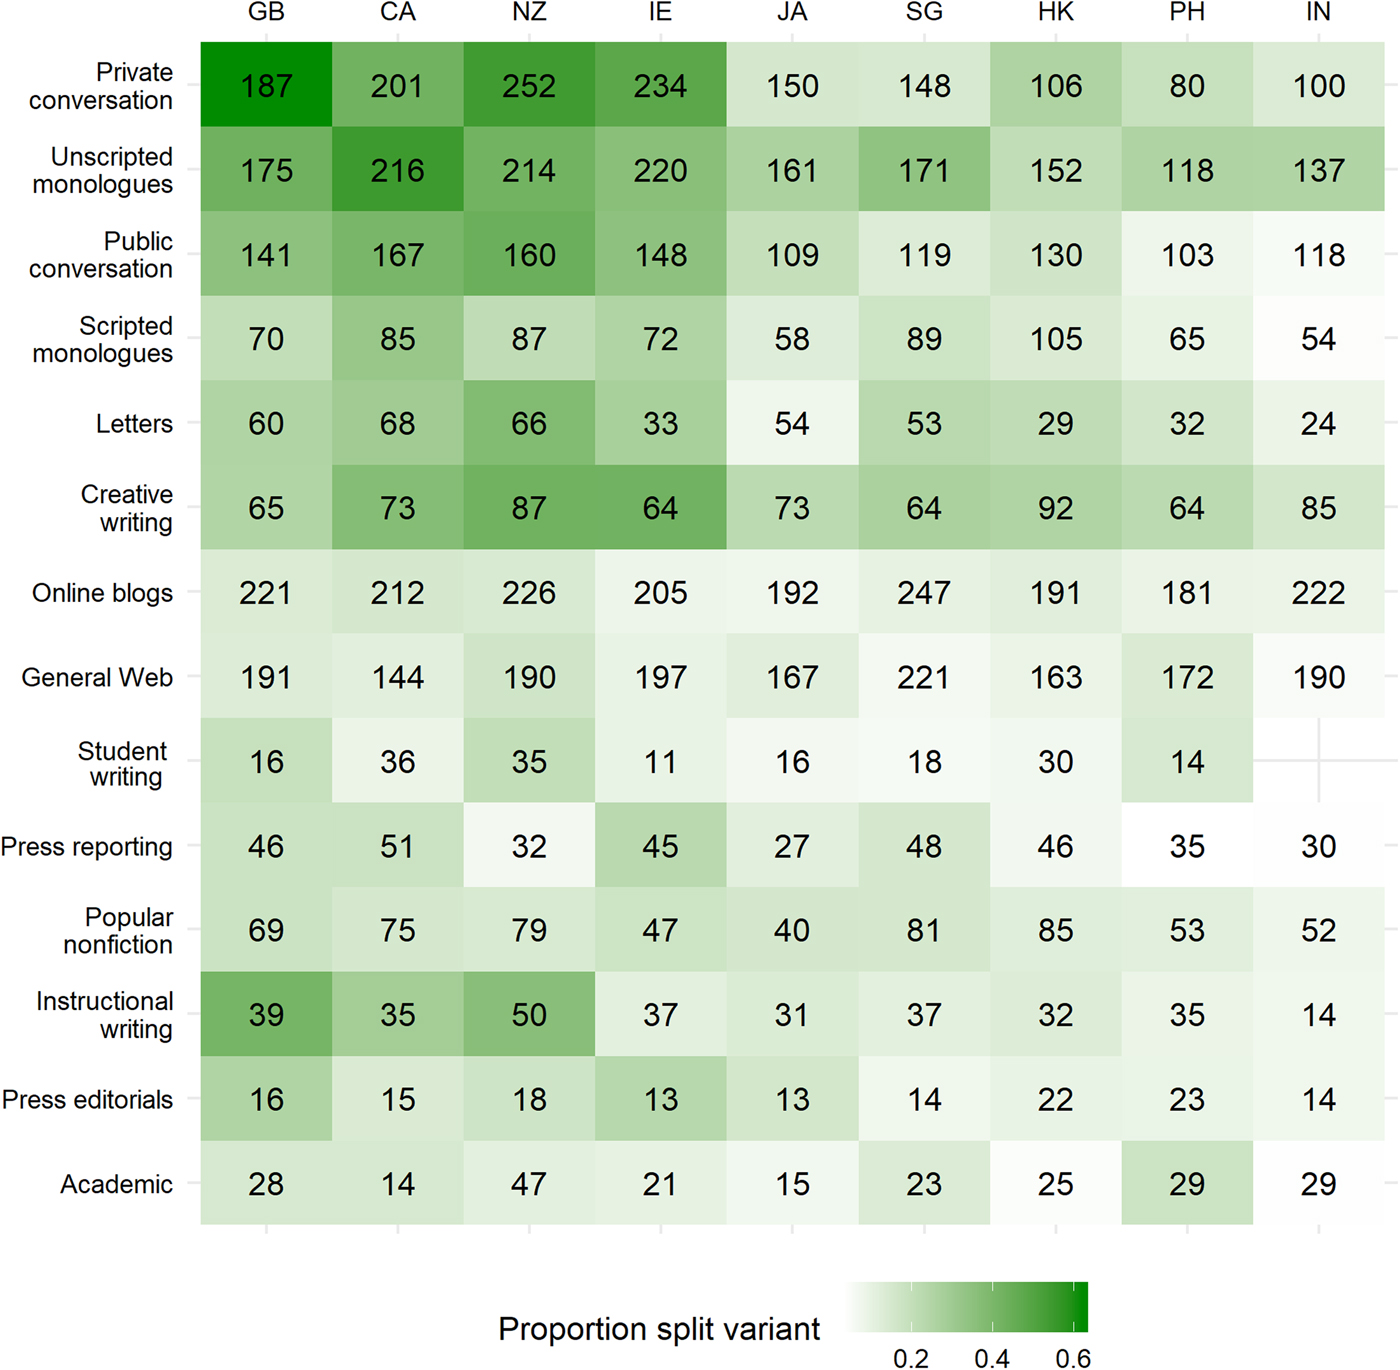
Turning to the distribution of PV variants across genres (Figure 2), the split variant is much more common in more informal/colloquial speech and writing (e.g., letters and creative fiction), than in other genres, and this tendency is more pronounced in the Inner Circle varieties. On the other hand, PV usage in GloWbE is on par with that of other written genres such as academic and newspaper writing, which heavily favor the continuous variant. Upon closer inspection, we find that many of the texts from GloWbE are in fact structurally and/or thematically similar to some of the nonfiction ICE texts. Many of these GloWbE texts are either news reports or nonfiction writing with an informational rather than interpersonal (Biber, Reference Biber1988) focus. Thus, it appears that formality and medium may have less of an effect on PV use than more finely tuned functional or thematic factors (see also our discussion constraint rankings in IN).
Heat map showing distribution of PV variants by genre in ICE and GloWbE (online blogs and general Web). Numbers represent the total number of tokens (split and continuous), and darker areas represent greater proportions of the split variant.
Lastly, we also coded a simplified five-level predictor of register that collapsed genres according to formality and modality: spoken informal texts (genres: private dialogues, unscripted monologues) versus spoken formal texts (public dialogues, scripted monologues) versus written informal texts (student writing, letters, press editorials, creative fiction) versus written formal texts (academic writing, press reportage, popular nonfiction, instructional writing) versus online texts (blogs, general websites).
QUANTITATIVE ANALYSIS
To explore the differences among our varieties’ PV grammars, we draw inspiration from the methodological framework of comparative sociolinguistics (Poplack & Tagliamonte, Reference Poplack and Tagliamonte2001; Tagliamonte, Reference Tagliamonte, Chambers and Schilling2013). The comparative approach is characterized by its use of three “lines of evidence” (Poplack & Tagliamonte, Reference Poplack and Tagliamonte2001:92) derived from the statistical modeling of a linguistic variable across two or more datasets: the ranking, relative strength, and statistical significance of conditioning constraints. Examining variable patterns from multiple quantitative angles in this way helps us to determine how much, and in what ways, certain varieties have diverged or may be diverging from one another as well as from their mother variety. In short, similarities and/or differences in these lines of evidence can “provide a microscopic view of the underlying grammatical system[s]” (Tagliamonte, Reference Tagliamonte, Chambers and Schilling2013:130), among different varieties of English.
Comparative analysis: Constraint ranking and probabilistic distances
For the comparative analysis, we utilize generalized linear mixed models (GLMMs), specifically binomial logistic mixed models (e.g., Bresnan, Cueni, Nikitina, & Harald, Reference Bresnan, Cueni, Nikitina, Harald, Boume, Kraemer and Zwarts2007).Footnote 5 We fit GLMMs of each variety dataset individually, which incorporated reasonable, though nonmaximal random structures. Fitting individual by-variety models is an essential component of comparative sociolinguistics as it offers us direct measures of effect size, direction, and statistical significance for individual predictors. A potential drawback is that we cannot directly assess whether a particular cross-varietal difference is statistically significant; however, considering that researchers may have few a priori hypotheses about which internal constraints should vary in which varieties, even comparative analyses using regression models with cross-varietal interaction terms (e.g., Szmrecsanyi, Grafmiller, Bresnan, Rosenbach, Tagliamonte, & Todd, Reference Szmrecsanyi, Grafmiller, Bresnan, Rosenbach, Tagliamonte and Todd2017) are still mainly exploratory in nature (see Paolillo, Reference Paolillo2013:114). We therefore believe that comparative analysis is better served by a variegated statistical methodology that deploys multiple techniques, including significance tests where possible, but is interpreted with a more conservative exploratory slant.
As mentioned, the comparative sociolinguistic method involves the evaluation of three lines of evidence derived from separate quantitative models fit to different datasets (Poplack & Tagliamonte, Reference Poplack and Tagliamonte2001; Tagliamonte, Reference Tagliamonte, Chambers and Schilling2013). A first line of evidence involves a simple comparison of constraints that are determined by a statistical model to be significantly correlated—under multivariate control—with a linguistic variable: Do the varieties in question share the same set of significant constraints (statistical significance)? A second line of evidence involves ranking the different (sets of) constraints, or factor groups, according to the strength of their influence on the variable: Do the constraints have the same relative impact or explanatory power on the variable in each variety (relative strength/magnitude)? The third line of evidence consists of comparing the magnitude and direction of the significant constraints across datasets: Are the directions of the constraints the same; are the orders of the levels within a constraint the same (constraint hierarchy)? Are the effects of some constraints stronger in one variety/dataset than others?
Evaluation of these lines of evidence typically proceeds by visually inspecting the statistical results across each of the datasets (see, e.g., Tagliamonte, Reference Tagliamonte, Chambers and Schilling2013). We extend this approach by developing a method for quantifying the variability within these lines of evidence and visualizing the degree of (dis)similarity among varieties. In the first step, we fit mixed effects regression models to each of our variety datasets separately, which are checked against standard diagnostics. For comparing relative constraint importance in each variety, we use a permutation-based importance measure to determine the change in the small sample, corrected Akaike information criterion model (AICc), an information theoretic measure of how much the inclusion/exclusion of a given constraint affects our ability to model variation in particle placement. To assess possible differences in constraint hierarchies across varieties, we examine the coefficient estimates for our predictors returned by the models. Coefficients provide information about possible differences in the direction of a given predictor's effect and/or differences in the relative strength across multiple levels of a predictor. In the second step, we use the results from our models as input data for analysis of linguistic distances between varieties. As in traditional comparative sociolinguistic studies, our approach incorporates information from both significant and nonsignificant constraints; however, it moves beyond simple visual inspection toward more quantitatively rigorous methods of detecting relationships among datasets that may be difficult to perceive otherwise. Further details of the methods are provided in the supplementary materials.
Model fitting
The model structure for all by-variety regression models is shown in (16).
(16) Response ~ Register + DirObjLength + Semantics + DirObjConcreteness +
DirObjGivenness + DirObjDefiniteness + DirObjThematicity +
DirectionalPP + CV.binary + Surprisal.P + Surprisal.V + Rhythm +
PrimeType + (1|Verb) + (1|Particle) + (1|VerbPart) + (1|Genre)
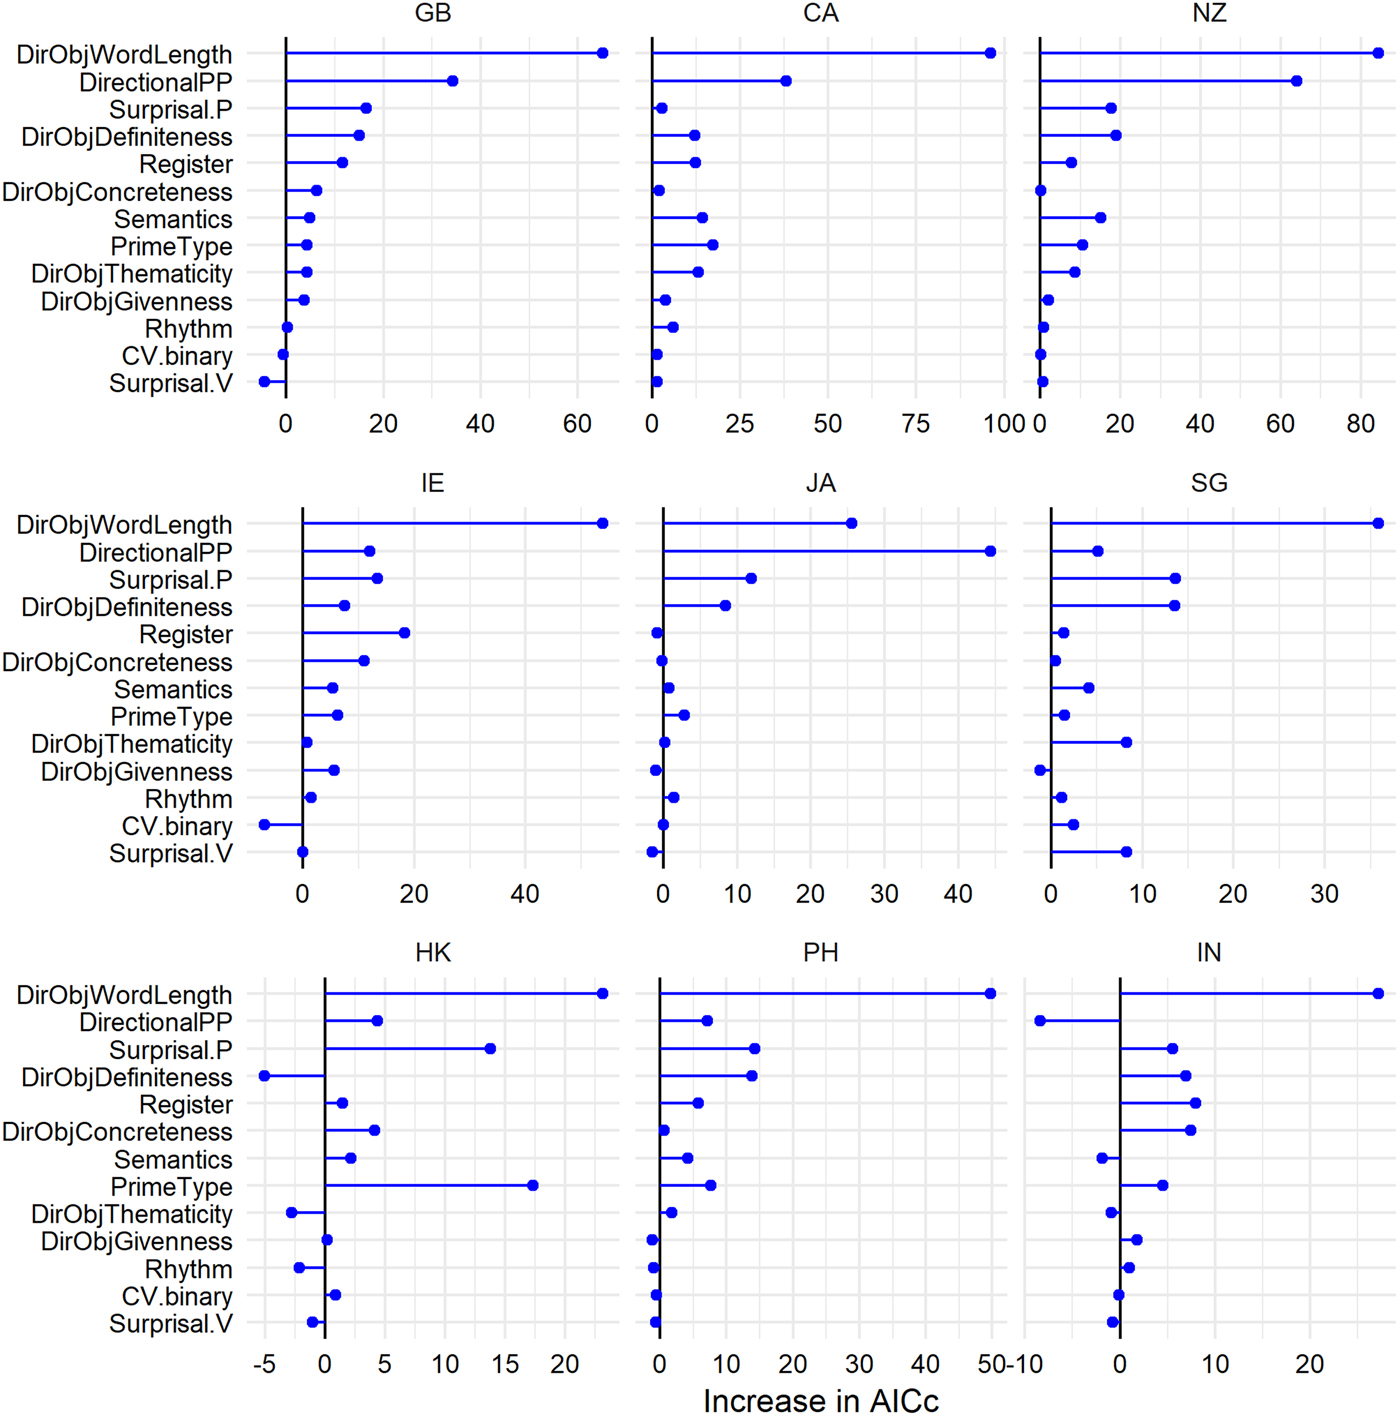
All models fit the datasets quite well, with very little evidence of data multicollinearity or predictor intercorrelation (see supplementary materials for details). Figure 3 shows the individual constraint rankings obtained from each model. The length of the lines reflects the relative importance of a given predictor—the longer the line, the more important the predictor in that variety. From this figure, it is immediately clear that the PV variation grammars differ substantially across the varieties in terms of the relative importance of the various constraints affecting particle placement.
AICc-based importance rankings by predictor (fixed effects only) for variety-specific GLMMs. For comparison, predictors in all varieties are sorted according to their ranking in the GB model. Scores reflect the increase in AICc (decrease in model fit) compared to the original model for a model in which the values of a given predictor are randomly reshuffled.
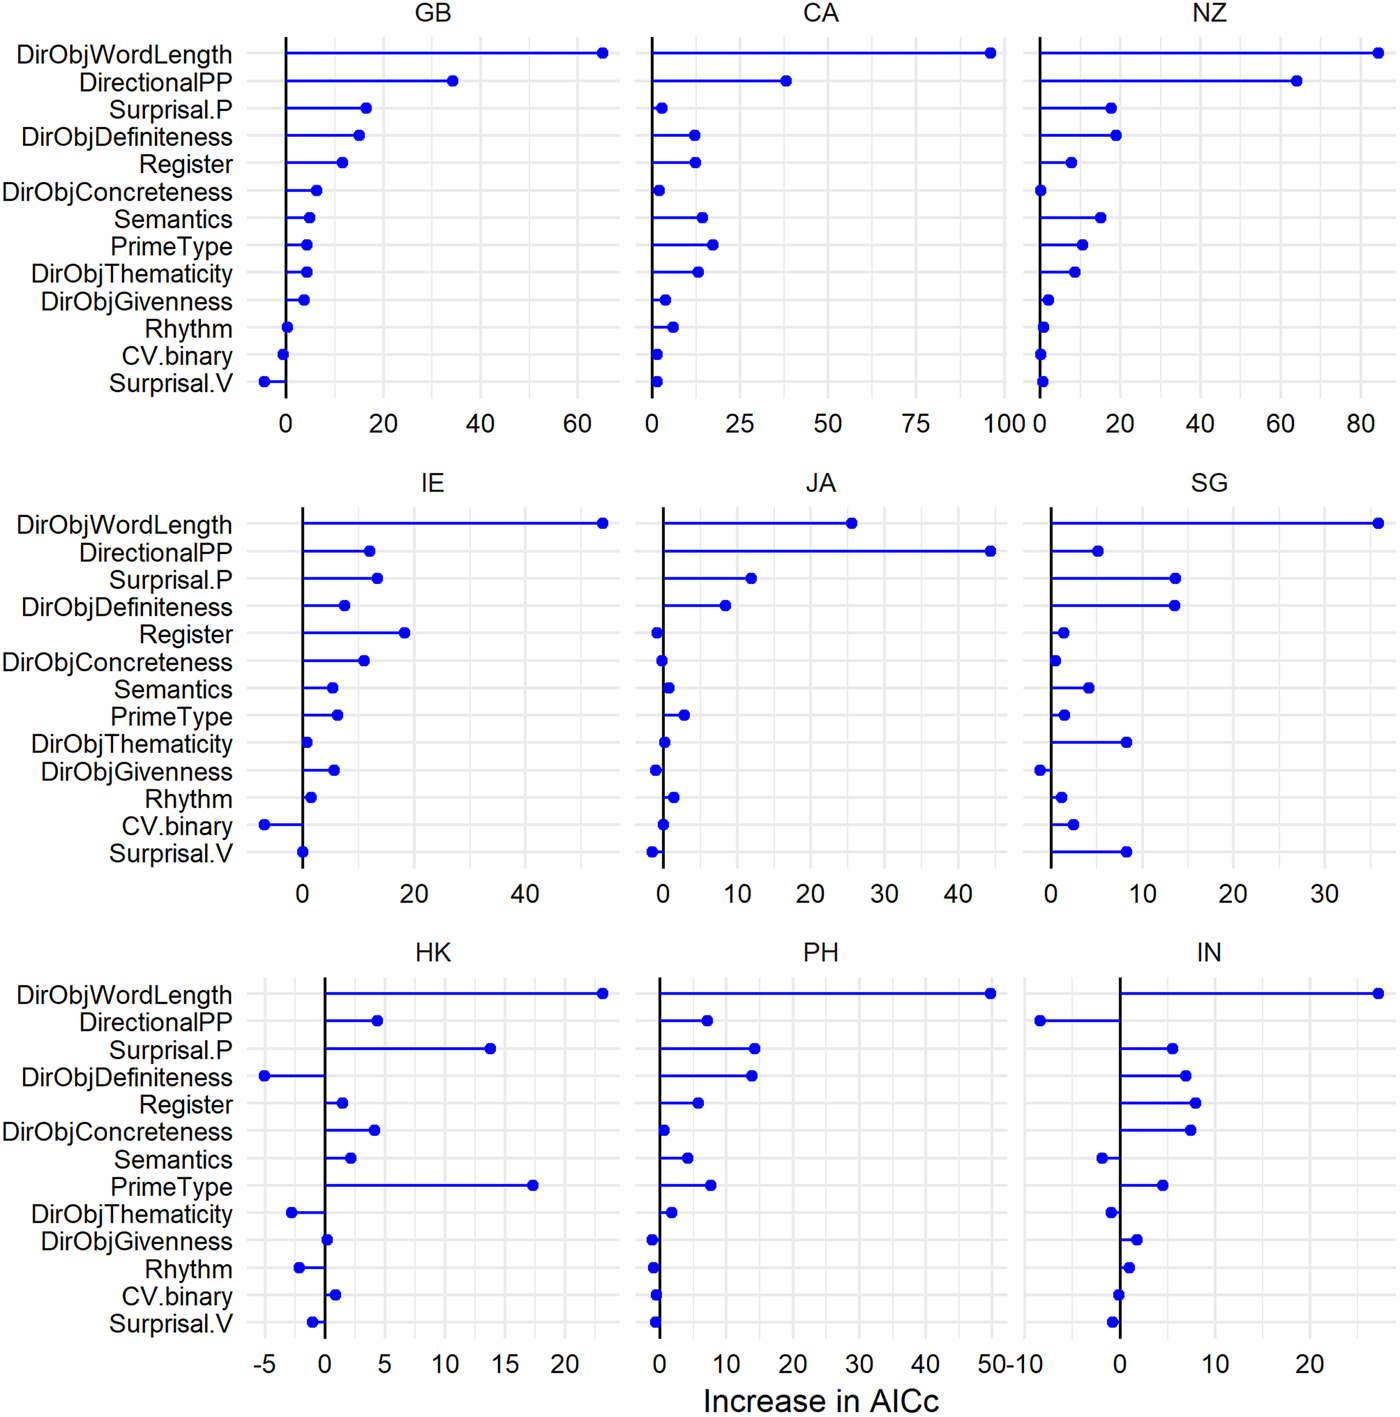
Several constraints are stable in their relative ranking. In particular, DirObjLength ranks quite high in all varieties, while information structural factors (DirObjGivenness and DirObjThematicity) and phonological factors (CV.binary and rhythm) rank consistently among the least important constraints in our datasets. The consistently strong influence of DirObjLength is compatible with theories of variation in production that attribute end weight effects to users’ drive to reduce online processing effort (e.g., Hawkins, Reference Hawkins2004; MacDonald, Reference MacDonald2013). Other factors differ considerably across the varieties. For instance, direct object concreteness ranks quite high in Indian while priming plays a substantial role in the Hong Kong English dataset, but both predictors rank rather low in the other varieties. At the same time, the presence of a directional modifier ranks high in GB, CA, NZ, and especially in Jamaican English, but it is relatively unimportant in the other varieties. More generally, we observe a clear similarity among the native varieties in the overall trajectory of their predictor rankings.
From a variety-centric perspective, there are some suggestive patterns within these rankings worth pointing out. For one, the effect of Register.sum plays a relatively less important role in Outer Circle varieties than in the Inner Circle varieties, where it is always one of the very highest-ranking predictors. Notable exceptions here are Irish and Indian English, where Register.sum also shows relatively high ranking compared to other predictors. Upon closer inspection, it appears this effect in IN is due to the high preponderance of split tokens in the unscripted spoken monologue subset of the data (25.2% compared to an average of 7.8% split tokens across the remaining genres). Notably, many of the texts in this genre come from yoga or exercise instructions, which frequently involve directions for positioning body parts and thus involve compositional PVs with concrete, definite direct objects, for example, turn the left foot out, take your shoulder up, lift your hands up. It turns out that almost one third (31.8%) of the split PV tokens in our entire IN dataset come from this one genre. What effect this may have on our models is hard to say at this point, though we note that the same model also reports an unusually high ranking for DirObjConcreteness.
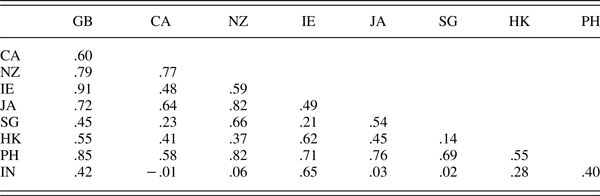
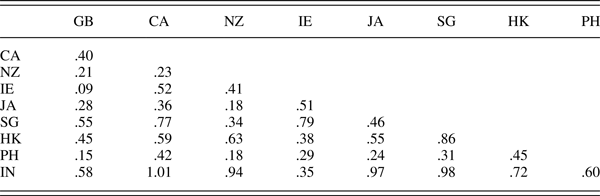
We can further measure correlations between varieties’ constraint rankings quantitatively (Table 1) using a rank correlation measure, specifically Spearman's ρ, in which scores range from −1 (perfect negative correlation) to 1 (perfect positive correlation, i.e., identical rankings). The GB, CA, NZ, and to a lesser extent IE datasets tend to correlate more strongly with one another, although we also find strong correlations of GB and NZ with the Outer Circle variety PH. To the extent that shared rankings imply a shared grammar, we interpret this as evidence for a core PV variation grammar shared among Inner Circle Englishes. The remaining five varieties’ rankings waver considerably in their correlations, both with the native varieties as well as among themselves. Of these, Indian English especially stands out, as it exhibits very weak correlations with most of the other varieties, with the exception of GB and IE. This is not necessarily true of the others, which exhibit varying degrees of similarity with different native and non-native varieties.
Spearman rank correlations of the variable importance rankings among the nine varieties

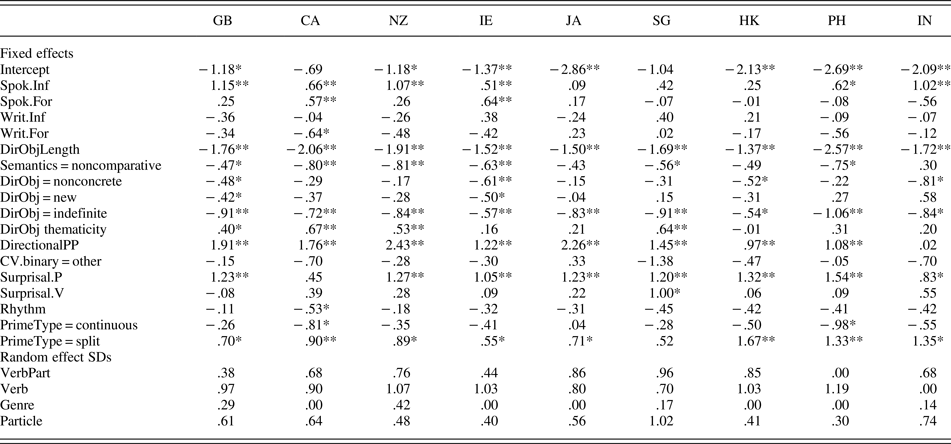
Table 2 shows the effects of each predictor level on the log odds scale as estimated by the individual GLMMs. Positive values indicate an increase, and negative values indicate a decrease in the probability of the split variant. A number of predictors such as DirObjLength, Surprisal.P, and DirectionalPP, behave consistently across all our varieties, as indicated by the fact that the sign of their coefficients does not change. Other predictors are less consistent, though the differences in effect direction that we find mostly involve coefficients close to 0 and would probably fail to reach significance in many cases.
Estimates for fixed effects coefficients and random effects standard deviations in per-variety GLMMs

Note: *p values at < .05; **p values at Bonferroni corrected <.005.
In terms of our random effects, we find a considerable degree of lexical bias in our datasets, as we expected. The various verbs and verb-particle combinations are not distributed evenly across the split and continuous variants, and we again refer interested readers to our supplementary materials for complete details of the random effects.
Variation grammars in multidimensional space
Having established that our models are satisfactory, we move on to the multivariate comparative analysis. For various reasons, we ignore the role of statistical significance in assessing similarities among varieties (see also Tagliamonte, Reference Tagliamonte, Chambers and Schilling2013:152n5). Our aim rather is to provide a “bird's eye view” of probabilistic indigenization in particle placement. To do this we use neighbor-net diagrams (Bryant & Moulton, Reference Bryant and Moulton2004) to explore latent cross-varietal patterns in the PV variation grammars based on the predictor rankings and effect sizes.
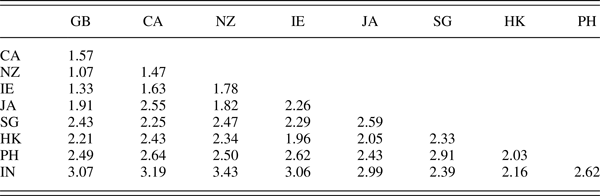
The first step in this process involves calculation of pairwise distances between the varieties, similar to matrices of distances between cities found on geographical maps. Using the tables of predictor rankings and coefficient estimates, we calculate two sets of pairwise distances between varieties based on their constraint rankings and effect sizes. Tables 3 and 4 display the matrices: lower scores reflect greater similarity, and 0 indicates identical variable grammars. The correlation between these two distance matrices is moderate (Mantel test: r = .58, p < .01), suggesting that the two lines of evidence assessed here (constraint rankings and effect size hierarchies) are converging toward the same underlying pattern, though still independent of one another.
Dissimilarity matrix derived from pairwise Spearman correlations of predictor rankings in per-variety GLMMs

Euclidean distances between varieties based on fixed effects coefficient estimates in per-variety GLMMs

In the next step, we use the matrices to generate neighbor-net diagrams. Originally developed in bioinformatics to represent uncertainty in phylogenies and reticulate effects such as genetic recombination, neighbor-nets are increasingly popular in linguistics (see, e.g., Wälchli, Reference Wälchli, Szmrecsanyi and Wälchli2014) and are related to well-known hierarchical agglomerative cluster analysis methods (Aldenderfer & Blashfield, Reference Aldenderfer and Blashfield1984). But unlike classical cluster analysis, neighbor-net diagrams can depict conflicting signals in the underlying distance matrices. This means in practice that when the data (or a segment of the data) can be adequately represented as a hierarchical tree, the neighbor-net diagram (or the relevant segment in the diagram) will be tree-shaped; when the distances provide a conflicting signal, reticulations (which indicate the coexistence of several possible tree structures) will be drawn. The resulting boxy shapes are in biology often interpreted as being indicative of horizontal gene transfer and in linguistics as suggesting language contact. We skip further technicalities and refer the reader to the introduction in Szmrecsanyi and Wolk (Reference Szmrecsanyi and Wolk2011:574–577). Suffice it to say that we present neighbor-net diagrams without insisting on a strictly phylogenetic interpretation. Instead, we use the method essentially as an advanced visualization technique to highlight general trends in complex datasets and to summarize the similarities between the varieties under study.
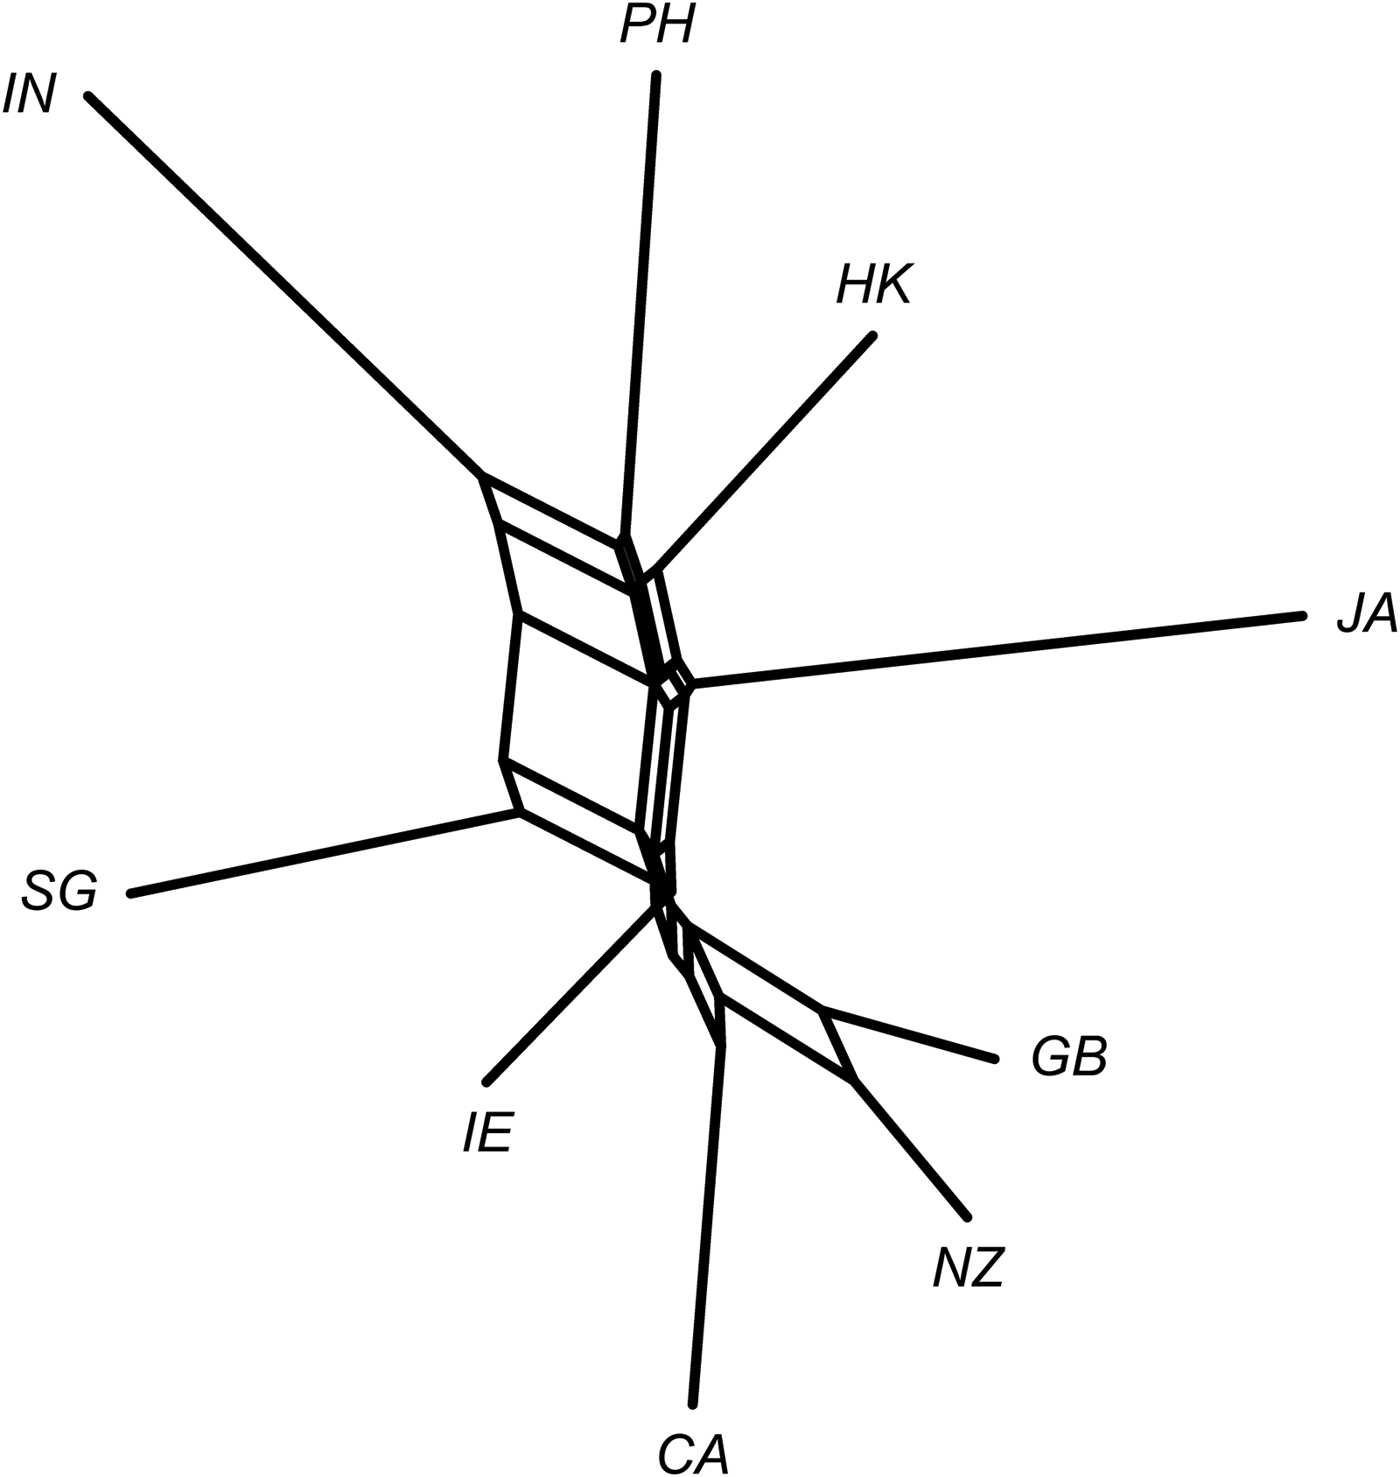
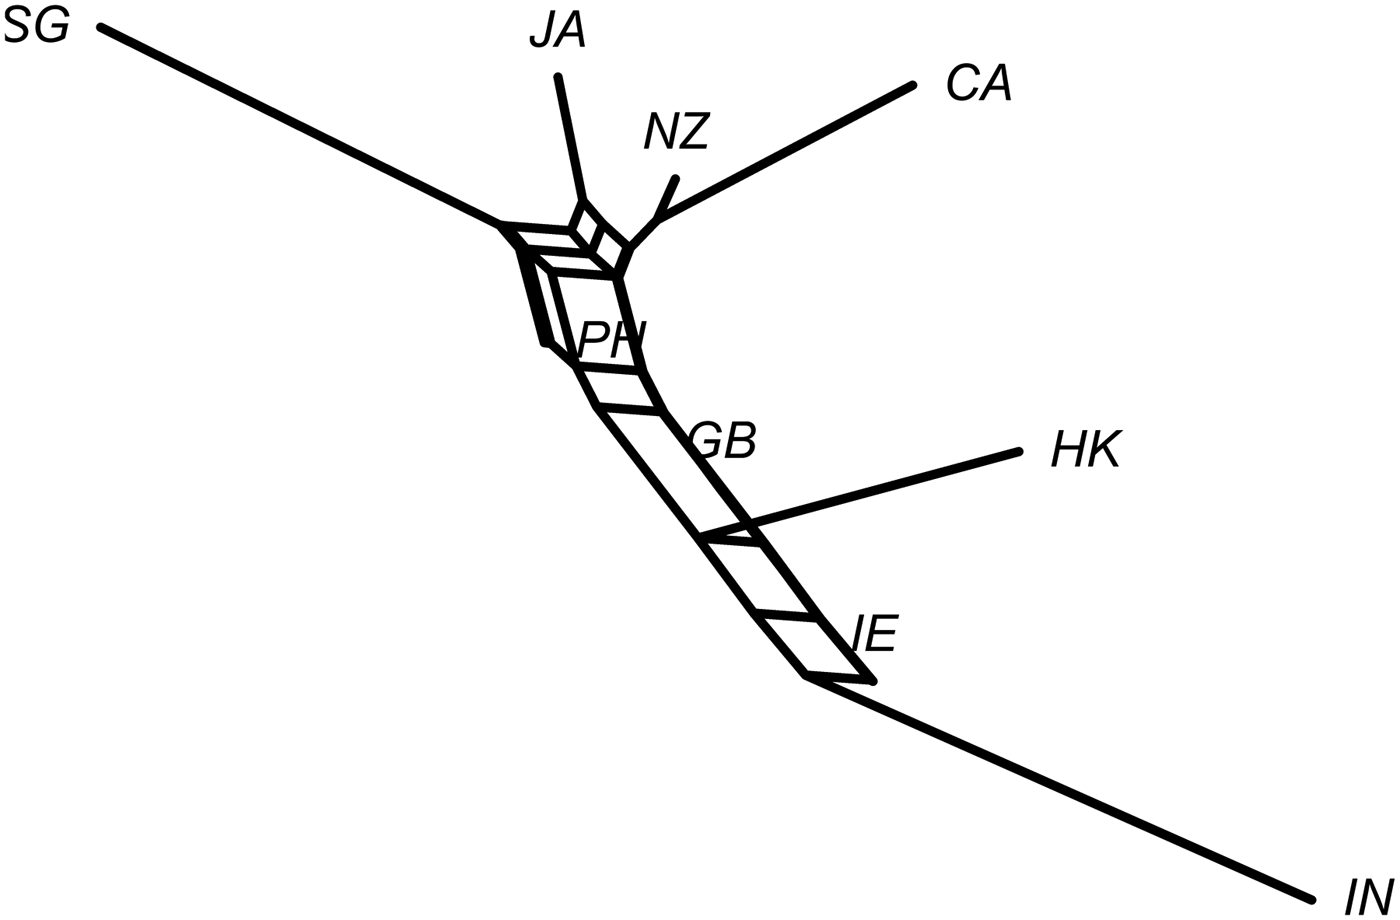
Figure 4 depicts a neighbor-netnetwork generated from the effect size-based distance matrix (Table 4). In neighbor-netdiagrams, each line represents a way of splitting the total set of varieties into exactly two groups. The longer a given line or set of lines, the greater the difference between the groups. For example, the comparatively large, almost vertical set of lines directly above the point where IE English joins the network divides the varieties into the following two groups: one group that consists of PH, JA, IN, HK, and SG (all Outer Circle varieties); and another cluster consisting of the other varieties in the bottom of the diagram (all the Inner Circle varieties in the sample). This split is fairly straightforward and represents, in fact, the most important groupings in the diagram. When divisions cannot be represented as strictly hierarchical, the algorithm draws reticulations that result in boxy shapes. Against this backdrop, the diagram indicates that variety relationships within the two big clusters are not strictly hierarchical. We conclude that the two clusters in Figure 1 can be interpreted primarily in terms of variety type (Inner versus Outer Circle). The length of the lines additionally suggests that the Outer Circle cluster is internally less homogeneous than the Inner Circle cluster.
Visualizing variety relationships using a neighbor-net diagram based on coefficient estimate distances. Internode distances (branch lengths) are proportional to linguistic distances.

The neighbor-net in Figure 5 visually summarizes the distance matrix based on variable importance ranking (Table 3). Compared to the neighbor-net in Figure 4, the diagram in Figure 5 has somewhat fewer reticulations, which is another way of saying that the underlying distance matrix can be split up in a more hierarchical, tree-like fashion. The main split in the dataset distinguishes between two clusters: a five-member group in the upper half of the diagram joining PH, SG, JA, NZ, and CA (with NZ and CA, the two L1 varieties in this cluster, being rather close); and a four-member cluster at the bottom of the diagram consisting of GB, HK, IE, and IN (with IN, as in Figure 1, being fairly distant from the other varieties). These two clusters are fairly mixed bags: neither variety type nor geography seem to be decisive. But by way of an ad hoc explanation, we note that the upper cluster has a rather North American bent, while the bottom cluster seems to favor varieties located in the British Isles or with an orientation toward British English (such as Indian English).
Visualizing variety relationships using a neighbor-net diagram based on constraint ranking distances. Internode distances (branch lengths) are proportional to linguistic distances.

DISCUSSION
Our goals in this study were twofold. One was to investigate particle placement across several World English varieties—do the same constraints influence the choice between PV variants for speakers of these varieties, and if not, how and where do the underlying variable grammars differ? We view these questions about the global scope of particle placement primarily in terms of its degree of probabilistic indigenization, which we characterize as the process whereby numerous social, cognitive, and/or linguistic forces shape the development of region-specific quantitative patterns in different varieties’ PV grammars. Our second goal was to expand the analytical tool kit for comparative sociolinguistics by applying distance metrics to the outputs of predictive models used in variationist analysis. By taking advantage of complementary methods from variationist and corpus linguistic traditions, we were able to show that there is in fact a high degree of stability among Inner Circle varieties in terms of the strength, direction, and ranking of the linguistic constraints on particle placement, while the patterns among different constraints were more variable among Outer Circle varieties. Moreover, our neighbor-net analysis suggests that the direction (and possibly the pace) of probabilistic indigenization in particle placement is far from uniform. How might we make sense of these patterns?
As with a number of recent studies of syntactic alternations across English varieties (e.g., Deshors & Gries, Reference Deshors and Gries2016; Heller, Szmrecsanyi & Grafmiller, Reference Heller, Szmrecsanyi and Grafmiller2017; Röthlisberger, Grafmiller, & Szmrecsanyi, Reference Röthlisberger, Grafmiller and Szmrecsanyi2017), the present study is couched within a theoretical framework that assumes an experience-based, probabilistic model of language. Our choice of predictors was motivated not only by what had been found in prior work on particle placement, but also by psycholinguistic theories of language production (e.g., Bock & Warren, Reference Bock and Warren1985; Hawkins, Reference Hawkins2004; MacDonald, Reference MacDonald2013), giving us a reasonable starting point for analyzing particle placement in the lesser studied Outer Circle varieties. Our results are largely consistent with functional accounts of language production, in which word order variation is thought to be governed by language users’ implicit drive to minimize processing load during online production planning. For example, the effect of DirObjLength, that is, end weight—often considered a classic manifestation of such processing constraints in human language (see, e.g., Futrell, Mahowald, & Gibson, Reference Futrell, Mahowald and Gibson2015)—is one of the strongest and highest-ranking predictors in every variety, and it exerts exactly the influence we expected: the longer the direct object, the less likely the split variant. Similarly motivated constraints such as Surprisal.P also exhibit considerable stability across our datasets, while others related to information status (DirObjGivenness) and discourse topicality (DirObjThematicity) appear to be reliably unimportant—a rather unexpected finding given previous research (e.g., Dehé, Reference Dehé2002; Haddican & Johnson, Reference Haddican and Johnson2012). Notably, the relative ranking of all constraints is most varied among Outer Circle varieties, and most consistent among Inner Circle varieties. To the extent that certain constraints exhibit consistently strong or weak effects across varieties, we believe these effects form part of a common core PV grammar that is likely to be found in all varieties of English.
These findings raise a number of thorny questions, to which we suggest answers here. Perhaps the most obvious question involves the contrast between Inner and Outer Circle varieties in our analyses. Why are native varieties so similar to each other, while the Outer Circle varieties are so dissimilar, both to the native varieties and to one another? Conventional wisdom in World Englishes research maintains that varieties at more advanced stages of nativization tend to be more differentiated from modern British English (e.g., Mukherjee & Gries, Reference Mukherjee and Gries2009); however, recent research on cross-varietal syntactic alternations suggests a more complex picture (e.g., Deshors & Gries, Reference Deshors and Gries2016; Heller et al., Reference Heller, Szmrecsanyi and Grafmiller2017; Röthlisberger et al., Reference Röthlisberger, Grafmiller and Szmrecsanyi2017). For example, the dynamic model (Schneider, Reference Schneider2007) places postcolonial varieties along five phases (5 being the final phase “differentiation”) according to characteristic correlations between the emergence of localized linguistic patterns and the changing sociocultural dynamics of the region. Sociolinguistically, the phases form a cline reflecting, among other things, the prevalence of bilingualism within the population, the degree of English integration into the local linguistic repertoire, the establishment of local norms or standards, and the extent of intraregional variation. Linguistically, the phases are manifested in an increasing deployment of region-specific vocabulary, collocations, and especially, novel morphosyntactic frames (Schneider, Reference Schneider2007:78–85). For example, Schneider and Zipp (Reference Schneider and Zipp2013) reported on a number of innovative uses of PVs in Fijian English and IN English, including forms such as rid off (17) and involve into (18).
(17) One of the side effects of alcohol is that it rids our body off nutrients … (from Schneider & Zipp, Reference Schneider and Zipp2013:example 6)
(18) Some of these are; women involving themselves into prostitution … (from Schneider & Zipp, Reference Schneider and Zipp2013:example 8)
Among the varieties included here, CA, NZ, and IE fall squarely into phase 5, SG and JA are considered advanced stage 4 (“endonormative stabilization”), and HK, IN, and PH are grouped into phase 3 (“nativization”), though the latter two may be considered transitional between phases 3 and 4 (Schneider, Reference Schneider2007). Our results corroborate those of other recent alternation studies: less advanced varieties (phases 3 and 4) tend to be more different from their mother variety, that is, GB English in most cases (Deshors & Gries, Reference Deshors and Gries2016; Heller et al., Reference Heller, Szmrecsanyi and Grafmiller2017; Röthlisberger et al., Reference Röthlisberger, Grafmiller and Szmrecsanyi2017).Footnote 6 Generally speaking, the dynamic model predicts greater drift away from the mother variety as a new variety proceeds along the cycle, yet this does not seem to apply to languages at the level of the abstract probabilistic grammar.
But we can speculate further about why we might find a split among varieties along the lines of “nativeness” when we look at regional variation in the probabilistic conditioning of this particular variable. Simplifying somewhat, the varieties that we have been characterizing as Outer Circle are alike in that they are—or were at some prior stage—predominantly acquired and used as a second language. It thus seems plausible that the patterns we see in our data are at least partly attributable to biases in L2 acquisition. Despite being quite common and productive in English, PVs are notoriously challenging for L2 learners, especially those whose first language lacks phrasal verbs (Blais & Gonnerman, Reference Blais and Gonnerman2013; Gardner & Davies, Reference Gardner and Davies2007; Schmitt & Redwood Reference Schmitt, Redwood, Meunier, De Cock, Gilquin and Paquot2011), and learners are known to avoid using PVs when they can (Liao & Fukuya, Reference Liao and Fukuya2004; Siyanova & Scmidtt, Reference Siyanova and Schmitt2007). When learners do use PVs, they tend to overuse the continuous variant in contexts where native speakers might not use it (Gilquin, Reference Gilquin2014). Crucially, however, the successful acquisition of a fully productive syntactic alternation requires a sufficient degree of type diversity among the lexical fillers in both competing variants (Hoffmann, Reference Hoffmann, Buschfeld, Hoffmann, Huber and Kautzsch2014; Perek & Goldberg, Reference Perek and Goldberg2015; Wonnacott, Reference Wonnacott2011). In essence, “the more verbs that are witnessed alternating between two [variants], the more learners are willing to assume that other verbs can alternate as well” (Perek & Goldberg, Reference Perek and Goldberg2015:123). What we may be seeing in our data is the result of a decades- even centuries-long process in which widespread general avoidance of particle verbs among L2 learners, coupled with a tendency toward regularization of the continuous variant, led to a substantial reduction in the diversity of fully interchangeable verbs in these varieties. The net effect of this process is a high degree of variational asymmetry among individual verbs where one variant, in this case the split variant, becomes strongly associated with a much narrower range of verbs, leading to an overall dispreference for the split variant in the developing variety. Changes in the uses and associations of specific PVs in specific variants will likely lead to changes in the probabilistic associations among those variants and the higher-level constraints operative in speakers’ PV grammar. Many of these changes may be difficult to predict in the earliest phases and highly variable across varieties, yet we may be able to detect broad trends at latter stages, just as we do in our data. While we cannot possibly explore every aspect of the sociolinguistic history of our nine varieties here, we further note that the kind of structured heterogeneity in particle placement we observe at the global level fits in with a growing body of research highlighting the interrelated roles of L2 acquisition and sociodemographic factors in shaping language evolution (e.g., Bentz & Winter, Reference Bentz and Winter2013; Dale & Lupyan, Reference Dale and Lupyan2012). Overall, it appears that change at the level of abstract probabilistic conditioning is relatively conservative in typical contexts of first language transmission (see Labov, Reference Labov2007), but it is particularly sensitive to disruptions in this process, for example, when the language passes through a kind of second language acquisition “filter.”
The scenario just described is commensurate with probabilistic experience-based approaches to grammar, yet it does not fully explain our findings. While we do find some PV variability across our varieties, the scope of this variability pales in comparison to the variability in global Englishes observed at other levels of structure, most notably lexis and phonetics/phonology. Once again, this relative stability in variable grammars has also been demonstrated for numerous syntactic phenomena, for example, datives, genitives, and to versus -ing complementation (Bernaisch et al., Reference Bernaisch, Gries and Mukherjee2014; Deshors & Gries, Reference Deshors and Gries2016; Heller et al., Reference Heller, Szmrecsanyi and Grafmiller2017; Röthlisberger et al., Reference Röthlisberger, Grafmiller and Szmrecsanyi2017). We see two plausible explanations for why this should be: shared history and shared humanity.
The shared history explanation appeals to the common ancestry of our varieties. Because these varieties have developed from the same mother variety, they have inherited many of the same syntactic forms, and even the same underlying grammatical systems. The fact that the native varieties NZ, CA, and IE English exhibit the highest degree of similarity with British English would seem to lend support to this explanation, as CA and NZ English evolved from settlement colonies in which native speakers were directly transplanted from the home country. Shared history is also manifest in the length and depth of continued contact with Great Britain as these countries have developed postindependence, hence the similarities among British and Irish English.
Shared humanity, on the other hand, refers to the influence of universal, putatively inherent biases in production and comprehension that are thought to influence language structure (e.g., Culbertson, Smolensky, & Legendre, Reference Culbertson, Smolensky and Legendre2012; Hawkins, Reference Hawkins2004; MacDonald, Reference MacDonald2013; Tamminga, MacKenzie, & Embick, Reference Tamminga, MacKenzie and Embick2016). Theories come in many flavors, but they all converge on the same basic idea: the cumulative effect of universal biases in language processing gives rise to the typological patterns we observe across languages and phenomena. Since all language users are sensitive to these biases, we expect similar general tendencies to predominate as structures that satisfy users’ biases become more frequent. At the same time, the periodic emergence of novel (uses of) lexical items and or semantic/pragmatic functions will lead to fluctuations in the quantitative associations between specific variants and features of the linguistic context that users implicitly learn (Perek & Goldberg, Reference Perek and Goldberg2015; Wonnacott, Reference Wonnacott2011). The cognitive biases and learned lexical/functional associations are themselves probabilistic, hence variable, which leads to the development of the constrained variation in probabilistic indigenization that we observe in our study. Our results can thus be taken as evidence for a model of grammar that is shaped both by distributional patterns in the input as well as deep-seated cognitive biases. While purely distributional learning may allow for any possible pattern to emerge, for example, new before given, long before short, (probabilistic) biases in language acquisition and processing will over time cause certain general tendencies to prevail, while still leaving room for some variability in the degree to which these tendencies are realized in the grammar, that is, their effect size. This is just the pattern of probabilistic indigenization that we find.
Finally, when positing possible explanations for novel English as second language patterns, a usual suspect that we have not discussed thus far is the influence of substrate effects. To the extent that the substrate L1 plays a role, its strongest influence may lie in the difficulty imbued by different L1s on the acquisition of particle verbs, though we cannot rule out more direct L1 to L2 transfer of probabilistic cues (e.g., MacWhinney, Reference MacWhinney, Kroll and de Groot1997). In general, we note that more detailed investigation of individual Outer Circle varieties is sorely needed. In particular, diachronic studies of particle placement in the Outer Circle would provide far better resolution of the historical picture, as well as offer testing ground for explanations of probabilistic indigenization in L2 varieties. Such topics require far more detailed language-specific investigations than we can provide here.
CONCLUDING REMARKS
Our study charts the regional variability in the particle placement alternation in English around the globe, conducting a comparative analysis of variation in particle placement in a corpus of spoken and written language data from numerous registers and genres across nine regional varieties. Using several statistical techniques, we adapted and extended methodologies developed in the context of comparative sociolinguistics to examine the emergence of region-specific patterns in the underlying grammatical system of particle placement in these nine varieties, exemplifying a process we call probabilistic indigenization. Because probabilistic indigenization is shaped by numerous competing social and linguistic forces, it proceeds in various places at variable paces, yet we were able to identify several trends in our analyses by focusing on the strength, direction, and ranking of probabilistic constraints as key dimensions for distinguishing among the varieties’ PV grammars. The most notable finding was the high degree of homogeneity in the grammars of the native language varieties in our study, namely British, Canadian, New Zealand, and Irish English. Greater heterogeneity was found among Outer Circle varieties, and none of these varieties were found to be very similar to the native varieties. We (speculatively) attribute this pattern among Outer Circle varieties to the complex interaction between the simplification processes due to second language acquisition and the varying cultural, political, and sociolinguistic ecologies of the individual regions. Our findings also largely accord with a probabilistic grammar approach, which assumes that grammatical knowledge includes implicit knowledge of quantitative patterns over constraints.
On a final note, we want to highlight the potential of our methodology. One of the chief advantages of our method lies in its relative ease of interpretation. Compared to large tables of numbers, techniques such as neighbor-net diagrams provide visualizations of the relationships between variation grammars that are immediately intuitive. Communicating the main findings thus requires relatively little exegesis. A second advantage is that the method can be applied to any kind of sociolinguistic variable—for example, lexical, phonetic/phonological—and it can be scaled up to comparisons of larger and larger numbers of datasets. Another innovation here is the focus on exploratory statistical methods rather than confirmatory analysis, that is, significance tests, as a primary metric for comparison. If the aim of comparative studies is to discern meaningful differences between varieties’ grammars based on quantitative distributions among variable constraints, we need a theoretical model of intracommunity (or speaker) variability and intercommunity effect size in order for significance tests to be truly meaningful. With this in mind, we argue that the substantial similarities in constraint effects, especially among Inner Circle varieties, nonetheless represent strong evidence for the existence of a shared PV grammar, and more important, that the similarities among variable grammars are more appropriately analyzed and interpreted as a continuum rather than as distinct grammars.
SUPPLEMENTARY MATERIAL
To view supplementary material for this article, please visit https://osf.io/x8vyw/.
APPENDIX
Structure of the ICE corpus