Introduction
Obsessive-compulsive disorder (OCD) is characterized by the presence of intrusive thoughts and the urge to display repetitive and ritualistic behaviors that are executed with the goal of preventing or reducing distress or preventing some dreaded event or situation.1, Reference Hu, Liu and Li2 Different subtypes of this heterogeneous disorderReference Mataix-Cols, Rosario-Campos and Leckman3 have been proposed to classify patients with OCD into more homogeneous groups.Reference Leckman, Bloch and King4 These subtypes vary based on the age of presentation, symptomatology,Reference Mataix-Cols, Rosario-Campos and Leckman3, Reference Leckman, Bloch and King4 and even probable etiology.
One of these subtypes is pediatric autoimmune neuropsychiatric disorders associated with streptococcal infections (PANDAS) in which patients have an abrupt onset of OCD, tic disorder symptoms, or both preceded by group A streptococcal (GAS) infections.Reference Swedo, Leonard and Garvey5, Reference Swedo, Leckman and Rose6 Different studies support the hypothesis that this disorder may have an immune etiology,Reference Nicolini, López and Genis-Mendoza7, Reference Cox, Zuccolo and Edwards8 suggesting the production of autoantibodies in response to a streptococcal infection; these antibodies would be able to cross the blood-brain barrier and react against neurons, especially against those located in the basal ganglia, causing motor dysfunction.Reference Kirvan, Swedo, Kurahara and Cunningham9
Neuroimaging studies in OCD suggest a dysfunction in the cortico-striatal-thalamic-cortical (CSTC) circuits, evidenced by the presence of increased gray matter volume in structures belonging to these circuits, such as the lenticular nucleus, putamen, caudate nucleus, nucleus accumbens, pallidum, amygdala, insula bilateral cerebellum, and superior parietal lobe,Reference Radua and Mataix-Cols10 and decrements in the superior frontal gyrus and supramarginal gyrus.11. It is believed that these neuroanatomical alterations are part of the pathophysiology of OCD, as they are related to the symptoms,Reference Insel12–Reference Rauch and Baxter14 for example, the suggestion that the cognitive symptoms in OCD and Tourette’s syndrome (TS) are mediated by the CSTC circuits involving the caudate, whereas the sensorimotor symptoms are mediated by the CSTC circuits involving the putamen.Reference Stein, Goodman and Rauch15
Most neuroanatomical studies on OCD have been conducted in adults, and as subjects with PANDAS present with different symptoms and this entity possibly has a different etiology than that of the other OCD subtypes, neuroanatomical characterization of these patients is crucial to the understanding of the pathophysiology and etiology of this disorder; in addition, these brain changes may have potential applications for clinical practice, especially to improve diagnostic assessment, currently based only on symptoms such as the abrupt onset of obsessions and compulsions, as proposed by Swedo in 1998.Reference Swedo, Leonard and Garvey5
Neuroimaging studies on early-onset OCD associated with an immune etiology (PANDAS, pediatric acute-onset neuropsychiatric syndrome [PANS], or both) are scarce; however, the results are consistent, suggesting bilateral volume increases mainly in the caudate nucleus and other basal ganglia structures, such as putamen and globus pallidusReference Giedd, Rapoport, Garvey, Perlmutter and Swedo16, Reference Elia, Dell and Friedman17 and hypoperfusion in the striatum associated with a subcortical inflammatory process derived from the reaction to the streptococcal infection.Reference Citak, Gücüyener, Karabacak, Serdaroglu, Okuyaz and Aydin18 So far, the neuroanatomical characteristics of the gray matter and white matter in areas other than the basal ganglia have not been studied in these subjects.
Multiple studies have been conducted to identify differences between subjects with OCD and healthy subjects.Reference Rotge, Langbour and Guehl11, Reference Valente, Miguel and Castro19–Reference Yoo, Roh and Choi23 However, although some of these differences may be irrelevant for the prediction of OCD, the selection of structures with a greater sensitivity for the classification of patients is crucial to understand the biological basis of OCD, and these classification methods have been proposed as tools to identify potential biomarkers and support the clinical diagnosis,Reference Trambaiolli, Biazoli, Balardin, Hoexter and Sato24 in this case, a subtype of early-onset OCD. This was the first study to apply a multivariate pattern analysis (MVPA) to subjects with early-onset OCD and to focus on a specific subtype of patients. Subsequently, it was the first study of this type in PANDAS.
In the present study, we characterized the neuroanatomy of a sample of subjects with a presumptive diagnosis of PANDAS, comparing them with healthy subjects, and we evaluated the accuracy of the neuroanatomical features for the classification of patients with PANDAS using a multivariate pattern. We hypothesized that the gray matter and white matter would contribute differently to the classification of patients with PANDAS and healthy subjects.
For the characterization of these subjects, we used voxel-based morphometry (VBM), based on a mass univariate analysis that had interesting results; however, for the characterization of this subgroup of patients and clinical practice, the need for biological markers that can help distinguish between patients and controls arises. For this purpose, techniques such as MVPA have been developed that account for interregional correlations, in this case, in the anatomical images, and allow for the characterization of spatially distributed features that are sensitive enough to differentiate between patient groups and healthy subjects.Reference Pereira, Mitchell and Botvinick25
Methods
Participants
The anatomical magnetic resonance images (MRI) of 14 patients from a previous study sampleReference Nicolini, López and Genis-Mendoza7 were analyzed.
The patient group comprised 14 subjects (10 males, 4 females) who were under 18 years of age and diagnosed with OCD, tics, or both based on the criteria of the Diagnostic and Statistical Manual of Mental Disorders, Fourth Edition (DSM-IV), including in the Mini International Neuropsychiatric Interview (MINI)Reference Sheehan, Lecrubier and Sheehan26 and International Classification of Diseases (ICD-10).27 In addition, the abrupt and early onset of symptoms and episodic course (acute exacerbations, independent of temporal course), as well as a history of recurrent infections, was considered for the diagnosis. As previously mentioned, anti-streptococcal antibodies were detected in the patient group.Reference Nicolini, López and Genis-Mendoza7 Motor tic comorbidity was assessed using diagnostic interviews approved by the International College of Obsessive-Compulsive Spectrum Disorders (ICOCS). The severity of OCD was assessed using a validated Spanish version of the Yale-Brown Obsessive Compulsive Scale.Reference Nicolini, Herrera and Páez28, Reference Ulloa, de la Peña, Higeura, Palacios, Nicolini and Ávila29 Exclusion criteria for this group were: age of>18 years, medical background of rheumatic fever, Sydenham’s chorea, or autoimmune disorders. Within this group, 9 of the patients had a diagnosis of OCD and tics, of whom 5 were men and 4 were women. The remaining 5 patients had the diagnosis of OCD only and were male.
The patient group was paired according to sex and age to a control group of 14 neurologically and psychiatrically normal subjects. It was verified that all subjects in the control group had a normal neurological and psychiatric examination and did not have a history of recurrent infections or neurological or psychiatric diseases. The mean age was 11.14 years, with a standard deviation of 1.72 years, for both groups.
The legal representatives of the participants (as they were minors) signed an informed consent. The project and all procedures were approved by the ethics committee of Carracci Medical Group Clinic in Mexico City.
Image acquisition
A 3T GE HDtx (GE Medical Systems, USA) scanner was used. Three-dimensional T1-weighted sagittal brain images were acquired using a spoiled gradient-recall (3D-SPGR) sequence with the following parameters: TR/TE = 13 ms/5.5 ms, voxel size = 0.46 × 0.46 × 1.2 mmReference Mataix-Cols, Rosario-Campos and Leckman3, 100 slices, slice thickness = 1.2 mm, and matrix size = 512 × 512. For DTI, we used a single-shot echo-planar imaging (EPI) sequence in contiguous axial planes covering the whole brain.
Voxel-based morphometry analysis
Preprocessing was carried out using SPM8 software (http://www.fil.ion.ucl.ac.uk/spm/software/spm8/) implemented in MATLAB 2013b (Math Works, Natick, MA, USA). The images were reoriented to an anterior commissure–posterior commissure (AC-PC) axis and segmented into gray matter, white matter, and cerebrospinal fluid tissues; a population-specific template was created using a DARTEL algorithmReference Ashburner30; the images were normalized to an MNI space and modulated to preserve volumetric information; and finally, the images were smoothed with a Gaussian FWHM kernel of 8 mm. The smoothed, modulated, and normalized images of the gray matter and white matter were used in a multivariate pattern analysis.
For the VBM analysis, the preprocessed gray and white matter images were submitted to a statistical analysis performed in SPM8; 2-sample t tests were estimated separately for the gray and white matter. The mask for the analysis was implicit; global calculation was carried out using the “mean” option implemented in SPM8; global nuisance effects derived from the total tissue volumes were accounted using the “proportional” method implemented in SPM8.
The significance level for VBM analysis was set at a p of <0.005 (uncorrected), and cluster size (k) of a minimum 10 of contiguous voxels was used. Anatomical localization of the MNI coordinates was identified using the Talairach Daemon software version 2.4.3 (http://www.talairach.org/index.html).Reference Lancaster, Woldorff and Parsons31, Reference Lancaster, Rainey and Summerlin32 Visualization of the VBM results was carried out using xjView software version 8.14 (http://www.alivelearn.net/xjview8).
Surface-based analysis
The surface-based analysis was carried out using FreeSurfer (v. 5.1.6; Massachusetts General Hospital, Harvard Medical School; http://surfer.nmr.mgh.harvard.edu). The processing stream started with a Talairach transform of each subject’s native brain, removal of the nonbrain tissue (the skull, eyeballs, and skin),Reference Segonne, Dale and Busa33 and segmentation of the gray and white matter tissue.Reference Sled, Zijdenbos and Evans34 The cortical surface of each hemisphere was inflated to an average spherical surface to locate both the pial surface and gray matter–white matter boundary.Reference Reuter, Schmansky, Rosas and Fischl35 The entire cortex for each subject was then visually inspected; all segmentations were accurate; and none of the segmentations needed to be manually corrected.
The cortical thickness was computed as the shortest distance between the pial surface and gray matter–white matter boundary at each point across the cortical mantle. The global mean cortical thickness for each subject was computed by averaging the cortical thickness at each vertex, right and left hemispheres separately, and was used in the statistical analyses. The regional thickness value at each vertex for each subject was mapped to the surface of an average brain template allowing visualization of data across the entire cortical surface (described at http://surfer.nmr.mgh.harvard.edu/fswiki/FsAverage). The cerebral cortex was parcellated into 34 regions,Reference Desikan, Ségonne and Fischl36 and a variety of surface-based data including maps of cortical volume and surface area, as well as curvature and sulcal depth, were created. Data were resampled for all subjects onto a common spherical coordinate system.Reference Fischl, Sereno, Tootell and Dale37
The cortical map for each subject was smoothed with a Gaussian kernel of 10-mm full width at half maximum for the entire cortex analyses. The subcortical volumes were obtained from the automated procedure for volumetric measures of the brain structures implemented in FreeSurfer.
Statistical maps were generated using the FreeSurfer tool, Query, Design, Estimate, Contrast (QDEC). For each hemisphere, a general linear model (GLM) was computed vertex by vertex for analysis of cortical thickness, surface area, and cortical volume, controlling for the effects of gender and age to avoid spurious results. Family-wise error correction at a cluster level (p < 0.05, 2-tailed) was applied to correct for multiple comparisons, and the corresponding threshold cluster size was determined using a Monte Carlo simulation (10,000 iterations) with a p set at <0.05.
Diffusion tensor imaging analysis
Voxel-wise statistical analysis of the fractional anisotropy (FA) data was carried out using tract-based spatial statistics (TBSS),Reference Smith, Jenkinson and Johansen-Berg38 part of FSL.Reference Smith, Jenkinson and Woolrich39 FA images were created by fitting the diffusion tensor to the raw diffusion data using an FMRIB Diffusion Toolbox and then were brain extracted using a brain extraction tool (BET),Reference Smith40 part of FMRIB Software Library (FSL).
In TBSS, the FA images for all subjects were aligned and later affined into a 1 × 1 × 1-mm MNI152 standard space. Next, all FA images were averaged to create a mean FA image. The mean FA was fed into the tract skeleton generation, which represents the centers of all tracts common to the group. The aligned FA image for every subject was projected onto the mean FA skeleton by filling the skeleton, with the maximum FA values from the nearest relevant tract center, to create a skeletonized FA map.
Voxel-wise cross-groups for the study were carried out for all voxels with an FA of≥0.20 to assess differences between the PANDAS and control groups with a 2-sample unpaired t testReference Smith, Jenkinson and Johansen-Berg38; we used a Monte Carlo permutation test (5000 permutations) to create the t statistics maps. Statistical images were thresholded at a p of <0.05, with a family-wise error correction for multiple voxel comparisons,Reference Winkler, Ridgway, Webster, Smith and Nichols41, Reference Nichols and Holmes42 and t statistical maps were obtained with a family-wise error (FWE)-corrected p of<0.05. The same process was applied for generating statistics maps of mean diffusivity (MD), radial diffusivity (RD), and axial diffusivity (AD).
Gaussian process classifiers
Gaussian process classifiers (GPC)Reference Rasmussen and Williams43 are machine learning methods that assign class-conditional probabilities based on information carried by image voxels. The inherent computation of class posteriors in GPC facilitates the estimation of accuracy, sensitivity, and specificity of the classifier, directly from the neuroanatomical features of the white and gray matter tissues. GPCs are supervised classifiers and, thus, undergo a training and testing phase. During training, the GPC determines the predictive distribution that better discriminates between class patterns.
GPCs were implemented using the PROBID platform (http://www.kcl.ac.uk/ioppn/depts/neuroimaging/research/imaginganalysis/Software/PROBID.aspx).Reference Bishop44 It is worth noting that the PROBID algorithms perform feature selection to determine the best features (voxels) for tissue class discrimination through a recursive feature elimination scheme.Reference Rocha-Rego, Jogia, Marquand, Mourao-Miranda, Simmons and Frangou45
In this study, independent GPC models for the gray and white matter were implemented. A 1000-way permutation test for estimating the significance of classification performance for a p of <0.05 was carried out for evaluation. Gray and white matter spatial discrimination maps were obtained and visualized using xjView (http://www.alivelearn.net/xjview8/). No thresholding was used for discrimination maps.
Results
Voxel-based morphometry analysis
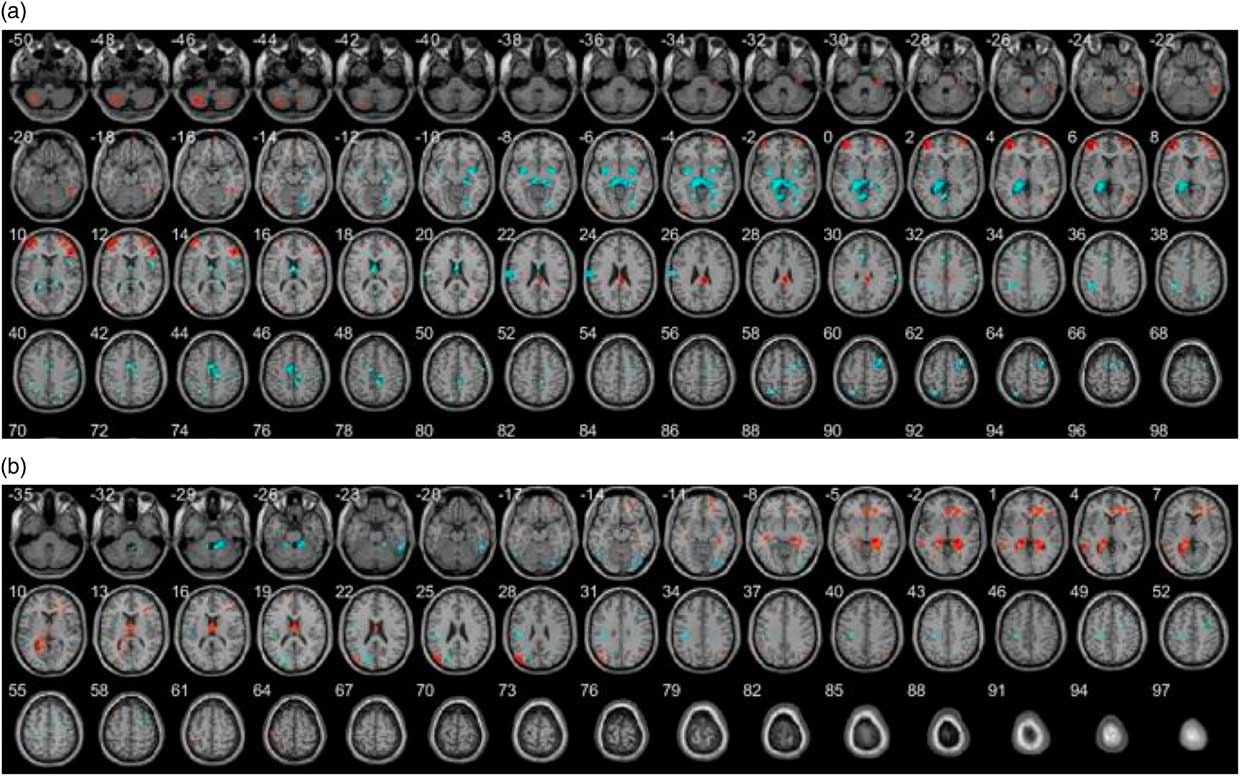
In the VBM analysis, we found differences in the gray and white matter volume between subjects with PANDAS and healthy controls. Briefly, we identified an increase in gray matter volume in the limbic and parietal lobes and a decrease in the frontal lobe and cerebellum in subjects with PANDAS, as compared with healthy controls. Regarding the white matter volume, we found a decrease in the frontal and occipital lobes and an increase in the parietal lobe and cerebellum in PANDAS subjects. The Supplementary Material details the results of the VBM analysis (the lobes, gyrus, MNI coordinates, and p values).
The spatial distribution of the local differences in the gray matter and white matter between the groups is presented in Figure 1.
Spatial distribution of the local differences in volume between the groups. (a) Gray matter. (b) White matter. Decreases in volume in the PANDAS group are presented in red. Increases in volume in the PANDAS group are presented in blue.

Results derived from the VBM reflect the mean local and volumetric differences.Reference Attwells, Setiawan and Wilson46 Despite the previously mentioned differences, in the Supplementary Material, details of the VBM analysis results and a comparison of these results with the GPC results are reported, to obtain comprehension of the nature of the neuroanatomy of PANDAS.
Cortical surfer analysis and white matter tract-based spatial statistics analysis
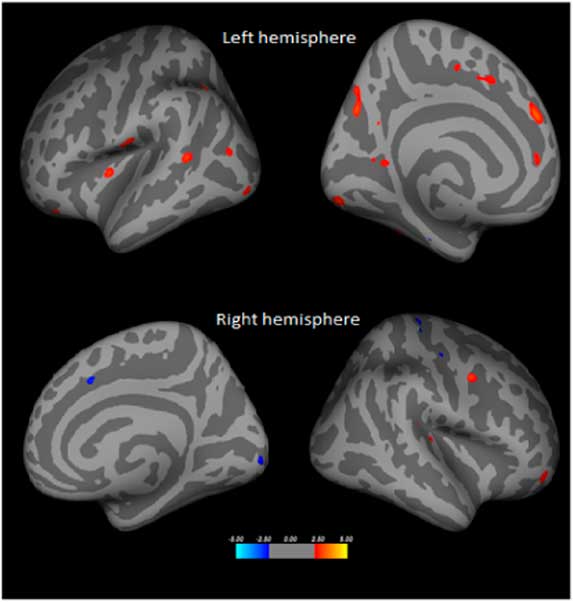
Differences in cortical thickness were detected in 20 clusters in the left hemisphere, and 15 were detected in the right hemisphere before correction for multiple comparisons in the Monte Carlo simulation (shown in Figure 2). After multiple comparisons, these differences were not significant. We compared other cortical features such as the sulci, volume, curvature, and gyrification, and no significant differences existed between the 2 groups.
Comparison of the cortical surface between patients with PANDAS and controls. An illustration of the results of the FreeSurfer analysis for the cortical surface area comparing subjects with PANDAS vs healthy controls. The colored legend at the bottom of the figure represents the z value at each vertex. Warm colors indicate a greater surface area in a comparison of the PANDAS group vs control group, and cold colors indicate less surface area in the direction of the stated comparison. Results are shown at a P of <0.05 without correction for multiple comparisons.

No significant differences were found in the FA, MD, RD, or AD between patients with PANDAS and the control group with a p of <0.05.
Predictions
We implemented independent GPC models for the gray and white matter, as we identified significant differences between patients with PANDAS and healthy controls. Surface-based and FA features were excluded from this analysis as no significant differences were found between the groups for these characteristics. The GPC analysis of the gray matter images indicated that the classifier had an overall accuracy of 75% (sensitivity = 78.57%; specificity = 71.43%; p = 0.004).
The GPC results for the white matter showed that this classifier had an overall accuracy of 60.71% (sensitivity = 64.29%; specificity = 57.14%; p = 0.164).
The overall accuracy of the classifiers referred to the ability to assign subjects to their group correctly and was based on the sensitivity; in this study, it referred to the probability of being correctly classified as a patient if a subject was really a patient, and specificity referred to the probability of being classified as a control when a subject was really a control. The results of the MVPA and VBM are not directly comparable; MVPA referred to the predictive value of each voxel to classify the subjects to each group.
Discrimination maps
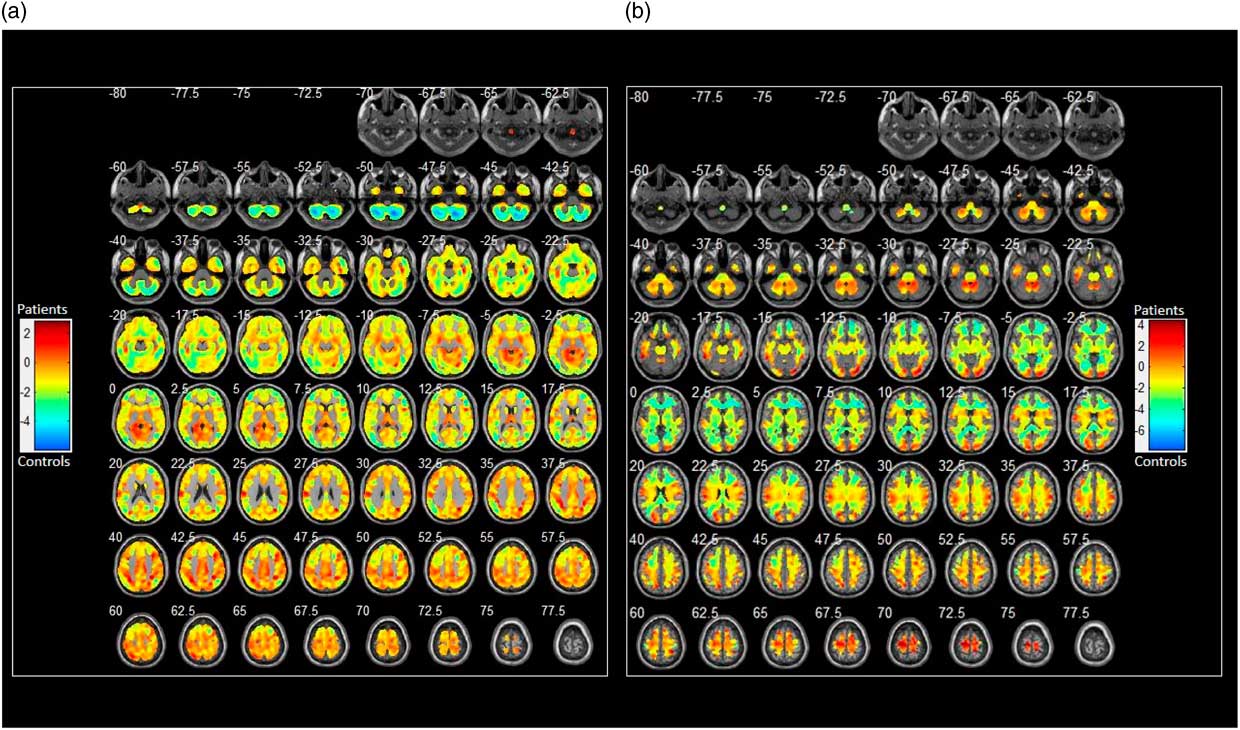
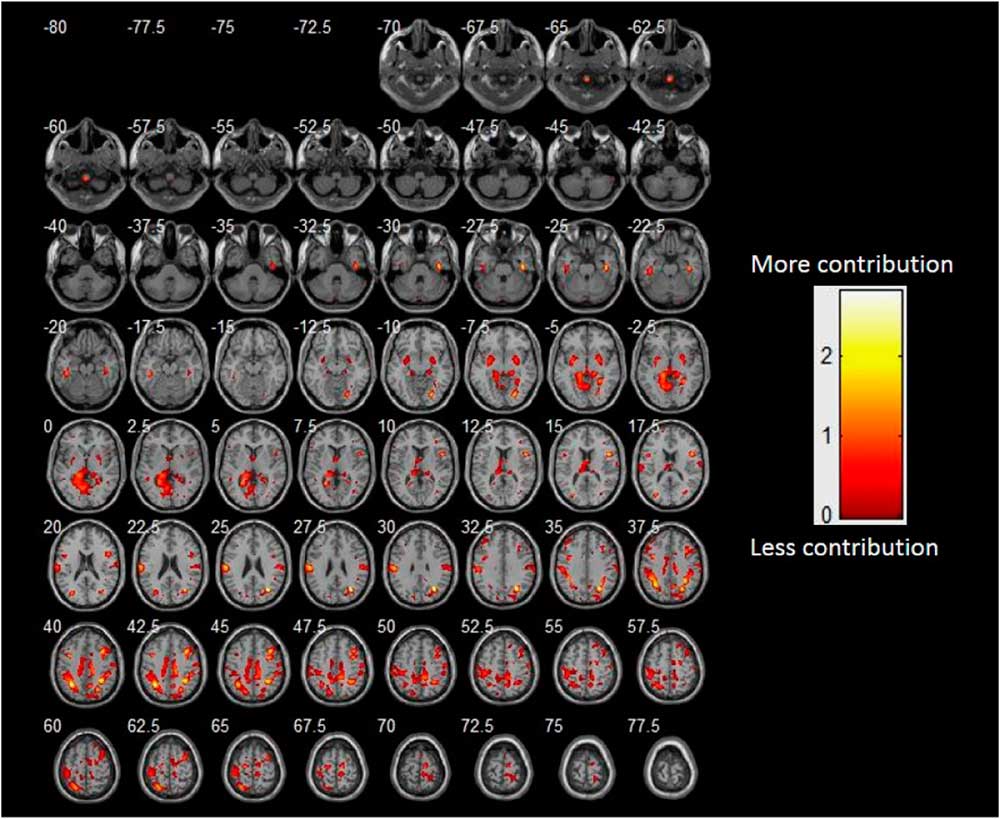
The present study aimed to evaluate the ability to use gray and white matter tissues to discriminate between groups (results shown in Figure 3), emphasizing the neuroanatomical pattern for classifying patients correctly. Positive coefficients derived from the analysis of gray matter are presented to help facilitate the interpretation of the discrimination maps (Figure 4); this neuroanatomical pattern was associated with a greater probability of having PANDAS.
Discrimination maps of (a) the gray matter and (b) white matter. The discriminative pattern for the gray matter and white matter for patients with PANDAS vs the controls. The relative importance of each region for between-group discrimination is translated here in a scale ranging from negative to positive numbers, reflected by the color brightness of each cluster. The red clusters (positive) indicate regions that contribute to the correct classification of patients, and the blue clusters (negative) indicate regions that contribute to the classification of the control group.

The neuroanatomical pattern of the gray matter associated with the correct classification of patients. The pattern of the gray matter in patients with PANDAS vs controls. Only positive coefficients derived from the analysis of the gray matter are presented, as this pattern contributed the most to the classification of patients. The neuroanatomical pattern of the gray matter was widely distributed across the cortex, subcortex, and cerebellum.

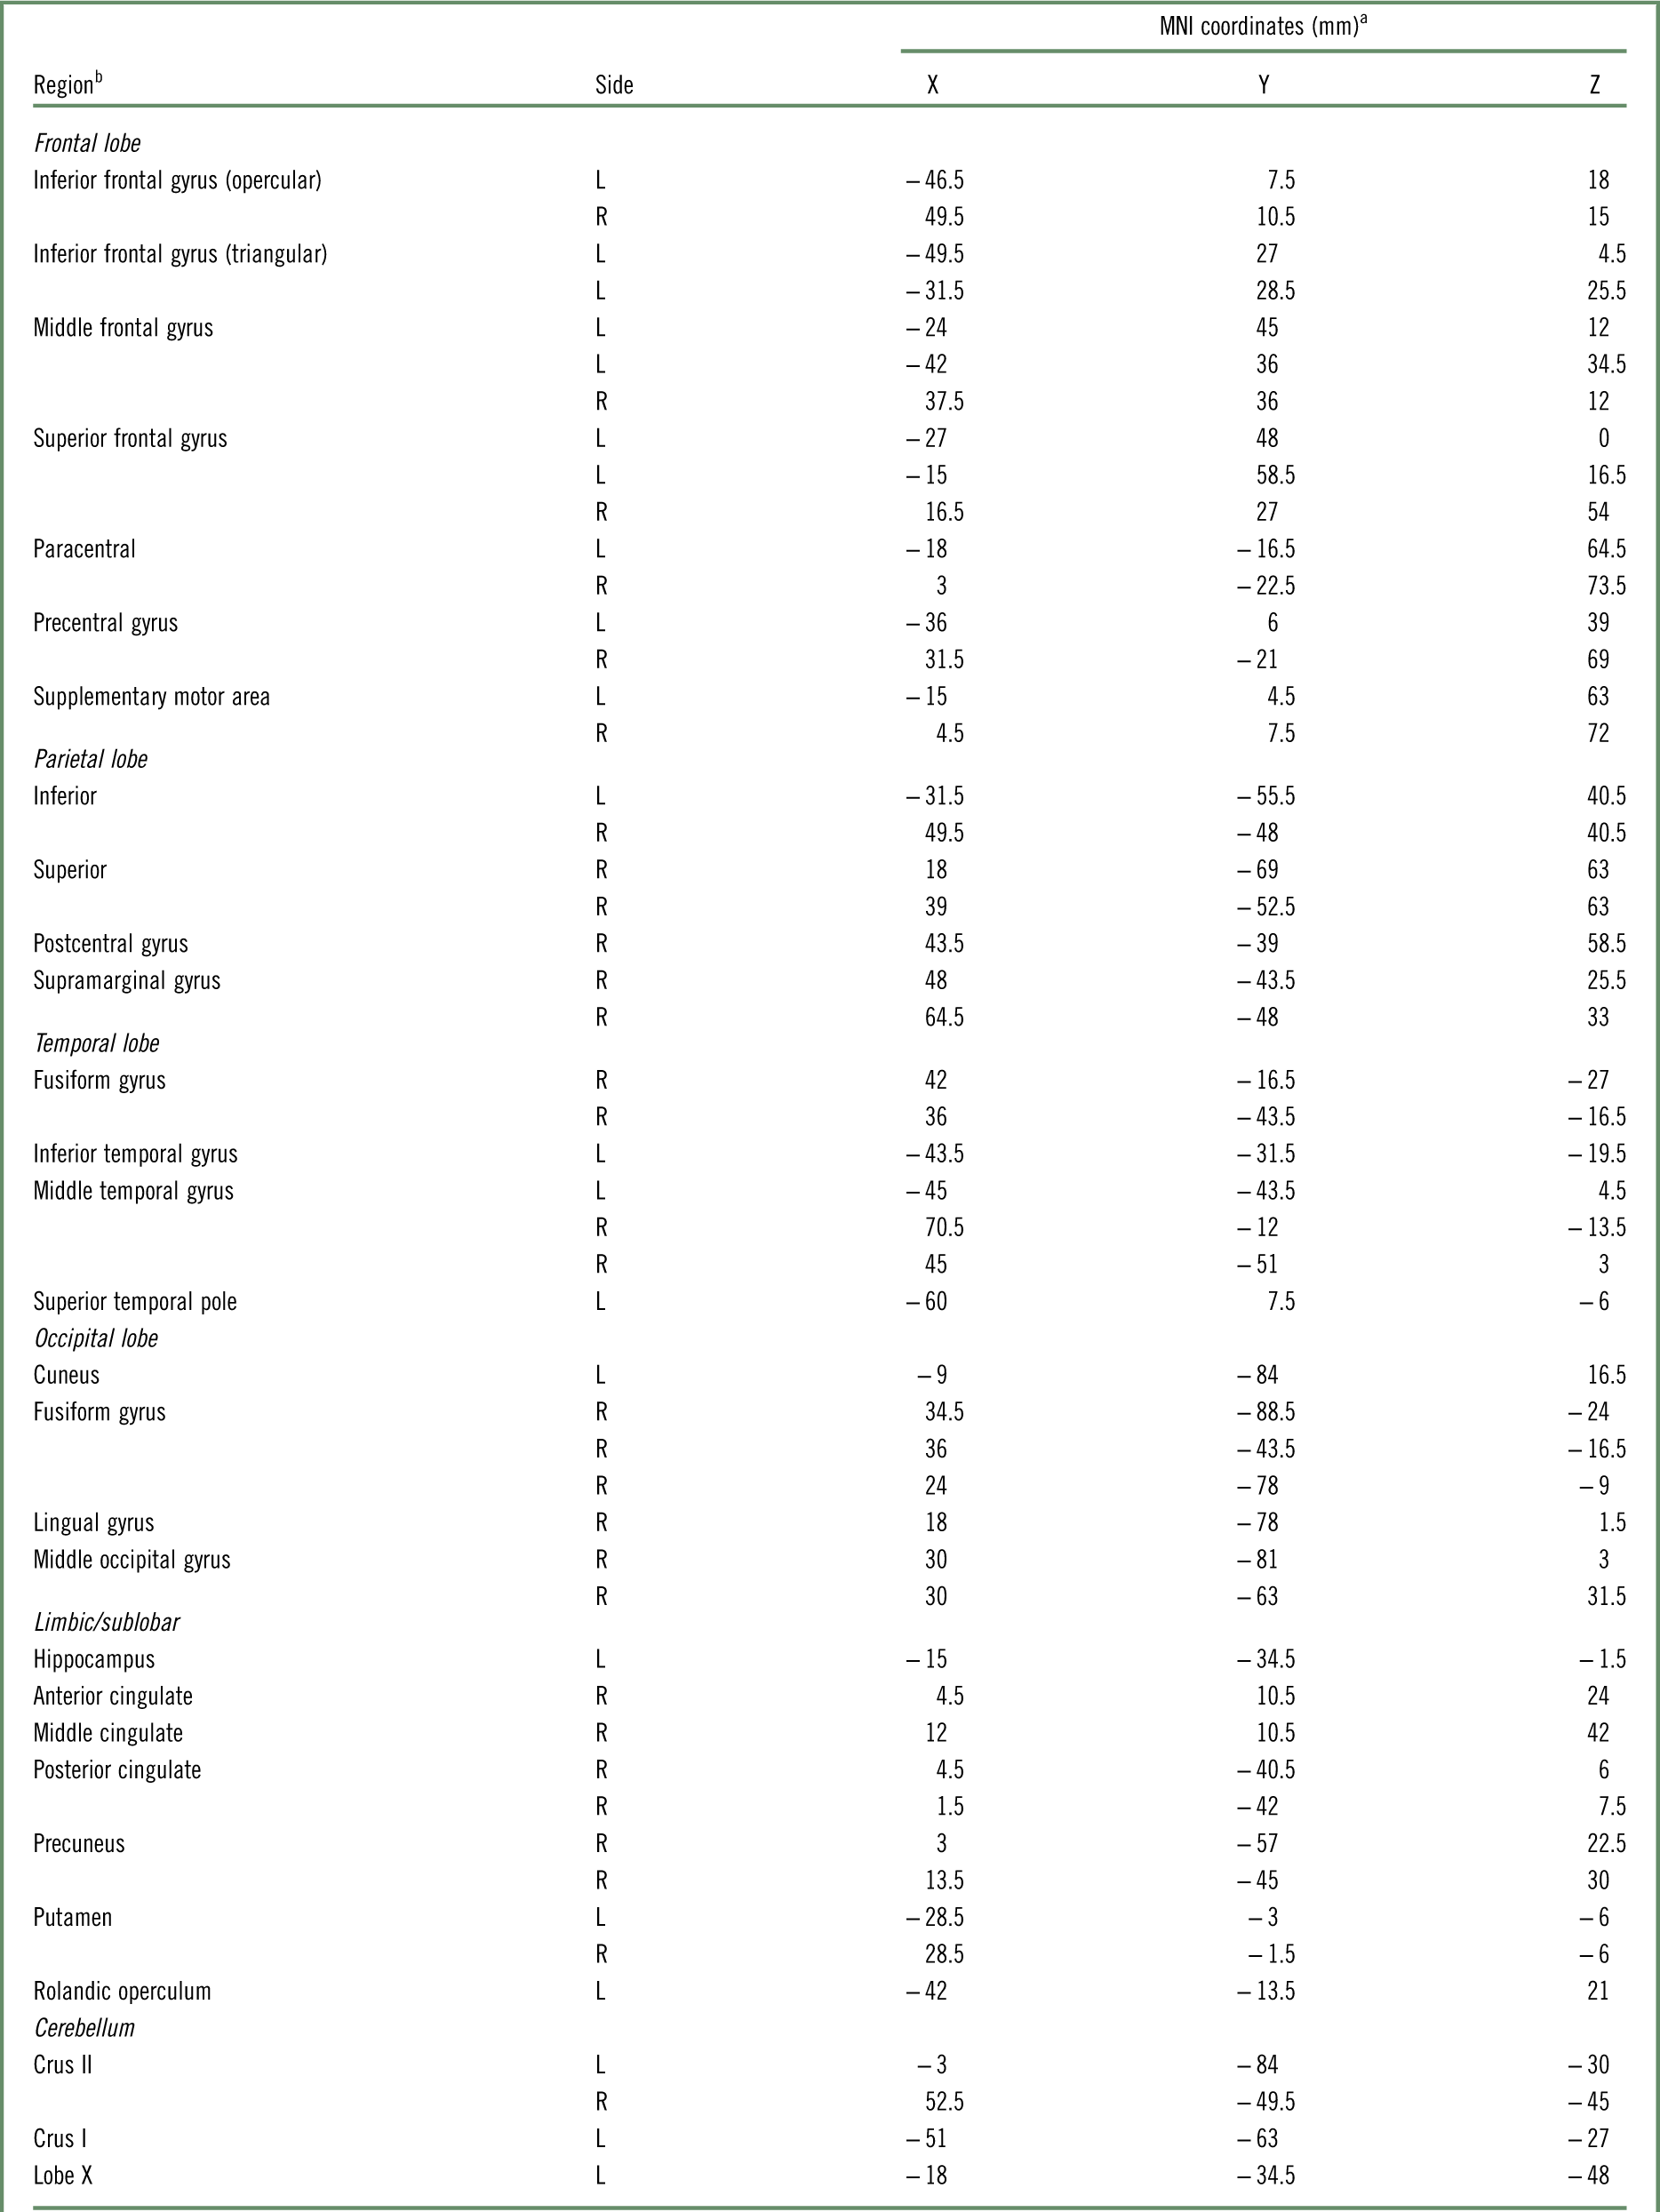
The neuroanatomical pattern of the gray matter included regions of the frontal lobe that are distributed bilaterally; for the parietal lobe, a predominantly right distribution was observed; in the temporal lobe, a bilateral distribution was observed in the middle regions, a predominantly left distribution in the inferior and superior temporal pole; and the pattern for the occipital lobe included the fusiform gyrus. For the subcortical and limbic regions, the pattern included the entire cingulate cortex, hippocampus, precuneus, and basal ganglia, such as putamen. In addition, the cerebellar regions such as the Crus I and II contributed to the patient classification (Table 1).
Gray matter regions that contributed to the patients’ classification

L = left; R = right.
a Peaks of maximum intensity.
b Labels are based on the Automated Anatomical Labeling Atlas.
The white matter images did not allow for the correct classification of the subjects, according to the permutation test. Discrimination maps represent the spatial pattern of the coefficients associated with the contribution of each voxel to the discriminant function; therefore, they should not be interpreted locally, for instance, they represent the multivariate contribution of the gray or white matter to classify the subjects correctly.
Interestingly, large clusters were observed: the peak corresponding to the left parietal xyz coordinate (−31.5, −55.5, 40.5) had an area of 17,264 voxels including the frontal and cingulate regions. The peak corresponding to the xyz coordinate (−15, −34.5, −1.5), located in the left hippocampus, corresponded to a large cluster (7492 voxels), extending over several limbic regions such as the parahippocampal gyrus and regions of the thalamus such as the pulvinar. Another large cluster (6007 voxels) with a peak located in the xyz coordinate (30, −63, 31.5), corresponded to the right middle occipital gyrus, extending over the posterior regions of the temporal lobe, with association areas such as the angular gyrus, and also included regions such as the insula.
The white matter images did not allow for the classification of the subjects correctly, according to the permutation test. The discrimination maps represented the spatial pattern of the coefficients associated with the contribution of each voxel to the discriminant function; therefore, they should not be interpreted locally, for instance, they represent the multivariate contribution of the gray or white matter to classify subjects correctly.
Discussion
The present study aimed to carry out a global analysis of all brain structures previously reported or involved in OCD that allowed us to examine those structures that had not been previously studied. To our knowledge, this was the first study to identify the neuroanatomical characteristics for a sample of subjects with a presumptive diagnosis of PANDAS, in whom we identified alterations in the gray matter volume in the frontal lobes, parietal lobe, temporal lobe, subcortical area, cerebellum, and basal ganglia. Those structures have not been examined in previous studies. One of the strengths of the present study was the use of different neuroimaging techniques to study the entire brain that allowed us to detect changes not previously reported.
Regarding the basal ganglia, we found a greater volume of gray matter in this area in patients with PANDAS, coinciding with previous reports on patients with this OCD subtype; interestingly, while comparing both groups, the subjects with PANDAS presented with a reduced volume of white material in this area. We detected alterations in other areas that had not been previously studied such as the frontal lobe, parietal lobe, temporal lobes, subcortical areas, and cerebellum. Regarding the white matter volume, we found volume differences in the same areas. We could not detect significant differences in the voxel differences for the DTI measures (FA, MD, RD, and AD) or cortical features (thickness, sulci, volume, curvature, and gyrification) between subjects with PANDAS and healthy controls.
A previous study reported that pediatric patients with OCD exhibited significantly greater FA compared with matched controls in the left dorsal cingulum bundle, splenium of the corpus callosum, right corticospinal tract, and left inferior frontal-occipital fasciculusReference Gruner, Vo and Ikuta47 and a later study found an association between the age of onset and FA reductions in the right thalamus and RD increases in the right body of the corpus callosum. Our results contrast with these findings; we could not find any significant differences in the white matter features, so more studies are necessitated with larger samples to clarify the role of the white matter integrity in PANDAS.Reference Rosso, Olson and Britton48
As for the cortical surface analysis, our results differ from those of a previous study, the only one exploring cortical surface features in children with OCD; in 2011, Falluca et al Reference Fallucca, MacMaster and Haddad49 reported that patients with OCD (mean age 13.02 years) had a thinner parietal cortex, as compared with age-matched healthy controls. The differences between the samples of both studies could explain our results; our sample possibly represented a subgroup of patients with OCD, characterized by a history of recurrent infections and the presence of specific antibodies, and the sample described in the Falluca et al study did not have these characteristics.
Other factors that could have influenced our results are the possibility of compensatory changes that minimized the neuroanatomical changes present at certain stages of the disease and the effect of medication used as a treatment of the symptoms in our population.
Regarding classifiers, the results indicated that the neuroanatomical pattern of the gray matter that was associated with a greater probability of a diagnosis of PANDAS was characterized by a wide distribution of voxels in the cortical and subcortical regions. With the GPC model, we could detect neural networks widely distributed in different brain structures that have been consistently implicated in the development of OCD traits. They included mainly the subcortical regions such as the putamen and pulvinar and cortical regions such as the parietal lobe, as well as the medial and dorsal regions of the frontal lobe and anterior cingulate cortex.Reference Radua and Mataix-Cols10, Reference Peng, Lui and Cheung50
The GPC model allowed for the detection of the frontal networks involving the dorsal regions such as the opercular and triangular portions of the inferior frontal gyrus and supplementary motor area. This finding is interesting because it has been suggested that the inferior frontal gyrus is crucial for the selection of concurrent responses and selective inhibition of behavior.Reference Peng, Lui and Cheung50 The neuroanatomical traits of these regions could explain the etiology of both the tics and the compulsions in this group of subjects with PANDAS.
The findings of the multivariate pattern of the gray matter and their contribution to the classification of patients are similar to those reported by Hu et al 2 in adults with OCD. They described a neuroanatomical pattern involving the frontal lobe, parietal-temporal-occipital junction, and cerebellar regions. The consistency between both studies can be observed at the level of overall accuracy for classifying patients. However, our results indicate that the neuroanatomical pattern of the white matter did not contribute to the classification of patients; this is not consistent with Hu et al 2 and could be because of the sample characteristics, as in the present study, patients had a subtype of early-onset OCD, tics (<18 years), or both and because our sample represents a subgroup of subjects with OCD. In addition, white matter volumetric alterations have been reported in the dorsolateral and anterior regions, but these white matter changes were not associated with the severity of the OCD symptoms in children and adolescentsReference Lázaro, Ortiz and Calvo51; therefore, it is possible that the age of symptom onset differentially impacts tissues.
Among the structures that contributed to the subject classification, we found that structures related to motor tasks and inhibition, for example, the putamen and pars triangularis, which are part of the cortico-striato-thalamo-cortical circuitry, were associated with the psychopathology of OCD,Reference Li and Mody52 and different feature selection algorithms have pointed to these structures as relevant in the classification of adult patients with OCD. The putamen is implicated in various motor activities, motor control learning, preparation, and motor performance tasksReference Jenkins, Brooks, Nixon, Frackowiak and Passingham53, Reference Marchand, Lee and Thatcher54; however, the pars triangularis is related to inhibitory control processes.Reference Bari and Robbins55, Reference Trambaiolli, Biazoli, Balardin, Hoexter and Sato24
An interesting result was the presence of a cerebellar network in the patient group. In addition to the well-known role in motor and language functions, the cerebellum has a regulatory role in behavior, especially in the area of social skills, as it has been reported that cerebellar dysfunction affects behavioral inhibitionReference Schmahmann56, Reference Schmahmann, Weilburg and Sherman57 that could be related to the inhibitory failure that characterizes OCD. It has also been suggested that the Crus I and II cerebellar regions, which contributed to the patient classification, receive projections from the anterior cingulateReference Stoodley and Schmahmann58; the anterior cingulate cortex has been consistently involved in the process of behavioral inhibition through the suppression of inappropriate behavior and regulation of goal-oriented behavior.Reference Aron59, Reference Posner and Rothbart60 In addition, this structure has been implicated in the pathogenesis of tics and Tourette’s syndrome.Reference Schmahmann, Weilburg and Sherman57, Reference Schmahmann61
The use of the GPC technique that allowed for the observation of the neuroanatomical gray matter pattern associated with the PANDAS classification, instead of only local differences between groups. The GPC technique is considered more powerful for the detection of neuroimaging-based patterns, as compared with the SVM procedure. GPCs are probabilistic classifiers, in contrast with the binary classification of SVM, and this characteristic reduces the rate of false negatives.1 Another advantage of GPC classifiers is the higher translational applicability in clinical practice as they allow for inference at an individual level; meanwhile, other techniques are based on average estimates at a group level that limit their usage in clinical practice in which doctors need to make decisions about individuals.Reference Hu, Liu and Li2 In addition, predictive algorithms that provide probabilistic predictions, such as GPC, may provide additional advantages for clinical studies in psychiatry, in which diagnostic labels are inherently uncertain, and the probabilistic predictions can be easily recalibrated to accommodate variations in disease prevalence.Reference Wolfers, Buitelaar, Beckmann, Franke and Marquand62
The present study had some limitations. The sample size was relatively small, so future studies should include more subjects to replicate and confirm the findings, and we are working to increase the sample number. It would have been preferable to have included other groups of patients with OCD for comparison, such as patients with pediatric OCD with a trigger of non-immune symptoms and those with late-onset OCD.
Conclusions
A multimodal approach is useful in the neuroanatomical characterization of patients with PANDAS. The GPC pattern analysis allows for the detection of neuroanatomical patterns in patients diagnosed with PANDAS, and it was also useful to detect other neuroanatomical traits (for example, cerebellar networks) that contributed to the good accuracy (75%) demonstrated in the classification of patients with PANDAS. Regarding the cortical surface analysis in our sample, there were no significant differences between the groups.
The results of this integrative study, coupled with those of the previous immunobiological study involving this sample,Reference Nicolini, López and Genis-Mendoza7 enable the understanding of a complex disorder like OCD, suggesting that a subtype of PANDAS could have an immune origin associated with the anatomical characteristics of the gray matter distributed widely in the brain. The integration of neuroimaging, immune, and clinical data in future studies is crucial for the understanding of this OCD subtype.
Disclosures
Camilo de la Fuente-Sandoval has received grant support from Janssen (Johnson & Johnson) and has served as a consultant and/or speaker for AstraZeneca, Eli Lilly, and Janssen. Humberto Nicolini has received grant support from Eli Lilly México and has served as a consultant and/or speaker for Roche México and MSD México. Brenda Cabrera, César Romero-Rebollar, Luis Jiménez-Ángeles, Alma Genis-Mendoza, Julio Flores, Nuria Lanzagorta, María Arroyo, Daniel Santana, Vera Medina-Bañuelos, and Emilio Sacristán do not have anything to disclose.
Supplementary Material
To view supplementary material for this article, please visit https://doi.org/10.1017/S1092852918001268