Introduction
The introduction of quantum dots (QDs) for biologic imaging in 1998[Reference Bruchez, Moronne, Gin, Weiss and Alivisatos1,Reference Chan and Nie2] was thought to herald a coming revolution in the field. QDs, crystalline semiconductor nanoparticles, exhibit many properties conducive to imaging because of their small size. Broad excitation spectra enable imaging of multiple colors with a wide variety of excitation sources. High absorption cross sections enable improved photon generation compared to molecular fluorescent dyes.[Reference van Sark, Frederix, Bol, Gerritsen and Meijerink3] Narrow emission spectra and size-tunable fluorescence are ideal for multiplexed applications that require several distinct colors to be distinguished in the visible spectrum. Building on these initial reports, QD labels were demonstrated for in vitro[Reference Wu, Liu, Liu, Haley, Treadway, Larson, Ge, Peale and Bruchez4] and in vivo[Reference Dubertret, Skourides, Norris, Noireaux, Brivanlou and Libchaber5] labeling applications across many organismal models. However, researchers were poised for a revolution that never came. Although QD products have been introduced by a variety of vendors, there are no clinically approved QDs, and fluorescent dyes remain the mainstay of biologic imaging.
One obvious limitation to the clinical adoption of QDs is their toxicity.[Reference Shiohara, Hoshino, Hanaki, Suzuki and Yamamoto6] The most popular QDs for imaging applications are composed of CdSe cores with ZnS passivating shells (CdSe/ZnS). Cadmium is a heavy metal that yields chronic toxicity and carcinogenesis in humans, disrupting DNA repair, hindering mitochondrial respiration, and interfering with systems that employ cations of similar charge (e.g., Zn2+, Mn2+) as co-factors.[Reference Waalkes7] Despite the fact that studies in primate models yielded no observable effects over 90 days, most of the administered dose remained in the organs of the reticuloendothelial system,[Reference Ye, Yong, Liu, Roy, Hu, Zhu, Cai, Law, Liu, Wang, Liu, Liu, Hu, Zhang, Swihart and Prasad8] suggesting the potential for long-term effects. Thus, clinicians are reluctant to employ QDs in humans. This problem has been addressed in recent years by the introduction of “green” QDs composed of alternate materials,[Reference Grim, Manna and Moreels9] such as Mn-doped ZnSe[Reference Pradhan and Peng10] that eliminate Cd metal from the nanocrystal. Some of these are even commercially available. However, despite these improvements, QDs remain niche products, primarily used for experiments requiring high numbers of multiplexed imaging targets or specific emission wavelengths.
Other possible limitations to QD use in biologic imaging are anecdotal reports of poor optical properties. Although QDs have shown increased resistance to photobleaching compared with molecular dyes,[Reference Chan and Nie2,Reference Dubertret, Skourides, Norris, Noireaux, Brivanlou and Libchaber5] several researchers have observed QD fluorescence loss throughout the bioconjugation process.[Reference Banerjee, Grazon, Nadal, Pons, Krishnan and Dubertret11,Reference Aldana, Wang and Peng12] In particular, losses in fluorescence resulting from dilution, dissolution in biologic buffers (particularly containing salts), and following purification procedures, such as centrifugal filtration or dialysis, have been observed. However, a comprehensive analysis has not yet been performed. Further, the mechanisms of QD failure are uncertain. QDs can undergo surface oxidation resulting in the release of free Cd2+ and generating fluorescence quenching defects at the nanocrystal surface.[Reference van Sark, Frederix, Bol, Gerritsen and Meijerink3] However, QDs exposed to high salt concentrations can also undergo aggregation as a result of reduced Debye charge screening of the ionic ligands on their surfaces.[Reference Zhang, Chen, Westerhoff and Crittenden13] Further, recent reports for organic phase QDs,[Reference Anderson, Hendricks, Choi and Owen14] suggest that ligand equilibrium dynamics play a strong role in fluorescence loss mechanisms.
Here, we investigated fluorescence loss resulting from QD bioconjugation processes. The most commonly employed QDs for biologic applications are composed of CdSe/ZnS coated with organic compounds (e.g., polymers) to promote solubility in aqueous media.[Reference Medintz, Uyeda, Goldman and Mattoussi15] Further, these QDs are often modified with antibodies or other biomolecules to permit targeting to specific biomarkers, typically via 1-Ethyl-3-(3-(dimethylamino)propyl)carbodiimide (EDC)-mediated bioconjugation to –COOH groups on their surfaces.[Reference Hermanson16] Therefore, we examined aqueous, CdSe/ZnS QDs functionalized with carboxylic acid terminal groups (-COOH) from four vendors.
In a typical preparation for biologic imaging,[Reference Hermanson17] QDs received from the manufacturer are first transferred into a conjugation buffer. Common buffers employed include borate and 2-(N-morpholino)ethanesulfonic acid (MES) buffer. Transfer can be via simple dilution, especially if a small volume of QDs is diluted into a much larger buffer phase, or via exchange, typically using centrifugal filtration and re-suspension. Then, conjugation chemicals and conjugate are added and incubated for a specified period of time. Following incubation, some preparations require neutralization by addition of an excess of a compound that reacts with the conjugation chemicals. The final product is then purified, usually by centrifugal filtration, dialysis, or gel filtration.
In this work, we evaluated aggregation and fluorescence quantum yield (QY) reduction during the initial steps of the bioconjugation process, specifically, dilution in the original buffer used by the manufacturer, purification via centrifugal filtration, and dissolution in buffers commonly employed for bioconjugation.
Aggregation was evaluated by measuring changes in the fluorescence of the supernatant following centrifugation cycles, whereas QY was evaluated using fluorometry. Thus, for each sample, we evaluated fluorescence loss attributed to reduced concentration, reductions in QY, and material loss to aggregation. The majority of studies employed red QDs (λ em = 600–630 nm) for consistency; however, some green QDs (λ em = 545 nm) were also evaluated to identify differences across emission wavelengths. In some cases, multiple lots were examined to evaluate lot-to-lot variation. These data provide important guidance on optimization strategies for QD bioconjugation and labeling protocols.
Materials and methods
Materials
To avoid potential conflicts of interest, the vendors used in this study are not disclosed. Red CdSe/ZnS core-shell QDs (600 nm < λ em < 630 nm) functionalized with carboxylic acid were purchased from four vendors. Green QDs (λ em = 545 nm) were purchased from one of these vendors. All QDs employed were shipped and stored in aqueous media, either pH 9, 50 mM borate buffer or pure water. Amicon ultra 0.5 mL centrifugal filters (cat. No. UFC505024, 100 kDa) were purchased from MilliPoreSigma. MES Buffered Saline Packs (cat. No. 28390) and BupH™ Borate Buffer Packs (cat No. 28384) were purchased from ThermoFisher Scientific. Rhodamine 6G (cat. No. 252433) was purchased from Sigma-Aldrich (St. Louis, MO, USA).
UV-visible absorbance spectroscopy
UV-visible absorbance spectroscopy was used to estimate concentrations (against standard curves) of reference dye and QD solutions for QY calculations. Absorbance spectra were obtained using a Genesys 6 UV-Vis spectrophotometer. Background subtraction was performed by scanning an equal volume (400 µL) of fresh solvent inside a Hellma absorption cuvette (path length 10 mm).
Fluorescence excitation and emission spectroscopy
Fluorescence spectroscopy was performed to obtain the fluorescence emission and excitation spectra of reference dye and QD solutions. For both excitation and emission measurements, 80 µL of sample solution was analyzed using a sub-micro quartz cuvette. Fluorescence spectra were obtained with a PTI QuantaMaster™ 40 steady-state spectrofluorometer (lamp power: 75 W, detector voltage: 1100 V). Emission spectra were collected using an excitation wavelength of 488 nm unless otherwise specified.
QY calculations
To evaluate fluorescence loss resulting from altered QD material properties, QY was calculated via comparison to a rhodamine 6G reference dye, which has an expected QY of 95% in ethanol.[Reference Kubin and Fletcher18] Rhodamine 6G in ethanol was chosen because its excitation wavelength (488 nm) does not interfere with the range of emission wavelengths for the QDs tested (500–700 nm). Fluorescence emission spectra for QDs were obtained by excitation at the first excitonic peak, λ ex , resulting in maximal emission or at 488 nm, as specified below. The latter excitation wavelength was employed to collect a full emission spectrum without bleed through of excitation light. From the collected spectra, QD QY was calculated using Eq. (1).[Reference Velapoldi19]
 $${\rm Q}{\rm Y}_{{\rm QD}} = {\rm Q}{\rm Y}_{{\rm ref}}\displaystyle{{I_{{\rm QD}}} \over {I_{{\rm ref}}}}\; \displaystyle{{\lambda _{{\rm ex\; ref}}} \over {\lambda _{{\rm ex\; QD}}}}\; \displaystyle{{A_{{\rm ref}}} \over {A_{{\rm QD}}}}\; \displaystyle{{\eta _{{\rm QD}}^2} \over {\eta _{{\rm ref}}^2}} $$
where QYQD is the measured QY of the QDs, QYref is the QY of the reference dye (i.e. 0.95 for Rhodamine 6G), I QD and I ref are the integrated fluorescence intensities (for QDs and a reference, respectively) calculated by the area under the curve obtained using the spectrofluorometer, λ ex QD and λ ex ref (for QDs and a reference, respectively) are the excitation wavelengths used to obtain the emission spectra, A QD and A ref (for QDs and a reference, respectively) are the absorbances obtained using UV-Vis spectrophotometry at the excitation wavelengths, and η QD and η ref are the refractive indices for the solvent containing QDs and the reference, respectively. For excitation at the first peak of the excitation spectra, where bleed through into the emission spectra occurs, I QD was obtained by measuring half of the emission curve from the maximum peak and multiplying the measured area under the curve by 2. For QDs excited at 488 nm, I QD was obtained by calculating the area under the full emission curve.
Aggregation
Fluorescence losses resulting from particle aggregation in solution were identified by centrifugation. When QDs aggregate, they form large clusters that precipitate easily. Thus, QDs in a 1.5 mL test tube were subjected to centrifugation at low speed (4000 rpm) for 1 min. The fluorescence of the supernatant was measured to determine the amount of fluorescence lost to pellet formation, indicating the extent of aggregation.
Evaluating the effect of dilution in original solvent
QDs from four vendors were shipped at different concentrations in different solvents. Thus, to evaluate the effect of dilution, QDs were diluted across a range of concentrations using the original solvent, either Milli-Q water or pH 9, 50 mM borate buffer. The original concentrations from all vendors were too high to obtain absorbance and/or fluorescence spectra without saturating detectors. Thus, initially, QY was evaluated for QDs diluted in their original solvents to absorbance values between 0.01 and 0.1 at the longest wavelength absorption maxima, which was sufficient to prevent saturation of UV-Vis and fluorescence detectors.[Reference Wu, Campos, Lopez, Ozbun, Sklar and Buranda20] Then, further dilution using the original solvents for each sample was performed across a range of concentrations corresponding to an absorbance range of 0.01 to 0.1. QY values were compared to those at the original dilution using the student t-test. All samples were prepared and analyzed at N ≥ 3.
Evaluating the effect of purification via centrifugal filtration
To evaluate the effect of purification methods, specifically centrifugal filtration, on QD fluorescence loss, QD fluorescence was evaluated before and after purification via this method. Filtration was conducted by washing 400 µL of QD solution diluted with the original solvent (i.e. water, pH 9, 50 mM borate buffer) to the highest concentration tested in the dilution study using Amicon ultra 0.5 mL centrifugal filter devices at 12,000 rcf for 3 min. Then, concentrated QDs were immediately resuspended to the original volume of 400 µL in the original solvent. Filtration was repeated up to 3 times, and QY was measured after each repeat. QY values were then compared to those before filtration using the student t-test. All samples were prepared and analyzed at N ≥ 3.
Effect of buffer exchange
Centrifugal filtration was also used for buffer exchange studies. QDs were processed as above, except, after removing the original solvent, QDs were washed with MilliQ water before dispersion into a new buffer. For QDs shipped in water, QDs were resuspended in new buffer after only one washing cycle. For QDs shipped in other solvents, three washing cycles were performed prior to dispersion into the new buffer. Buffers tested included pH 4.7, 0.1 M MES buffer and pH 9, 50 mM borate buffer because they are commonly used in bioconjugation procedures. In addition, pH 7.3, 50 mM borate buffer was tested to examine the effect of buffer ionic strength on QD stability. QY values were then compared to those before buffer exchange using the Student's t-test. All samples were prepared and analyzed at N ≥ 3.
Results and discussion
Initial QY calculations
QDs received from vendors were highly concentrated. Thus, samples were diluted to avoid saturation of detectors for initial measurements. QY was then determined at this initial concentration using excitation wavelengths corresponding to the first excitation peak and also at 488 nm (to prevent excitation bleed through in the emission spectrum) [Fig. S1(a) (summary) and Fig. S1(b) (full spectra)].
Measured QYs ranged from ~ 60% or 40% for green and red QDs, respectively, to as little as ~5% (red QDs). All vendors provided expected QY values for their QDs, although the methods of measurement were not indicated. QY values measured by our methods, following dilution and compared to a known reference, were substantially lower than reported values in all but two cases (Red, vendors #2 and 3). This may result from the methodology employed (i.e., QY measurement against a reference versus use of the integrating spheres[Reference Gaigalas and Wang21]), which prevented evaluation at the as shipped concentration. QYs of >50% are generally desired for imaging applications.[Reference Thomas22] Nonetheless, QDs with QY <10% have been successfully employed for cell labeling,[Reference Winter, Liu, Korgel and Schmidt23] suggesting that even products with low QY may still result in successful imaging results. We also observed only slight differences in QY values regardless of the excitation energy employed (i.e., first excitation peak versus 488 nm), with the largest difference observed for Vendor #1 Red. Thus, we do not believe that excitation wavelength contributes to this discrepancy between measured and reported values. In subsequent experiments, an excitation wavelength of 488 nm was employed to permit the full emission spectra to be collected without excitation bleed through.
Effect of dilution with original solvent
Most bioconjugation and labeling protocols require dilution of QD stock solutions before use. QD stability is critically linked to the local environment, and in particular, the ionic strength of the media.[Reference Pfeiffer, Rehbock, Hühn, Carrillo-Carrion, de Aberasturi, Merk, Barcikowski and Parak24] The presence of proteins and other additives in cell culture medium and serum can further alter this response.[Reference Moore, Rodriguez-Lorenzo, Hirsch, Balog, Urban, Jud, Rothen-Rutishauser, Lattuada and Petri-Fink25] Thus, we evaluated the influence of dilution on QD fluorescence losses resulting from aggregation and reduced QY. To decouple fluorescence QY losses resulting solely from dilution from those resulting from buffer incompatibility, we first evaluated QD fluorescence loss upon dilution with the original aqueous solvent in which QDs were shipped and stored. QDs were diluted across a range of concentrations consistent with absorbance values between 0.01 and 0.1 at the longest wavelength absorption maxima, with maximal concentration values corresponding to those used in Fig. S1 (Figs. 1 and S2).
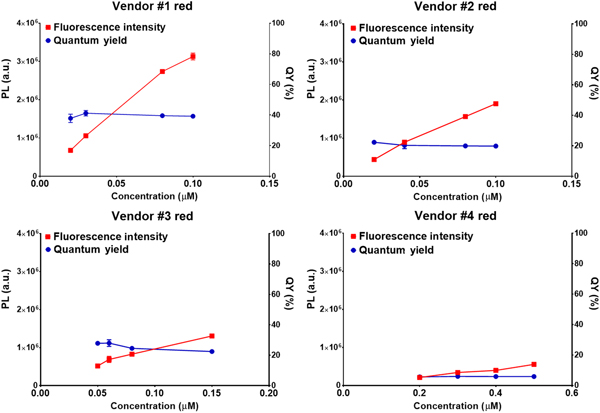
Photoluminescence intensity (PL) and QY of red QDs from four vendors as a function of concentration. Fluorescence intensity is concentration dependent and thus is expected to decline with dilution, whereas QY is not.

Fluorescence intensity, which is correlated to the total number of photons emitted, is concentration dependent, and thus should decline with dilution. However, QY, which reflects the number of photons emitted over those absorbed, is concentration independent, provided that QDs are not affected by the local aqueous environment. As expected, fluorescence intensity for all vendors declined with dilution (Fig. 1). Also, for QY, no statistical difference (α = 0.05) was observed across the samples and dilutions investigated; suggesting that the borate buffer and water in which products were shipped did not influence QD surfaces and their photoluminescence emission sites. Further, no aggregation was observed, suggesting colloidal stability in these original aqueous solutions.
To enhance the rigor of our analysis, we repeated these experiments with a second lot of material. Unfortunately, only one vendor (Vendor #1) had multiple lots available for purchase, thus our analysis was limited to products from Vendor #1 (Fig. S2). The expected QY reported by the manufacturer for Lot 2 was higher than that of Lot 1 by 6%. However, the measured QYs for these two lots were not statistically different (α = 0.05) across the range of concentrations investigated. Thus, the second lot displayed a slightly greater difference from the manufacturer's reported QY. No aggregation was observed in these studies. Therefore, in this limited evaluation, we did not observe substantial lot-to-lot variability, although further investigation of many lots from each of the vendors would be required to conclusively evaluate this variable.
Next, we evaluated the influence of emission wavelength on fluorescence loss. CdSe/ZnS QD fluorescence derives in part from the nanocrystal surface,[Reference Alivisatos26] which is much less stable than the interior of the nanocrystal. Thus, smaller QDs (emitting toward the blue end of the spectrum), which have a higher surface to volume ratios, are expected to exhibit a greater propensity for QY loss as a result of surface defects than larger QDs (toward the red end of the spectrum). Therefore, we evaluated fluorescence loss upon dilution for green-emitting carboxylate-functionalized CdSe/ZnS QDs (λ em = 545 nm) from Vendor #1. For these materials, the manufacturer's reported QY was lower than that of red QDs (Lot 1) by 25%, but the measured QY was higher than that of red QDs [Fig. S2(B) versus Fig. S1(A)]. Consistent with our previous results, QY measured after dilution was lower than the manufacturer's reported value. Although the difference between the manufacturer's reported QY and the measured QY after dilution was lower than that observed for red QDs, green QDs showed a larger standard deviation in QY values. This could potentially result from the larger surface to volume ratio of green QDs, reducing stability. However, no aggregation was observed across these experimental conditions, suggesting colloidal stability was maintained.
Effect of centrifugal filtration
Most bioconjugation protocols require concentration and purification steps,[Reference Hermanson17] and for QDs, centrifugal filtration devices are often used for these purposes. Purification can result in reduced fluorescence intensity, in part from the loss of sample in the filter, but also from increased solution ionic strength, which lowers colloidal stability.[Reference Pfeiffer, Rehbock, Hühn, Carrillo-Carrion, de Aberasturi, Merk, Barcikowski and Parak24] Thus, we investigated fluorescence losses resulting from centrifugal filtration and up to three washing steps. For these experiments, samples were investigated at the highest concentration tested in the dilution study and were washed with the aqueous media in which they were shipped and stored. Because of possible material losses during filtration (i.e., entrapment in the filter), absorbance for QY calculations was determined at the beginning of each filtration cycle. Thus, the reported values are concentration-corrected.
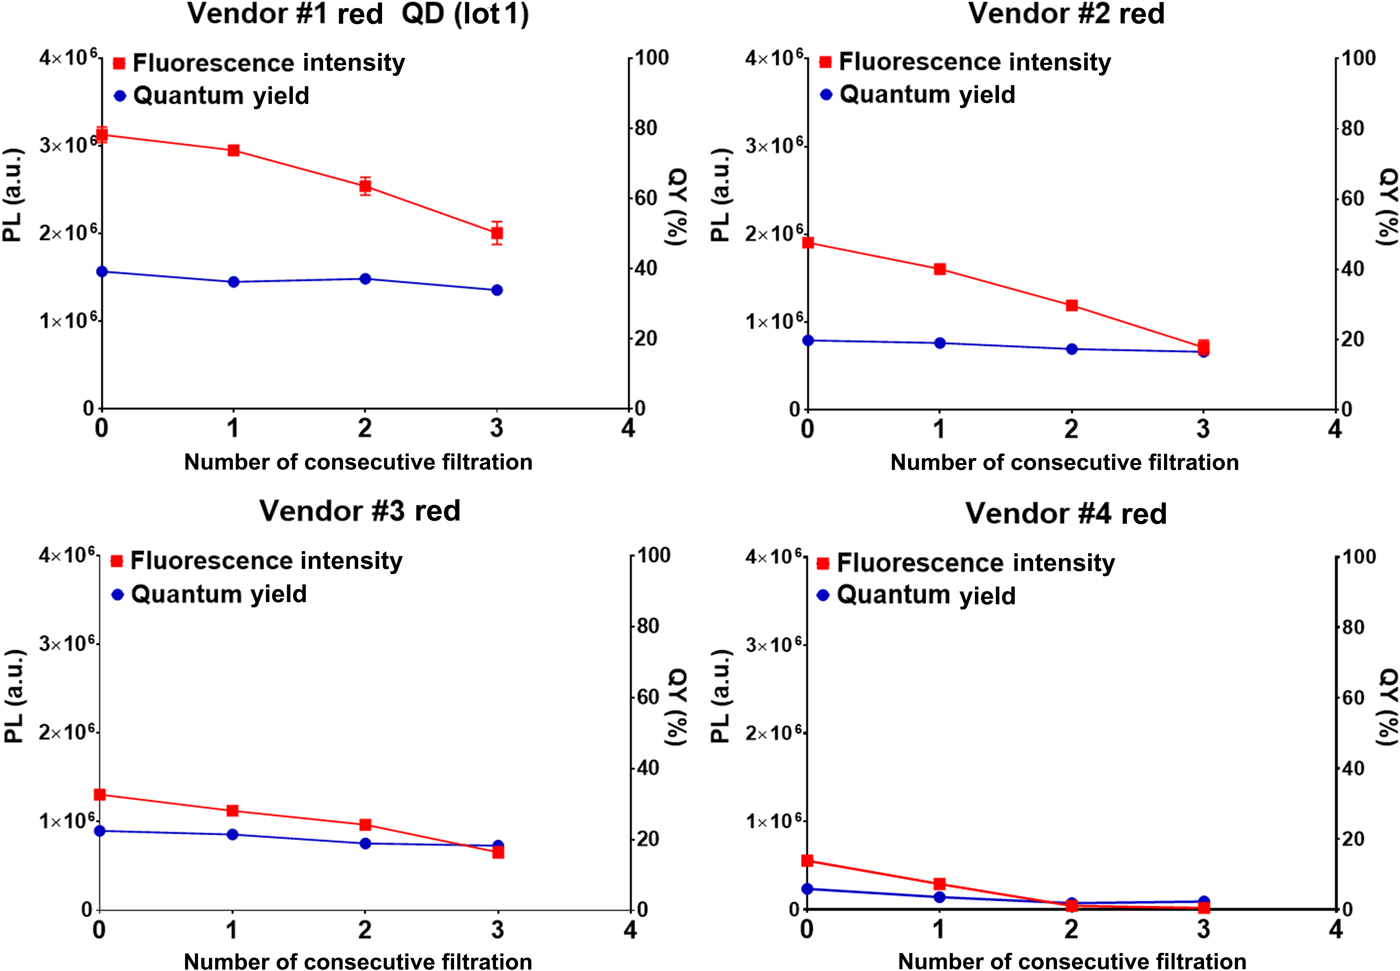
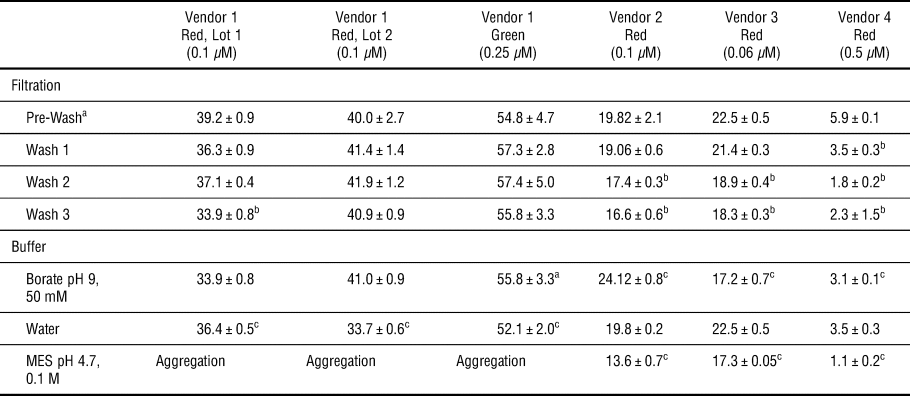
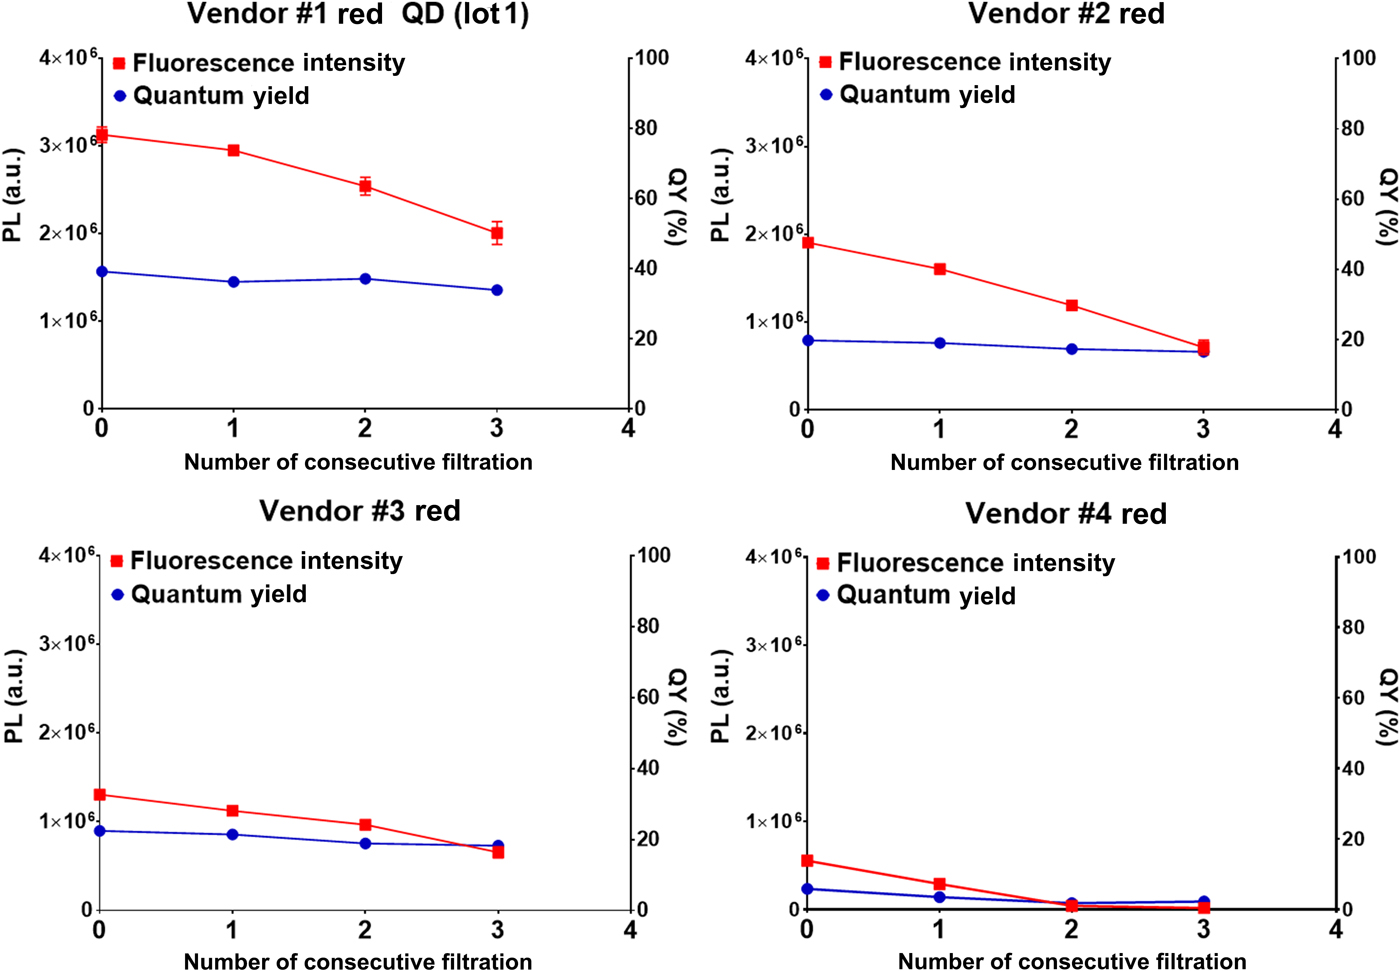
All samples experienced reductions in total fluorescence intensity (Figs. 2 and S3), in some cases by as much as 96% (Vendor 4), which could result from either loss in the filter or reduction in QY. Specific investigation of QY indicated modest declines (Table I), suggesting that much of the reduction in fluorescence intensity reflects material loss on the filter. Sample QY was generally stable against a single filtration cycle; however, samples from Vendors 2 to 4 displayed statistically significant reductions in QY with increasing numbers of washes. QDs from Vendor 1 displayed mixed results, although they were more resistant to QY reduction than all competing vendors. QDs from Red Lot #1 demonstrated a statistically significant reduction in QY after three washes, whereas as Red Lot #2 and the Green Lot did not demonstrate reduced QY across the three washes performed. For green QDs; however, sample-to-sample variation, reflected by their relatively larger standard deviations, was consistently observed (Table I). This is consistent with the larger variations observed in our dilution study as well. However, conclusive results would require a larger study with multiple lots from each vendor. As in our previous studies, aggregation was not observed across all experiment conditions, suggesting colloidal stability in original aqueous media was not affected by centrifugation or filtration steps.
Photoluminescence (PL) intensity and QY of red QDs from four vendors (fixed concentration) after centrifugal filtration repeated up to 3 times.
QY of QDs following centrifugal filtration and in different buffers.

a As reported in Figs. 1 and S2.
b Indicates statistical difference (α = 0.05) from pre-wash values.
c Indicates statistical difference (α = 0.05) between QY before and after buffer exchange.
Because QY values are concentration corrected, these losses cannot be attributed to product loss during washing. Thus, the most likely cause for reduced QY during centrifugal filtration is the loss of surface ligand, which is a well-documented problem during solution exchanges.[Reference Aldana, Wang and Peng12] However, QY reductions were not observed with sample dilution, which would have been expected if ligand loss were driven by equilibrium reactions alone. We hypothesize that ligand loss could occur during centrifugal filtration, but not dilution, because of the additional shear forces applied during this process. This hypothesis could be further confirmed by quantitative NMR experiments to examine ligands on the QD surface.[Reference Wang, Tang and Buhro27] An alternative possible cause of reduced QY is surface oxidation,[Reference van Sark, Frederix, Van den Heuvel, Gerritsen, Bol, van Lingen, de Mello Donegá and Meijerink28] which could be evaluated using x-ray photoelectron spectroscopy or cathodoluminescence.[Reference RodriguezViejo, Jensen, Mattoussi, Michel, Dabbousi and Bawendi29] It is notable; however, that the surface changes that resulted in reduced QY did not result in reduced colloidal stability as no aggregation was observed throughout the study. These data suggest that filtration steps should be limited in number to reduce QY losses throughout the purification process.
Effect of buffer exchange
Bioconjugation protocols are typically performed in buffers such as MES,[Reference Hermanson17] although some QD vendors recommend borate buffer. Biologic buffers inherently present solutions with different pH and ionic strength than water, and as such could affect colloidal stability.[Reference Pfeiffer, Rehbock, Hühn, Carrillo-Carrion, de Aberasturi, Merk, Barcikowski and Parak24] Thus, we examined the effect of QD dissolution in water; pH 9, 50 mM borate buffer (i.e., recommended by one vendor for bioconjugation); and pH 4.7, 0.1 M MES buffer (consistent with common bioconjugation protocols[Reference Hermanson17]) to examine the effect of dispersing QDs in solvents with different pH and ionic strengths. Buffer exchange was performed using centrifugal filtration to reduce the volume of the original solvent, followed by dispersion in the new solvent. Three washes in the new solvent were performed before measurement to ensure removal of residual solvent. QD concentrations employed were consistent with those used in the centrifugal filtration study.
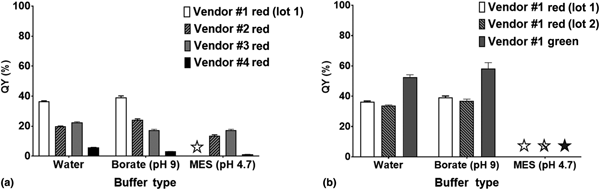
Products generally displayed highest QYs in the buffers in which they were supplied (i.e., either water or borate buffer) (Fig. 3 and Table I). Thus, there were no trends across all four vendors indicating an ideal buffer that maximized QY for all products. However, dissolution in MES buffer, recommended in many bioconjugation protocols, yielded decreased stability or statistically significant declines in QY for all products tested. QDs from Vendor 1, regardless of lot number or color, aggregated instantaneously in MES buffer (Fig. S4). QDs from vendors 2 and 4 did not demonstrate visible aggregation, but fluorescence emission peaks were red-shifted, suggesting aggregation. QYs for QDs from these two vendors were also reduced, although by levels roughly consistent with those observed in response to centrifugal filtration (three washes), suggesting that these QY losses most likely result from centrifugal filtration processes and not buffer incompatibility. QDs from Vendor 3 did not present observable aggregation or red-shifted emission peaks; however, there was a slight, statistically significant decline in QY compared to that in other buffers. This decline was consistent with that observed during centrifugal filtration studies, and most likely can be attributed to purification rather than buffer incompatibility. To evaluate the effect of pH, in a more limited set of samples, we examined QD compatibility with pH 7.4, 50 mM borate buffer, which was recommended by one of the vendors as a conjugation buffer (Fig. S5). QD samples from Vendor 1 (Lot 2) and Vendor 2 were stable in pH 7.4 borate buffer, consistent with prior results using pH 9, 50 mM borate, and did not demonstrate statistically significant differences in QY from measurements conducted in their original buffers.
QY of (a) red QDs from four vendors in different buffers and (b) from vendor 1: red QDs, lots 1 and 2 and green QDs. Star indicates that significant aggregation was observed, precluding measurement of QY.

Colloidal stability is typically inversely proportional to ionic strength, with increasing ionic strength yielding greater Debye screening and therefore reduced colloidal particle stability.[Reference Pfeiffer, Rehbock, Hühn, Carrillo-Carrion, de Aberasturi, Merk, Barcikowski and Parak24] However, the buffers used in this study had ionic strengths of 4.7 mM and 104.1 mM for MES and pH 9 borate buffers, respectively. Thus, QDs in borate buffer would be expected to demonstrate the least colloidal stability, which is contradictory to our findings. These results indicate that buffer incompatibility, separate from that attributed to ionic strength, can induce aggregation of commercial QD products (Vendors 1, 2, and 4 in MES buffer), and should be carefully considered when designing QD conjugation protocols.
Conclusion
This study evaluated the colloidal stability and QY of –COOH terminated CdSe/ZnS QDs from four commercial vendors. These materials were chosen because they are the most common QDs employed in biologic imaging studies. Three processes required in bioconjugation protocols were examined: dilution in the manufacturer's original buffer, purification via centrifugal filtration, and dilution in biologic buffers employed in bioconjugation protocols. Across the range of concentrations investigated, all products investigated demonstrated unchanged QY and no aggregation upon dilution in the solvent in which they were shipped. Further, although limited investigation was performed, no lot to lot variation was observed. However, the measured QYs for nearly all vendors were lower than those reported by the manufacturers. This may result from the method of measurement. The most significant declines in QY were observed in response to centrifugal filtration, with declines increasing as a function of increasing number of wash cycles. The most significant declines in colloidal stability were observed in MES buffer. These data suggest caution in developing bioconjugation protocols, which should employ the minimum number of purification and washing cycles. Further, in this limited study, ionic strength was not a predictor of QD stability in a given buffer. Thus, care should be taken to evaluate stability experimentally when developing a new protocol. These results provide some of the first systematic investigation of stability and QY for commercial QD products during preparation steps for biologic use.
Supplementary material
The supplementary material for this article can be found at https://doi.org/10.1557/mrc.2019.41
Acknowledgments
The authors acknowledge support from the National Science Foundation DBI-1555470.
Conflict of interest statement
In accordance with ethical obligation as a researcher, JOW reports that she has financial and business interests in a company (i.e., Core Quantum Technologies) that may be affected by the research reported in the enclosed paper. JOW has disclosed those interests fully to the publishers, and has in place an approved plan for managing any potential conflicts arising from that involvement. This work was not funded by Core Quantum Technologies and the opinions represented are those of the authors.