1. Introduction
It has been recognized that aeolian dust input to the ocean can impact the global climate by regulating oceanic biogeochemical cycles (Martin, Reference Martin1990; Jickells et al. Reference Jickells, An, Andersen, Baker, Bergametti, Brooks, Cao, Boyd, Duce and Hunter2005; Martínez-Garcia et al. Reference Martínez-Garcia, Rosell-Melé, Jaccard, Geibert, Sigman and Haug2011). At present, the global estimate of annual dust emissions to the atmosphere is c. 2000 Mt, 25 % of which is transported to the ocean (Shao et al. Reference Shao, Wyrwoll, Chappell, Huang, Lin, McTainsh, Mikami, Tanaka, Wang and Yoon2011). Such aeolian dust inputs to the ocean supply large amounts of macronutrients (N, P and Si) and micronutrients (e.g. Fe, Mn, Ni, Zn, Cu, Co and Cd) that are essential for phytoplankton growth (Duce & Tindale, Reference Duce and Tindale1991; Mahowald et al. Reference Mahowald, Jickells, Baker, Artaxo, Benitez-Nelson, Bergametti, Bond, Chen, Cohen, Herut, Kubilay, Losno, Luo, Maenhaut, McGee, Okin, Siefert and Tsukuda2008; Bristow et al. Reference Bristow, Hudson-Edwards and Chappell2010; Jickells et al. Reference Jickells, Baker and Chance2016). In the Southern Ocean and equatorial Pacific Ocean, the strong links between aeolian Fe input flux and biogenic response through glacial–interglacial cycles indicate the facilitation of the oceanic primary productivity by aeolian dust input (Martínez-García et al. Reference Martínez-García, Rosell-Melé, Geibert, Gersonde, Masqué, Gaspari and Barbante2009, Reference Martínez-García, Sigman, Ren, Anderson, Straub, Hodell, Jaccard, Eglinton and Haug2014; Murray et al. Reference Murray, Leinen and Knowlton2012). Furthermore, iron addition experiments in high-nutrient – low-chlorophyll regions, natural fertilization studies, as well as modern atmospheric and marine observations, have demonstrated that iron fertilization could substantially promote oceanic primary productivity (Coale et al. Reference Coale, Johnson, Fitzwater, Gordon, Tanner, Chavez, Ferioli, Sakamoto, Rogers and Millero1996; Boyd et al. Reference Boyd, Watson, Law, Abraham, Trull, Murdoch, Bakker, Bowie, Buesseler, Chang, Charette, Croot, Downing, Frew, Gall, Hadfield, Hall, Harvey, Jameson, LaRoche, Liddicoat, Ling, Maldonado, McKay, Nodder, Pickmere, Pridmore, Rintoul, Safi, Sutton, Strzepek, Tanneberger, Turner, Waite and Zeldis2000; Blain et al. Reference Blain, Quéguiner, Armand, Belviso, Bombled, Bopp, Bowie, Brunet, Brussaard and Carlotti2007; Pollard et al. Reference Pollard, Sanders, Lucas and Statham2007; Han et al. Reference Han, Zhao, Song, Fang, Yin, Deng, Wang and Fan2011). Collectively, strong links between aeolian Fe fluxes to the ocean and surface primary productivity have already been discovered from glacial–interglacial to interdiurnal scales in the Southern Ocean and Pacific Ocean (Han et al. Reference Han, Zhao, Song, Fang, Yin, Deng, Wang and Fan2011; Murray et al. Reference Murray, Leinen and Knowlton2012; Martínez-García et al. Reference Martínez-García, Sigman, Ren, Anderson, Straub, Hodell, Jaccard, Eglinton and Haug2014). However, little is known about how ocean primary productivity would respond to longer-term changes in aeolian dust supply in the western North Pacific.
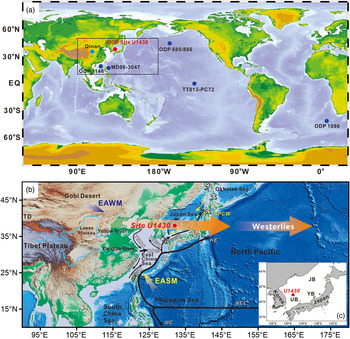
As the second largest dust source on the Earth, the arid and semi-arid areas in Central Asia supply about 70 Mt dust for the North Pacific Ocean every year, through the westerlies and the East Asian winter monsoon (Shao et al. Reference Shao, Wyrwoll, Chappell, Huang, Lin, McTainsh, Mikami, Tanaka, Wang and Yoon2011). Aeolian dust input is an important factor controlling primary producers and surface primary productivity in the North Pacific, which can greatly promote the efficiency of the oceanic biological pump (Buesseler et al. Reference Buesseler, Lamborg, Boyd, Lam, Trull, Bidigare, Bishop, Casciotti, Dehairs, Elskens, Honda, Karl, Siegel, Silver, Steinberg, Valdes, Mooy and Wilson2007; Han et al. Reference Han, Zhao, Song, Fang, Yin, Deng, Wang and Fan2011). Likewise, the Japan Sea is a major sink of Asian dust due to its location between the Asian dust source area and the North Pacific (Fig. 1). It has been unequivocally demonstrated that detrital components of sediments in the Japan Sea were mainly controlled by aeolian dust derived from Central Asia since the middle Miocene (Irino & Tada, Reference Irino and Tada2002; Otosaka et al. Reference Otosaka, Togawa, Baba, Karasev, Volkov, Omata and Noriki2004; Nagashima et al. Reference Nagashima, Tada, Matsui, Irino, Tani and Toyoda2007; Shen et al. Reference Shen, Wan, France-Lanord, Clift, Tada, Révillon, Shi, Zhao, Liu, Yin, Song and Li2017). Organic-rich laminated intervals were widely developed in the deep sea in the middle–late Miocene and since the late Pliocene (Tada et al. Reference Tada, Murray, Alvarez Zarikian, Anderson, Bassetti, Brace, Clemens, da Costa Gurgel, Dickens, Dunlea, Gallagher, Giosan, Henderson, Holbourn, Ikehara, Irino, Itaki, Karasuda, Kinsley, Kubota, Lee, Lee, Lof, Lopes, Peterson, Saavedra-Pellitero, Sagawa, Singh, Sugisaki, Toucanne, Wan, Xuan, Zheng and Ziegler2015). Asian dust input may have significant influences on marine deposition and biogeochemical cycles in the Japan Sea. Until now, the preliminary works mainly focused on the late Quaternary, when the southern Tsushima Strait was open (Fig. 1b), and the Tsushima Warm Current (TSWC) has been adopted as the crucial controller in regulating primary productivity of the Japan Sea (Tada et al. Reference Tada, Irino and Koizumi1999; Lim et al. Reference Lim, Xu, Choi, Kim, Kim, Kang and Jung2011; Yao et al. Reference Yao, Liu, Shi and Suk2012; Zou et al. Reference Zou, Shi, Liu, Liu, Selvaraj and Kao2012). However, the palaeoceanographic setting, sediment supply and biogeochemical cycle in the Japan Sea before the Pleistocene when the Tsushima Strait was not open were very different from the present conditions (Tada, Reference Tada1994; Itaki, Reference Itaki2016). During that period, aeolian dust from Central Asia was suggested to be the major sediment source to the Japan Sea (Shen et al. Reference Shen, Wan, France-Lanord, Clift, Tada, Révillon, Shi, Zhao, Liu, Yin, Song and Li2017). The role of long-term Asian dust input in the evolution of primary productivity and export production of the Japan Sea before the opening of Tsushima Strait remains unclear.
(a) Locations of the Japan Sea in the global ocean and the typical sites referenced in this study (ODP Site 885/886 from Rea et al. (Reference Rea, Snoeckx and Joseph1998); ODP Site 1146 from Wan et al. (Reference Wan, Li, Clift and Stuut2007); MD06-3047 from Xu et al. (Reference Xu, Li, Clift, Lim, Wan, Chen, Tang, Jiang and Xiong2015); TT013-PC72 from Murray et al. (Reference Murray, Leinen and Knowlton2012); ODP Site 1090 from Martínez-García et al. (Reference Martínez-García, Sigman, Ren, Anderson, Straub, Hodell, Jaccard, Eglinton and Haug2014); and loess deposition at Qinan in the Chinese Loess Plateau from Guo et al. (Reference Guo, Ruddiman, Hao, Wu, Qiao, Zhu, Peng, Wei, Yuan and Liu2002)). The black box indicates part of the Asian continent and western North Pacific. (b) Location of the study site (IODP Site U1430) and the local and surrounding oceanographic setting of the Japan Sea. Also shown are the distributions of the Loess Plateau, the Tibet Plateau and the major deserts including the Gobi Desert and Taklimakan Desert. The East Asian summer monsoon (EASM), East Asian winter monsoon (EAWM) and westerlies are shown by yellow, blue and orange arrows, respectively. Modern surface ocean currents along the western margin of the North Pacific Ocean are shown with white arrows. The yellow dashed arrows indicate the intrusion of North Pacific cold water into the Japan Sea through the northern straits before the Pleistocene (Itaki, Reference Itaki2016). (c) Location of the Japan Sea. NEC: North Equatorial Current; MC: Mindanao Current; KC: Kuroshio Current; KE: Kuroshio Extension; TWC: Taiwan Warm Current; TSWC: Tsushima Warm Current; ZMCC: Zhe-Min Coastal Current; YSCC: Yellow Sea Coastal Current; CDW: Changjiang Diluted Water; YSWC: Yellow Sea Warm Current; NPCW: North Pacific Cold Water; JB: Japan Basin; YB: Yamato Basin; UB: Ulleung Basin; MS: Mamiya Strait; SS: Soya Strait; TSS: Tsushima Strait; TGS: Tsugaru strait; TD: Taklimakan Desert.

In this study, we present a comprehensive analysis of multiple geochemical proxies on sediments from Integrated Ocean Drilling Program (IODP) Site U1430 in the southern Japan Sea since 4 Ma, in order to (1) reconstruct the evolution of palaeoproductivity in the Japan Sea since 4 Ma; and (2) assess the potential influences of long-term Asian dust input on oceanic primary productivity, and its links to atmospheric CO2 concentration.
2. Geological setting of the Japan Sea
The Japan Sea is a semi-enclosed marginal basin located along the eastern margin of the Eurasian continent and NW of the Pacific plates. It has an average depth of 1350 m and a maximum depth of ∼3700 m. The Japan Sea is composed of three major basins, the Japan Basin, the Yamato Basin and the Ulleung Basin (Fig. 1c), which were developed in response to continental rifting and seafloor spreading between the early Oligocene (∼32 Ma) and middle Miocene (∼15 Ma) (Tamaki et al. Reference Tamaki, Suehiro, Allan, Ingle and Pisciotto1992). The Japan Sea is connected to its neighbouring seas only through four shallow and narrow straits: the East China Sea through the Tsushima Strait (sill depth at ∼130 m), the Okhotsk Sea through the Mamiya Strait (∼18 m) and Soya Strait (∼55 m), and the western North Pacific through the Tsugaru Strait (∼130 m).
At present, the TSWC, a branch of the Kuroshio Current, is the only current flowing into the Japan Sea through the Tsushima Strait (Fig. 1b). However, the palaeoceanographic conditions of the Japan Sea have changed dramatically since the Miocene (Tada, Reference Tada1994). The Japan Sea was dominantly influenced by the cold North Pacific water via the northern straits during the middle Miocene to late Pliocene (Tada, Reference Tada1994; Itaki, Reference Itaki2016; Kozaka et al. Reference Kozaka, Horikawa, Asahara, Amakawa and Okazaki2018; Matsuzaki et al. Reference Matsuzaki, Itaki, Tada and Kamikuri2018). Notably, the significant intrusion of the TSWC via the Tsushima Strait began at ∼1.7 Ma, which was likely related to the second stretching of the Okinawa Trough since ∼2 Ma (Shinjo, Reference Shinjo1999; Gungor et al. Reference Gungor, Lee, Kim, Han, Kang, Kim and Sunwoo2012; Gallagher et al. Reference Gallagher, Kitamura, Iryu, Itaki, Koizumi and Hoiles2015; Itaki, Reference Itaki2016).
3. Material and methods
3.a. Core descriptions
IODP Site U1430 (37° 54.16′ N, 131° 32.25′ E, 1072 m water depth) is situated on the southern upper slope of the eastern South Korea Plateau, bounding the northern margin of the Ulleung Basin in the SW Japan Sea. Three holes were cored at Site U1430 to a composite depth of 275 m. For this study, we focused on the strata since 4 Ma, and a total of 94 samples were obtained for geochemical analyses. The lithology of the study core is dominated by clayey silt, silty clay, nannofossil ooze, and diatom ooze with a small amount of volcanic glass (Tada et al. Reference Tada, Murray, Alvarez Zarikian, Anderson, Bassetti, Brace, Clemens, da Costa Gurgel, Dickens, Dunlea, Gallagher, Giosan, Henderson, Holbourn, Ikehara, Irino, Itaki, Karasuda, Kinsley, Kubota, Lee, Lee, Lof, Lopes, Peterson, Saavedra-Pellitero, Sagawa, Singh, Sugisaki, Toucanne, Wan, Xuan, Zheng and Ziegler2015). In this study, the tephra layers are excluded, as we mainly focus on the potential link between Asian dust supply and oceanic primary productivity.
The age model for IODP Site U1430 was established on the basis of the magnetostratigraphy and biostratigraphy (Tada et al. Reference Tada, Murray, Alvarez Zarikian, Anderson, Bassetti, Brace, Clemens, da Costa Gurgel, Dickens, Dunlea, Gallagher, Giosan, Henderson, Holbourn, Ikehara, Irino, Itaki, Karasuda, Kinsley, Kubota, Lee, Lee, Lof, Lopes, Peterson, Saavedra-Pellitero, Sagawa, Singh, Sugisaki, Toucanne, Wan, Xuan, Zheng and Ziegler2015; Kamikuri et al. Reference Kamikuri, Itaki, Motoyama and Matsuzaki2017). The average sedimentation rate is c. 1.7 cm ka−1 since 4 Ma, with a sample resolution of ∼42.9 ka−1.
3.b. Analytical methods
For major and trace element analysis, approximately 40 mg of dried and powdered material from each sample was mixed with acids (1.5 mL HF + 0.5 mL HNO3) in a Teflon beaker and kept on a hot plate at 150 °C for 24 h. Later, 0.5 mL HClO4 was added to the open beaker and heated on a hot plate to dryness at 150 °C. After addition of 1 mL HNO3 and 1 mL H2O in a sealed beaker for 12 h, the solution was diluted with 40 g of deionized water. The major and trace element concentrations were measured at the Institute of Oceanology, Chinese Academy of Sciences (IOCAS), Qingdao, using a Thermo Icap6300 ICP-AES and a Perkin-Elmer ELAN DRC II ICP-MS, respectively (Wan et al. Reference Wan, Toucanne, Clift, Zhao, Bayon, Yu, Cai, Yin, Revillon, Wang, Li and Li2015). Blanks, duplicate samples and a series of US Geological Survey (USGS) and Chinese rock and sediment standards (BCR-2, BHVO-2, GBW07103, GBW07315 and GBW07316) were used to monitor analytical precision. The analytical precision (relative standard deviation (RSD)) is generally better than 1 % for major elements and 3 % for trace elements.
The total carbon (TC) contents were analysed on the freeze-dried and homogenized bulk sediment samples. To determine the total organic carbon (TOC) contents of the bulk samples, they were treated with 2 N HCl for 24 h to remove carbonates. The decalcified residues were then treated with a small amount of 2 N HCl to ensure complete carbonate removal. The carbonate-free residue from this procedure was recovered by centrifugation, rinsed to remove chlorides and freeze-dried for subsequent analyses. The TC and TOC contents were determined with an Elementar Vario MACRO cube elemental analyzer at the Yantai Institute of Coastal Zone Research, Chinese Academy of Sciences. The analytical precision (RSD) of the TC and TOC analysis is better than 0.5 %. The CaCO3 content was calculated by subtracting the TOC from the TC value and using the formula CaCO3 (%)= 8.333 × (TC – TOC).
3.c. Data normalization
Before palaeoenvironment reconstruction, it is necessary to consider the dilution effect of authigenic minerals such as opal and calcium carbonate which can dilute the trace element abundance of a sample (Tribovillard et al. Reference Tribovillard, Algeo, Lyons and Riboulleau2006). Generally, the classical method is to normalize the element concentrations to lithogenic elements (e.g. Al or Ti), which are relatively insoluble in seawater and can be considered as detrital siliciclastic fraction of sediments (Wedepohl, Reference Wedepohl, Ahrens, Press, Runcorn and Urey1971; Calvert & Pedersen, Reference Calvert and Pedersen1993; Piper & Perkins, Reference Piper and Perkins2004). In this study, the strong positive correlations (R 2 = 0.73) between Al and Ti of the samples (see Section 5.b) indicate the same normalization effect. To compare the respective enrichments of trace elements in the study core, their concentrations are given in the form of ‘enrichment factors’ (EFs): XEF = (X/Al)sample/(X/Al)PAAS, where X and Al represent the weight concentrations of element X and Al, respectively. Here, the Post-Archean Australian Shale (PAAS) compositions were used as the reference (Taylor & McLennan, Reference Taylor and McLennan1985), since the samples at Site U1430 are organic-rich fine-grained siliciclastic sediments (Tada et al. Reference Tada, Murray, Alvarez Zarikian, Anderson, Bassetti, Brace, Clemens, da Costa Gurgel, Dickens, Dunlea, Gallagher, Giosan, Henderson, Holbourn, Ikehara, Irino, Itaki, Karasuda, Kinsley, Kubota, Lee, Lee, Lof, Lopes, Peterson, Saavedra-Pellitero, Sagawa, Singh, Sugisaki, Toucanne, Wan, Xuan, Zheng and Ziegler2015). Although Al normalization has some potential pitfalls (e.g. scavenging of excess Al by sinking biogenic particles or authigenic clay-mineral formation) (Van der Weijden, Reference Van der Weijden2002), enrichment factors normalized by Al have been proposed as an effective mean for the assessment of the respective enrichments of trace metals (Tribovillard et al. Reference Tribovillard, Algeo, Lyons and Riboulleau2006). In practice, XEF > 3 indicates a detectable authigenic enrichment, and XEF > 10 indicates a moderate to strong enrichment (Algeo & Tribovillard, Reference Algeo and Tribovillard2009). Alternatively, the authigenic fraction of element X (or excess X) in a sample can be estimated as: Xxs (or Xauth) = Xtotal − Tisample × (X/Ti)PAAS (Tribovillard et al. Reference Tribovillard, Algeo, Lyons and Riboulleau2006).
3.d. Geochemical proxies
3.d.1. Palaeoproductivity proxies
Generally, the TOC content, representing the single largest component of organic matter, is considered to be the most direct palaeoproductivity proxy (Pedersen & Calvert, Reference Pedersen and Calvert1990; Zonneveld et al. Reference Zonneveld, Versteegh, Kasten, Eglinton, Emeis, Huguet, Koch, de Lange, Middelburg, Mollenhauer, Prahl, Rethemeyer and Wakeham2010; Schoepfer et al. Reference Schoepfer, Shen, Wei, Tyson, Ingall and Algeo2015). The biological or excess Ba (i.e. Baxs) is usually utilized as a good productivity indicator, with Ba enrichments related to the formation of barite within microenvironments during the decay of organic matter (Dymond et al. Reference Dymond, Suess and Lyle1992; Ganeshram et al. Reference Ganeshram, Francois, Commeau and Brown-Leger2003; Griffith & Paytan, Reference Griffith and Paytan2012; Schoepfer et al. Reference Schoepfer, Shen, Wei, Tyson, Ingall and Algeo2015). Deposition of such biogenic barite is the main process of excess Ba removal from seawater to sediments. In the oxygenated ocean, excess Ba shows a strong positive correlation with primary productivity (Dymond et al. Reference Dymond, Suess and Lyle1992). However, Ba may be preferentially lost in sulphate-depleted anoxic water, which limits the use of Ba as a productivity proxy (Ganeshram et al. Reference Ganeshram, Calvert, Pedersen and Cowie1999; Schenau et al. Reference Schenau, Prins, De Lange and Monnin2001).
In addition, the authigenic Cu and Ni (i.e. Cuxs and Nixs) are also widely used as productivity indicators in marine sediments, as their enrichments are linked to the deposition of organic matter (Piper & Perkins, Reference Piper and Perkins2004; Tribovillard et al. Reference Tribovillard, Algeo, Lyons and Riboulleau2006; Grasby et al. Reference Grasby, Beauchamp and Knies2016). Cu and Ni are mostly attached to organic ligands, leaving a small fraction as divalent ions in seawater (Calvert & Pedersen, Reference Calvert and Pedersen1993; Algeo & Maynard, Reference Algeo and Maynard2004). After setting to the bottom sediments with organic particles, Cu and Ni will be released to pore-water during degradation of organic matter. Under sulphate-reducing conditions, they can be trapped by pyrite (Huerta-Diaz & Morse, Reference Huerta-Diaz and Morse1992; Morse & Iii, Reference Morse and Iii1999; Algeo & Maynard, Reference Algeo and Maynard2004), and efficiently preserved within the sediments whereas organic matter may be remineralized by bacterial activity (Tribovillard et al. Reference Tribovillard, Algeo, Lyons and Riboulleau2006). Recent research further demonstrated the applicability of Ni to serve as a tracer for primary productivity based on excellent correlations between organic matter fluxes, nutrient fluxes and sedimentary Ni concentration, as measured in the upwelling anoxic region off Peru (Böning et al. Reference Böning, Shaw, Pahnke and Brumsack2015) and the oxygenated Gulf of Aqaba in the northern Red Sea (Steiner et al. Reference Steiner, Lazar, Torfstein and Erez2017).
Considering the possible redox condition variations throughout 4 Ma, and that no single proxy is always reliable under different conditions, in this study the palaeoproductivity proxies TOC, Baxs, Cuxs and Nixs were combined to constrain the primary productivity changes.
3.d.2. Palaeoredox proxies
Many trace elements such as Mn, U, V and Mo have been used as seawater redox indicators (Calvert & Pedersen, Reference Calvert and Pedersen1993; Wignall & Twitchett, Reference Wignall and Twitchett1996; Algeo & Maynard, Reference Algeo and Maynard2004; Tribovillard et al. Reference Tribovillard, Algeo, Lyons and Riboulleau2006; Algeo & Tribovillard, Reference Algeo and Tribovillard2009). Here, we apply the covariant pattern of Mo and U elements to constrain benthic redox conditions. Both elements exist as conservative oxyanions in oxic environments, but their different behaviour under reducing conditions can potentially result in remarkably different levels of enrichment (Algeo & Tribovillard, Reference Algeo and Tribovillard2009; Scott & Lyons, Reference Scott and Lyons2012; Azrieli-Tal et al. Reference Azrieli-Tal, Matthews, Bar-Matthews, Almogi-Labin, Vance, Archer and Teutsch2014). For example, authigenic U accumulation commences at the Fe(II)–Fe(III) redox boundary, whereas authigenic Mo accumulation requires the presence of H2S (Helz et al. Reference Helz, Miller, Charnock, Mosselmans, Pattrick, Garner and Vaughan1996; Zheng et al. Reference Zheng, Anderson, Geen and Fleisher2002). The differential enrichment can be diagnosed in a MoEF vs UEF plot proposed by Algeo & Tribovillard (Reference Algeo and Tribovillard2009).
4. Results
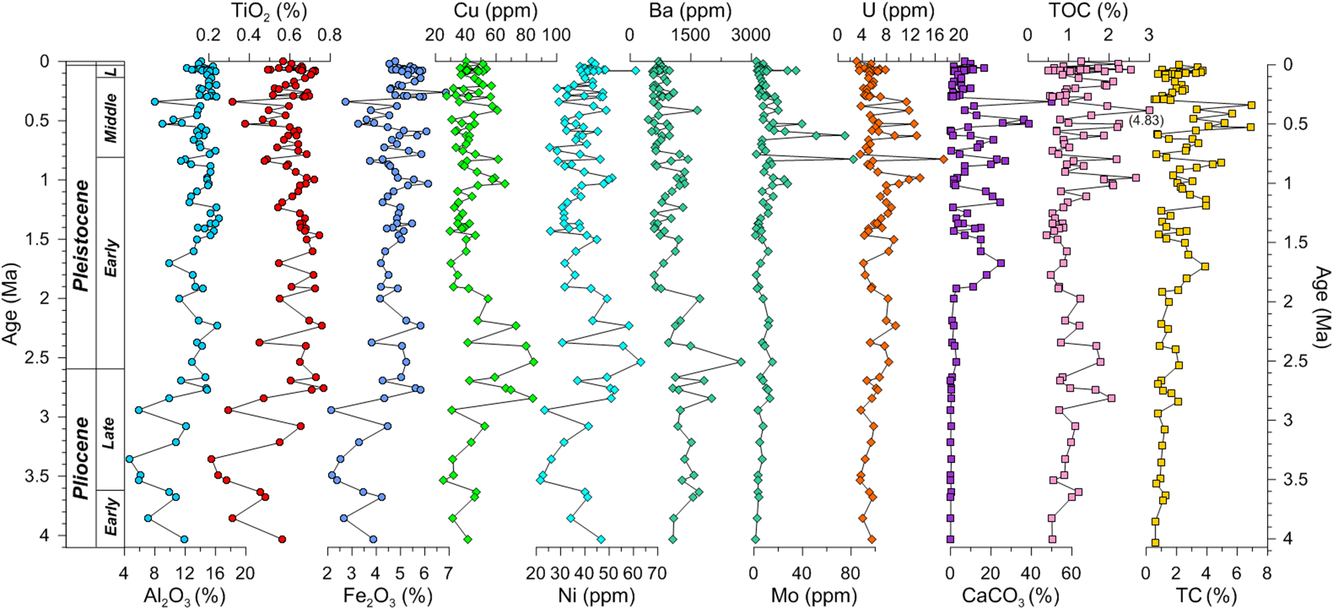
The concentrations of major and trace elements, TOC, TC and CaCO3 of the studied materials are shown in Figure 2 and in Supplementary Table S1 (available online at https://doi.org/10.1017/S0016756819000554). Al2O3, TiO2 and Fe2O3 range from 4.7 to 16.5 % (average 13.5 %), 0.2 to 0.8 % (average 0.6 %) and 2.1 to 6.9 % (average 4.7 %), respectively. The trace elements show significant variations, with Ba ranging from 456.3 to 2744.5 ppm (average 955.3 ppm), Cu from 25.4 to 84.6 ppm (average 44.6 ppm), Ni from 21.8 to 63.0 ppm (average 39.4 ppm), Mo from 1.4 to 81.8 ppm (average 11.3 ppm) and U from 3.1 to 11.3 ppm (average 6.4 ppm). In general, the concentrations of Al2O3, TiO2, Fe2O3, Cu, Ni and Ba display a long-term increasing trend with high-frequency fluctuations at 4–2 Ma (except for Ba with little variation at 4–3 Ma), and then remain relatively stable since 2 Ma, whereas Mo and U show no significant enrichment at 4–1.2 Ma, and then become frequently fluctuated since 1.2 Ma (Fig. 2).
Stratigraphic variations of major and trace element, total organic carbon (TOC) and total carbon (TC) concentrations in the sediments of IODP Site U1430 in the last 4 Ma. Note that the highest TOC value (4.8 %) exceeds the maximum scale.

The TOC and TC contents are variable at the study site, ranging from 0.5 to 4.8 % (average 1.2 %) and 0.6 to 6.9 % (average 2.1 %), respectively. The TOC contents generally show an increasing trend at 4–1.2 Ma, followed by higher values and frequent fluctuations since 1.2 Ma. The TC contents exhibit an increasing trend throughout the section. The CaCO3 concentration (0.01–50.0 %, average 7.7 %) at the study site approximately reflects the content of biogenic carbonate (foraminifera and nannofossils) in sediments (Tada et al. Reference Tada, Murray, Alvarez Zarikian, Anderson, Bassetti, Brace, Clemens, da Costa Gurgel, Dickens, Dunlea, Gallagher, Giosan, Henderson, Holbourn, Ikehara, Irino, Itaki, Karasuda, Kinsley, Kubota, Lee, Lee, Lof, Lopes, Peterson, Saavedra-Pellitero, Sagawa, Singh, Sugisaki, Toucanne, Wan, Xuan, Zheng and Ziegler2015), exhibiting high frequent and large amplitude variations since 2 Ma, while these are almost absent at 4–2 Ma (Fig. 2). This is largely consistent with the transition of marine organisms from diatom-dominated to foraminifera-dominated in the Japan Sea (Tada et al. Reference Tada, Murray, Alvarez Zarikian, Anderson, Bassetti, Brace, Clemens, da Costa Gurgel, Dickens, Dunlea, Gallagher, Giosan, Henderson, Holbourn, Ikehara, Irino, Itaki, Karasuda, Kinsley, Kubota, Lee, Lee, Lof, Lopes, Peterson, Saavedra-Pellitero, Sagawa, Singh, Sugisaki, Toucanne, Wan, Xuan, Zheng and Ziegler2015).
5. Discussion
5.a. Evolution of palaeoproductivity in the Japan Sea
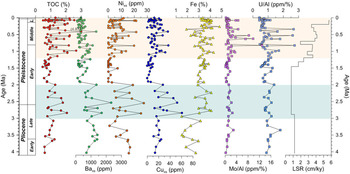
At IODP Site U1430, the TOC, Baxs, Cuxs and Nixs concentrations display generally similar variation patterns (Fig. 3), with relatively higher values between ∼3 and 2 Ma and since ∼1.2 Ma, indicating an enhancement in export productivity at that time. Note that the concentrations of Baxs are relatively low compared with Cuxs, Nixs and TOC since 1.2 Ma, which is likely to be related to the loss of authigenic Ba at that time. However, Cuxs and Nixs still show some inconsistency with TOC. Specifically, the maximum values of Cuxs and Nixs are observed in the sequence between 3 and 2 Ma, while TOC content since 1.2 Ma is much higher than that during the late Pliocene. This probably reflects increased primary productivity or enhanced organic carbon burial efficiency caused by changes in palaeoceanographic condition.
Stratigraphic variations of biogenic components (CaCO3, TOC, Baxs, Cuxs and Nixs), Fe, redox proxies (Mo/Al and U/Al) and linear sedimentation rates (LSR) at IODP Site U1430 since 4 Ma. Note that the highest TOC value (4.8 %) exceeds the maximum scale. The light green and light orange shaded areas highlight steady increases in palaeoproductivity at 3–2 Ma and high-frequency oscillations in palaeoproductivity and redox conditions since 1.2 Ma, respectively.

5.b. Controls of palaeoproductivity evolution in the Japan Sea
Accumulation of organic matter and enrichment of authigenic elements in marine sediments are not only a mirror of surface primary productivity, but are also usually influenced by additional factors, including water redox condition and sedimentation rate (Ibach, Reference Ibach1982; Canfield, Reference Canfield1994; Tyson, Reference Tyson2001, Reference Tyson and Harris2005). Therefore, we should consider the possible influence of each potential factor on our proxy records.
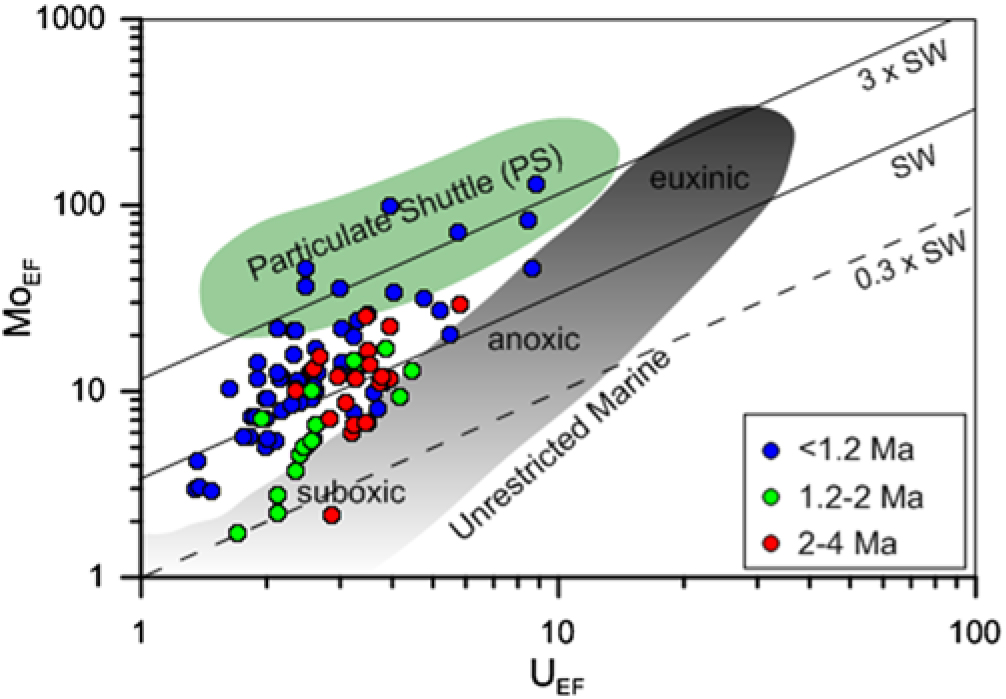
Bottom-water redox condition generally plays a pivotal role in the enrichment of elemental productivity proxies in sediments (Canfield, Reference Canfield1994). The MoEF and UEF data at Site U1430 are plotted in Figure 4 and fit the weakly restricted marine domain defined by the modern Cariaco Basin (Algeo & Tribovillard, Reference Algeo and Tribovillard2009; Tribovillard et al. Reference Tribovillard, Algeo, Baudin and Riboulleau2012), clearly deviating from the open marine environment. Mo generally shows strong enrichment, with an average MoEF of 16.5, while U shows modest enrichment with an average UEF of 3.0. Sediments older than 1.2 Ma basically lie along a modest Mo/U trend, typical of suboxic–anoxic conditions, whereas sediments of recent 1.2 Ma partly fall to the particulate shuttle field, indicating more reducing conditions. That is, benthic redox conditions at the study site were generally suboxic–anoxic at 4–1.2 Ma, and became more reducing episodically since ∼1.2 Ma. These findings are basically consistent with the palaeogeographic variations proposed by the previous studies (Tada, Reference Tada1994; Itaki, Reference Itaki2016). Moreover, the ratios of both Mo/Al and U/Al remain basically stable between about 4 and 1.2 Ma and show more variability since ∼1.2 Ma (Fig. 3). This confirms the redox conditions of bottom water in the SW Japan Sea are very likely to have been considerably constant at 3–2 Ma, although the sea level was estimated to drop 50–60 m driven by the Northern Hemisphere Glaciation at ∼2.7 Ma, as documented by the changes in the ostracod assemblages in the margins of the Japan Sea (Cronin et al. Reference Cronin, Kitamura, Ikeya, Watanabe and Kamiya1994; Yamada et al. Reference Yamada, Tanaka and Irizuki2005). Because of the totally inconsistent variation of bottom water redox condition and palaeoproductivity at 3–2 Ma, we infer that the redox condition cannot account for enhanced organic matter accumulation during the late Pliocene and early Pleistocene. In contrast, both Mo/Al and U/Al exhibit episodic exceptional enrichment since ∼1.2 Ma, similar to variations of palaeoproductivity proxies (Fig. 3), suggesting that palaeoproductivity oscillations are potentially linked to benthic redox condition changes since 1.2 Ma.
MoEF vs UEF for the samples of IODP Site U1430. The SW lines show Mo/U weight ratios equal to the seawater value (SW) and to the fractions thereof (3 × SW and 0.3 × SW). The patterns of U and Mo EFs are compared with the model proposed by Algeo & Tribovillard (Reference Algeo and Tribovillard2009).

Rapid sedimentation rates can largely reduce the time that organic matter spent in various bacterial degradation zones, leading to enhanced preservation of organic carbon (Ibach, Reference Ibach1982; Tyson, Reference Tyson2001, Reference Tyson and Harris2005), regardless of the concurrent dilution by inorganic components (Wignall, Reference Wignall1991). Based on the linear sedimentation rate profile (Fig. 3), it is clear that the sedimentation rate remained basically unchanged for the 4–1.5 Ma interval, and gradually increased thereafter. Therefore, enhanced organic matter accumulation at 3–2 Ma is unlikely to have been controlled by sedimentation rate. However, elevated sedimentation rates are likely to have facilitated organic matter accumulation to some degree since 1.2 Ma (Fig. 3).
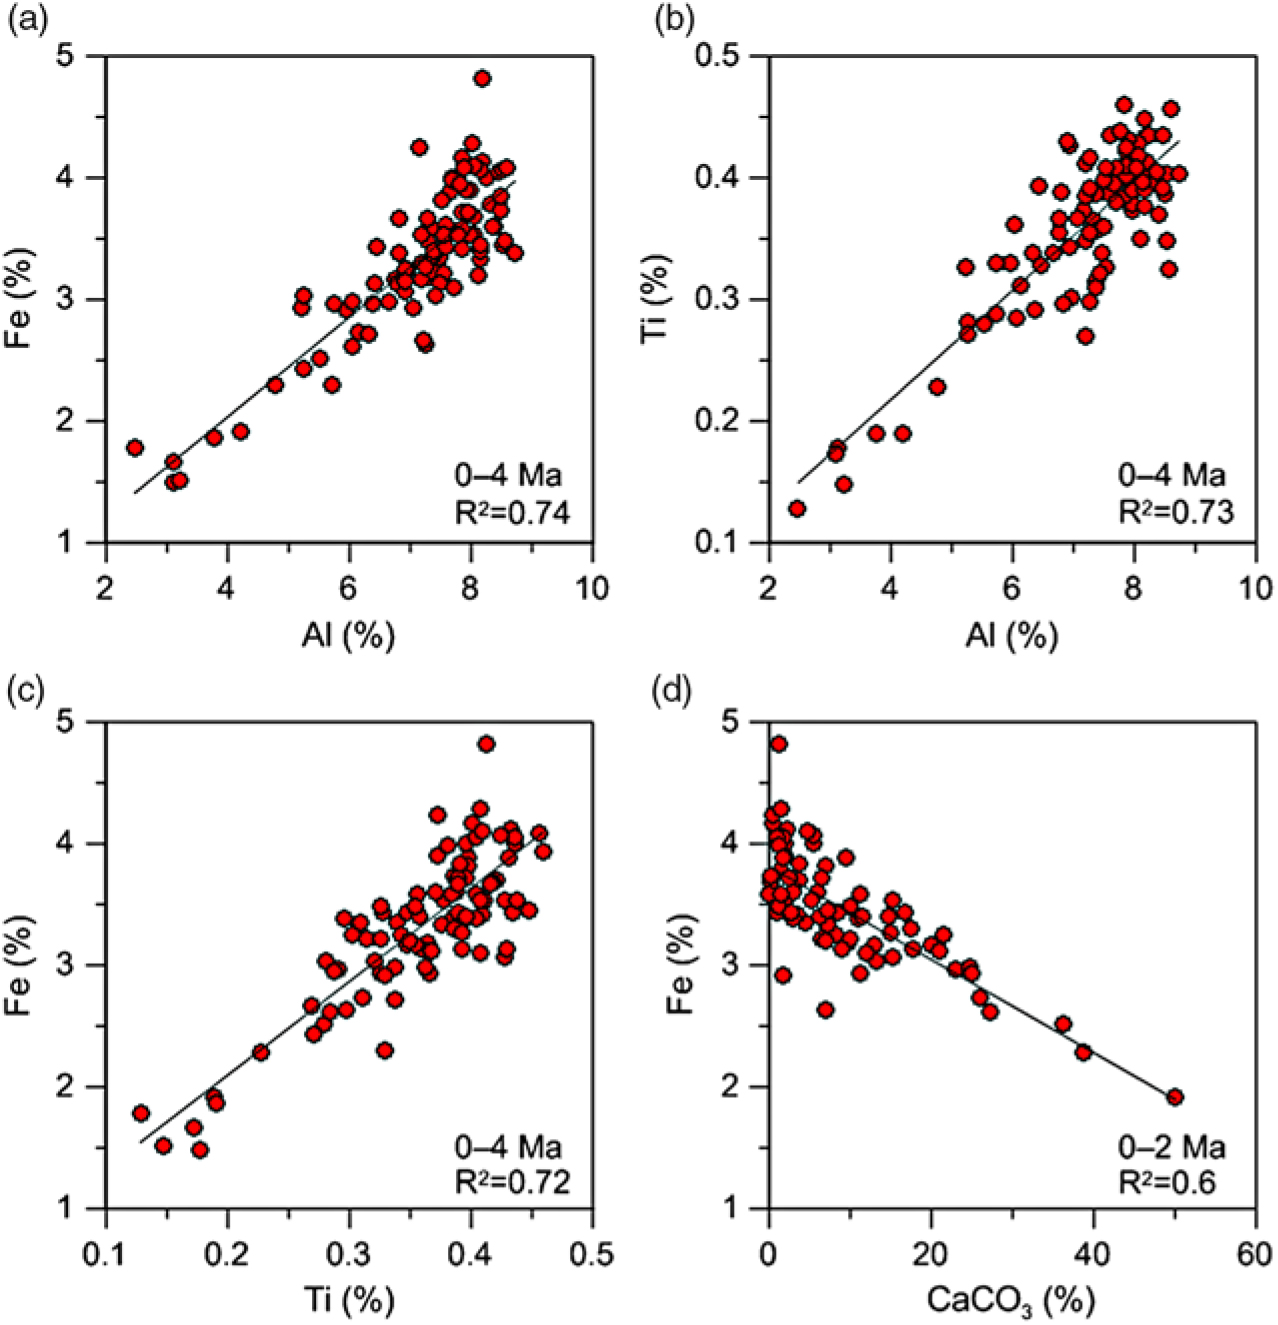
After excluding the possible influence of post-deposition processes on the productivity proxies, we are confident that the main control of primary productivity at the study site in the SW Japan Sea is nutrition supply from wind or current. Dissolved iron is an essential micronutrient for marine phytoplankton, and its availability potentially controls marine primary productivity and global carbon cycling (Moore et al. Reference Moore, Doney, Glover and Fung2002; Boyd & Ellwood, Reference Boyd and Ellwood2010; Tagliabue et al. Reference Tagliabue, Bowie, Boyd, Buck, Johnson and Saito2017). The main sources of dissolved Fe utilized by primary producers include aeolian dust, submarine hydrothermal activity, and sedimentary dissolution along continental margins (Elrod et al. Reference Elrod, Berelson, Coale and Johnson2004; Jickells et al. Reference Jickells, An, Andersen, Baker, Bergametti, Brooks, Cao, Boyd, Duce and Hunter2005; Moore & Braucher, Reference Moore and Braucher2008; Severmann et al. Reference Severmann, McManus, Berelson and Hammond2010; Tagliabue et al. Reference Tagliabue, Bopp, Dutay, Bowie, Chever, Jean-Baptiste, Bucciarelli, Lannuzel, Remenyi, Remenyi, Aumont, Gehlen and Jeandel2010; Jeandel et al. Reference Jeandel, Peucker-Ehrenbrink, Jones, Pearce, Oelkers, Godderis, Lacan, Aumont and Arsouze2011). Deep-sea Fe isotope composition reconstruction indicates that aeolian dust has provided a significant proportion of the dissolved Fe inventory in the central Pacific since the middle Miocene, although hydrothermalism and marginal sediment dissolution may have exerted a major control between the late Cretaceous and middle Miocene (Horner et al. Reference Horner, Williams, Hein, Saito, Burton, Halliday and Nielsen2015). In the equatorial Pacific and North Atlantic, atmospheric dust is undoubtedly the largest contributor of dissolved Fe (over 70 %) (Ziegler et al. Reference Ziegler, Murray, Plank and Hemming2008; Conway & John, Reference Conway and John2014). Meanwhile, given the dominance of Asian dust flux in the sediments of the SW Japan Sea (Irino & Tada, Reference Irino and Tada2002; Nagashima et al. Reference Nagashima, Tada, Matsui, Irino, Tani and Toyoda2007; Shen et al. Reference Shen, Wan, France-Lanord, Clift, Tada, Révillon, Shi, Zhao, Liu, Yin, Song and Li2017), it is reasonable to assume a major atmospheric Fe contribution to the dissolved Fe inventory in the Japan Sea since the Pliocene. By contrast, sedimentary dissolution and hydrothermalism may not be significant sources of Fe at that time. The broad river-dominated continental margins could provide high benthic Fe flux from sedimentary pore fluids (Severmann et al. Reference Severmann, McManus, Berelson and Hammond2010), whereas Fe originating from sedimentary dissolution likely made very limited contribution to the dissolved Fe inventory due to the narrow shelf and a lack of large river input in the Japan Sea (Park et al. Reference Park, Chung and Kim2004). Intense hydrothermal activity related to seafloor spreading of the Japan Sea primarily occurred in the early-middle Miocene (Fagel et al. Reference Fagel, André, Chamley, Debrabant and Jolivet1992; Kimura et al. Reference Kimura, Shikazono, Kashiwagi and Nohara2004), thus ruling out a major hydrothermal Fe contribution to seawater since 4 Ma. Therefore, Fe input can be used as a rough indicator for tracing the intensity of Asian dust input to the Japan Sea since 4 Ma. At the study site, the strong correlations between Fe, Al and Ti (R 2 > 0.7) (Fig. 5a–c) indicate basically the same terrigenous origin (aeolian dust derived from Central Asia) or dilution effect since 4 Ma. However, their strong correlations at 4–2 Ma are not a result of dilution, since the dilution was very weak under slow sedimentation rates at that time. Fe concentrations exhibit overall high values at ∼3–2 Ma, which is coincident with coeval enhanced palaeoproductivity (Fig. 3). Considering that redox condition and sedimentation rate cannot account for enhanced palaeoproductivity changes at 3–2 Ma, as discussed above, we suggest that higher aeolian Fe input is more likely responsible for controlling the enhanced primary production at that time.
Correlation plots of Fe, Al, Ti and CaCO3 for the sediments from IODP Site U1430. (a) Fe vs Al diagram. (b) Ti vs Al diagram. (c) Fe vs Ti diagram. (d) Fe vs CaCO3 diagram.

However, this is clearly not the case for control of primary production at the study site since 2 Ma. Aeolian Fe exhibits no correlation with palaeoproductivity proxies (Fig. 3). Note that there is an obvious negative correlation between Fe and CaCO3 since 2 Ma (R 2 = 0.6) (Fig. 5d), reflecting strong dilution by CaCO3. Therefore, the lack of relationship between Fe and palaeoproductivity proxies since 2 Ma likely indicates that aeolian dust flux had little influence on primary productivity. Interestingly, we note that both bottom water redox condition and palaeoproductivity consistently exhibit high-frequency oscillations since ∼1.2 Ma. Palaeoceanographic conditions of the Japan Sea changed dramatically in the Pleistocene, characterized by limited North Pacific water due to the near-closure of northern straits and incursion of subtropical water into the Japan Sea via a southern strait beginning at ∼1.7 Ma (Tada, Reference Tada1994; Itaki, Reference Itaki2016). The intrusion of the TSWC via the narrow and shallow southern strait was regulated by glacioeustatic sea level oscillations and the corresponding current strength, which allowed the TSWC into the Japan Sea at interglacial highstands but isolated the Japan Sea at glacial lowstands (Tada, Reference Tada1994). This scenario accounts well for high-frequency oscillations of palaeoproductivity and redox condition. A strong influx of lower-salinity, nutrient-enriched East China Sea coastal water imported by the TSWC during interglacial periods (Tada et al. Reference Tada, Irino and Koizumi1999) could potentially have promoted surface primary productivity, and further caused suboxic–anoxic conditions. On the other hand, more reducing bottom water prevalent during glacial periods could facilitate accumulation of organic matter to some extent, although without high productivity. This can also explain the disparity in redox condition and palaeoproductivity variations since 1.2 Ma (Fig. 3).
5.c. Significance of long-term Asian dust input on palaeoproductivity
Enhanced oceanic biological production induced by higher aeolian Fe fluxes in the open-sea areas of the Southern Ocean and equatorial Pacific Ocean (Martínez-García et al. Reference Martínez-García, Rosell-Melé, Geibert, Gersonde, Masqué, Gaspari and Barbante2009, Reference Martínez-García, Sigman, Ren, Anderson, Straub, Hodell, Jaccard, Eglinton and Haug2014; Murray et al. Reference Murray, Leinen and Knowlton2012) may have also operated in restricted marginal seas, which have been primarily influenced by aeolian dust in the geological past (Tada, Reference Tada1994; Shen et al. Reference Shen, Wan, France-Lanord, Clift, Tada, Révillon, Shi, Zhao, Liu, Yin, Song and Li2017). The Japan Sea is such a restricted marginal sea without large rivers around (Wang, Reference Wang1999), and a clear predominance of Asian dust flux has been recognized in the sediments of the Japan Sea, with which the aridification history in the Asian interior, primarily controlled by high-latitude ice sheets in the Northern Hemisphere, has been reconstructed since the Pliocene (Shen et al. Reference Shen, Wan, France-Lanord, Clift, Tada, Révillon, Shi, Zhao, Liu, Yin, Song and Li2017; Zhang et al. Reference Zhang, Vleeschouwer, Shen, Zhang and Zeng2018). Therefore, it is plausible to suppose that enhanced iron supply from long-term Asian dust fluxes could potentially have facilitated phytoplankton bloom and further led to higher CO2 drawdown in the Japan Sea.
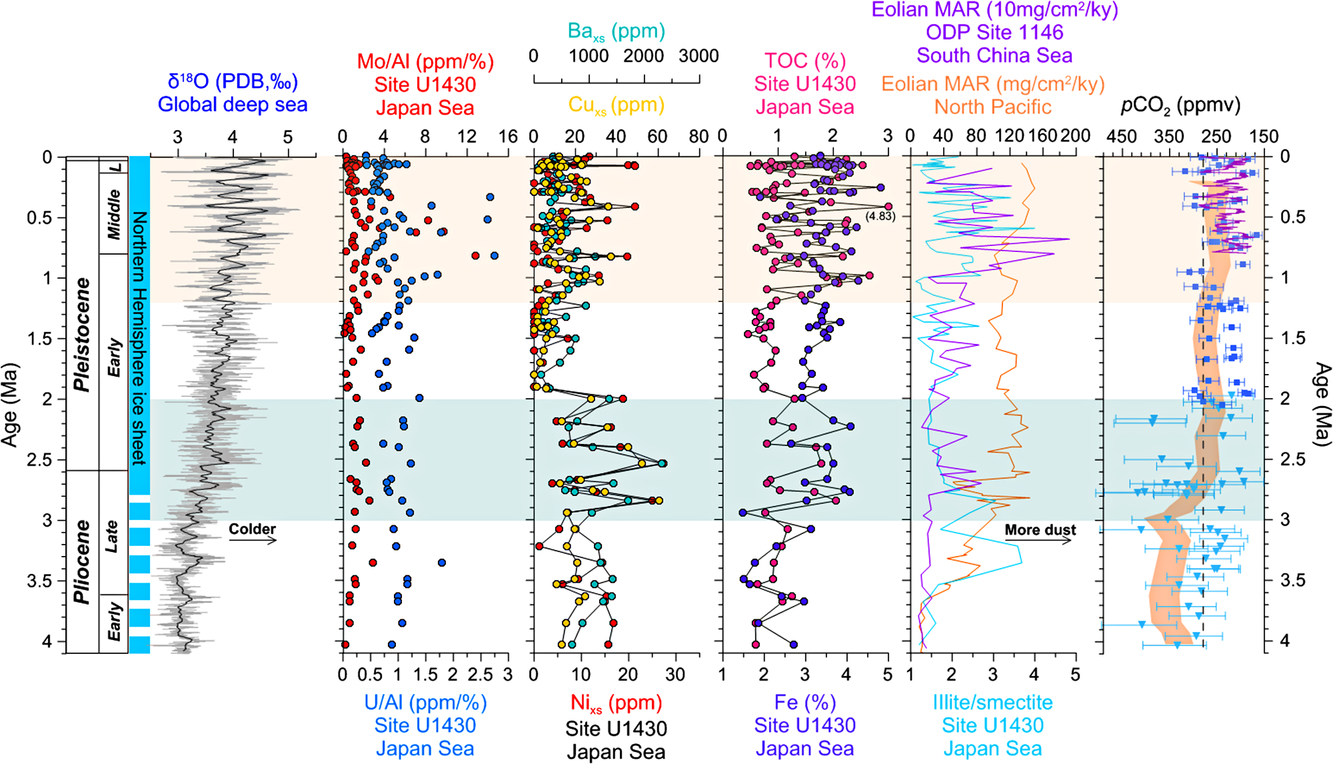
During the 3–2 Ma interval, primary productivity and aeolian Fe input exhibit consistent increases in the SW Japan Sea. Rea et al. (Reference Rea, Snoeckx and Joseph1998) found that aeolian dust accumulation in the North Pacific exhibited an increasing trend at ∼3.5 Ma, followed by a substantial increase to highest values of 100–140 mg cm−2 ka−1 since ∼3 Ma. Mineralogical and sedimentologic records in the northern South China Sea also show increases in aeolian dust fluxes since ∼3 Ma (Wan et al. Reference Wan, Li, Clift and Stuut2007). Such patterns of aeolian dust records in the ocean match aeolian deposits in the Chinese Loess Plateau (Guo et al. Reference Guo, Ruddiman, Hao, Wu, Qiao, Zhu, Peng, Wei, Yuan and Liu2002). Similarly, more illite-rich clay minerals deposited in the Japan Sea after ∼3.5 Ma suggest strengthening of central Asian aeolian input to the Japan Sea at that time (Fig. 6) (Shen et al. Reference Shen, Wan, France-Lanord, Clift, Tada, Révillon, Shi, Zhao, Liu, Yin, Song and Li2017). However, we note the transient increase in the illite/smectite ratio (i.e. the balance of central Asian aeolian input vs fluvial flux of weathered products from Japan islands) at the study site in the Japan Sea at 3.5–2.5 Ma, followed by a decline at ∼2.5–2 Ma (Shen et al. Reference Shen, Wan, France-Lanord, Clift, Tada, Révillon, Shi, Zhao, Liu, Yin, Song and Li2017), which is partly inconsistent with coeval aeolian Fe input and palaeoproductivity proxies in this study and evolution of Asian aeolian dust flux in the North Pacific and South China Sea (Rea et al. Reference Rea, Snoeckx and Joseph1998; Wan et al. Reference Wan, Li, Clift and Stuut2007). The decoupling was probably induced by the dilution of stronger input of volcanic detritus from the Japan islands since the Pleistocene (Shen et al. Reference Shen, Wan, France-Lanord, Clift, Tada, Révillon, Shi, Zhao, Liu, Yin, Song and Li2017). Onset of the Northern Hemisphere Glaciation caused intensified aridity in the central Asian interior, such as the Mongolian Gobi desert and Taklimakan Desert (Nagashima et al. Reference Nagashima, Tada, Matsui, Irino, Tani and Toyoda2007), and further accelerated dust production, which liberated essential nutrients (especially dissolved Fe, Si and P) to marine ecosystems (Martin, Reference Martin1990; Falkowski et al. Reference Falkowski, Barber and Smetacek1998; Harrison et al. Reference Harrison, Whitney, Tsuda, Saito and Tadokoro2004; Boyd et al. Reference Boyd, Jickells, Law, Blain, Boyle, Buesseler, Coale, Cullen, de Baar, Follows, Harvey, Lancelot, Levasseur, Owens, Pollard, Rivkin, Sarmiento, Schoemann, Smetacek, Takeda, Tsuda, Turner and Watson2007; Bristow et al. Reference Bristow, Hudson-Edwards and Chappell2010) and stimulated phytoplankton bloom in the surface ocean. The coeval benthic redox condition was almost invariant, as indicated by suboxic–anoxic waters, despite sea level drops caused by growth of the Northern Hemisphere ice sheets (Cronin et al. Reference Cronin, Kitamura, Ikeya, Watanabe and Kamiya1994; Yamada et al. Reference Yamada, Tanaka and Irizuki2005). Likewise, coeval sedimentation rates changed little. Therefore, given the observed coupling of higher aeolian iron flux, increased palaeoproductivity, and global cooling at 3–2 Ma, we propose that increased Asian dust input driven by global cooling since the late Pliocene mainly governed long-term surface primary productivity and subsequent higher export production in the Japan Sea.
Comparison of geochemical proxies for sediments in deep sea and ice cores since 4 Ma. Global deep-sea δ18O records were obtained from data compilation of more than 40 DSDP and ODP sites (Zachos et al. Reference Zachos, Pagani, Sloan, Thomas and Billups2001). The vertical blue bars roughly represent ice volume in the Northern Hemisphere ice sheets, with the full bar indicating the largest scales of ice coverage and the dashed bar indicating partial ice coverage. The Fe, redox proxies (Mo/Al and U/Al) and biogenic components (TOC, Baxs, Cuxs and Nixs) were measured at IODP Site U1430 in the Japan Sea in this study. The aeolian mass accumulation rates and illite/smectite ratios were derived from ODP Site 885/886 in the North Pacific (Rea et al. Reference Rea, Snoeckx and Joseph1998), ODP Site 1146 in the northern South China Sea (Wan et al. Reference Wan, Li, Clift and Stuut2007), and IODP Site U1430 in the Japan Sea (Shen et al. Reference Shen, Wan, France-Lanord, Clift, Tada, Révillon, Shi, Zhao, Liu, Yin, Song and Li2017). The atmospheric pCO2 values were measured in ice cores (Lüthi et al. Reference Lüthi, Floch, Bereiter, Blunier, Barnola, Siegenthaler, Raynaud, Jouzel, Fischer and Kawamura2008) (purple line), estimated from alkenone (Seki et al. Reference Seki, Foster, Schmidt, Mackensen, Kawamura and Pancost2010) (orange shading), and estimated from planktic foraminifer G. sacculifer δ11B in blue squares (Hönisch et al. Reference Hönisch, Hemming, Archer, Siddall and McManus2009) and light blue triangles (Bartoli et al. Reference Bartoli, Hönisch and Zeebe2011). The horizontal error bars represent reported uncertainty in boron isotope pCO2 estimates. The orange shading indicates the range between published maximum and minimum alkenone pCO2 estimates. The dashed line marks pre-industrial pCO2 concentrations (280 ppmv).

However, since 1.2 Ma, the impact of distinct regional tectonic and palaeoceanographic settings in the Japan Sea, i.e. the widening of the Tsushima Strait probably related to the second stretching of the northern Okinawa Trough since ∼2 Ma (Shinjo, Reference Shinjo1999; Gungor et al. Reference Gungor, Lee, Kim, Han, Kang, Kim and Sunwoo2012), overwhelmed the aeolian input control of palaeoproductivity. The TSWC with high nutrients from the East China Sea coastal water flowed into the Japan Sea via the strait during interglacial higher sea levels (Tada et al. Reference Tada, Irino and Koizumi1999; Itaki, Reference Itaki2016), which greatly promoted availability of nutrients and led to enhanced primary productivity. The signal of Asian dust was largely obscured and made very limited contributions to primary productivity changes, although the coeval Asian dust delivered into the Japan Sea is generally considered to have continuously increased (Shen et al. Reference Shen, Wan, France-Lanord, Clift, Tada, Révillon, Shi, Zhao, Liu, Yin, Song and Li2017; Zhang et al. Reference Zhang, Vleeschouwer, Shen, Zhang and Zeng2018). Therefore, we conclude that Asian dust input was the main mechanism driving the enhanced primary productivity and export production at 3–2 Ma, whereas the TSWC incursion into the Japan Sea, which was controlled by glacioeustatic sea level oscillations, superseded Asian dust input to be the primary factor regulating biological productivity since ∼1.2 Ma.
5.d. Potential role of productivity in the Japan Sea in altering atmospheric CO2
Phytoplankton in the ocean contributes almost half of the photosynthesis on the Earth, which can regulate global climate by controlling the amount of the greenhouse gas CO2 in the atmosphere (Chisholm, Reference Chisholm2000). The modern Southern Ocean has long been considered as a most important controller for atmospheric CO2 concentrations (Sarmiento & Toggweiler, Reference Sarmiento and Toggweiler1984; Siegenthaler & Wenk, Reference Siegenthaler and Wenk1984), because of the incomplete utilization of nutrients in the surface layer, which can allow for the escape of deeply sequestered CO2 back to the atmosphere (Sigman et al. Reference Sigman, Hain and Haug2010). Strengthening of the biological pump in the Antarctic Zone of the Southern Ocean when dust fluxes were high can explain half of the declines of atmospheric CO2 concentrations during ice ages (Martínez-García et al. Reference Martínez-García, Sigman, Ren, Anderson, Straub, Hodell, Jaccard, Eglinton and Haug2014). In addition to the Southern Ocean, other oceans such as the North Pacific (Jaccard et al. Reference Jaccard, Galbraith, Sigman, Haug, Francois, Pedersen, Dulski and Thierstein2009) and the tropical Pacific (Bradtmiller et al. Reference Bradtmiller, Anderson, Sachs and Fleisher2010) each can potentially regulate glacial/interglacial changes in CO2 concentrations. The sediment records in the western Philippine Sea, a marginal sea of the West Pacific, also suggest that enhanced marine palaeoproductivity driven by increased aeolian dust fluxes may have partly modified atmospheric CO2 concentrations during the middle–late Quaternary glacial periods (Xu et al. Reference Xu, Li, Clift, Lim, Wan, Chen, Tang, Jiang and Xiong2015).
It has been suggested that aeolian iron input to the Southern Ocean was greatly enhanced at ∼2.7 Ma, and that increased export production and nutrient utilization in the Southern Ocean may have contributed to the glacial decrease in atmospheric CO2 (Martínez-Garcia et al. Reference Martínez-Garcia, Rosell-Melé, Jaccard, Geibert, Sigman and Haug2011). Increased Asian dust supply to the North Pacific (Bailey et al. Reference Bailey, Liu, Swann, Jiang, Sun, Zhao and Roberts2011) and the Japan Sea (this study) at ∼2.7 Ma may have a similar fertilization effect and lead to atmospheric CO2 drawdown. In this study, the observed enhanced organic matter burial in the Japan Sea is consistent with the coeval atmospheric CO2 decline during the ∼3.2–2.7 Ma period, from a Pliocene level of 330–400 ppmv to the pre-industrial maximum of 280 ppmv (Seki et al. Reference Seki, Foster, Schmidt, Mackensen, Kawamura and Pancost2010), as measured from ice cores, and boron isotopes and alkenones in the deep-sea sediments (Fig. 6). Therefore, it is plausible that increased carbon sequestration recorded in the Japan Sea might contribute to the decrease in atmospheric CO2 concentrations to some extent, although it is difficult to quantify its exact contribution with available data. As a result, we hypothesize that higher Asian dust fluxes transported from Central Asia led to higher biological production and subsequent enhanced organic carbon burial in the Japan Sea at ∼3–2 Ma, and further provide a positive feedback for the global cooling during the late Pliocene.
6. Conclusions
The detailed analyses of major and trace elements, and TOC of sediments obtained from IODP Site U1430 in the southern Japan Sea provide constraints on the variations in palaeoproductivity and its possible links to Asian dust input since 4 Ma. Palaeoproductivity proxies indicate that the palaeoproductivity was greatly enhanced at 3–2 Ma, whereas high-frequency oscillations occurred in palaeoproductivity since ∼1.2 Ma. Benthic redox condition proxies suggest that bottom water was basically invariant before 1.2 Ma and then frequently oscillated. Given that secular variations in aeolian Fe input were consistent with those in palaeoproductivity proxies at 3–2 Ma, we propose that higher Asian dust input, which was ultimately controlled by growth of the Northern Hemisphere ice sheets, could account for enhanced primary productivity and export production. The enhanced efficiency of organic carbon burial in the Japan Sea might contribute to the coeval decreases of atmospheric CO2 concentrations to some extent. Despite the fact that Asian dust input to the Japan Sea continuously increased after 1.2 Ma, the TSWC intrusion, which was modulated by glacioeustatic sea level changes, has been the principal cause of the periodic changes in primary productivity and benthic redox condition.
Author ORCIDs
Shiming Wan 0000-0001-9335-2248
Acknowledgements
We acknowledge the Integrated Ocean Drilling Program and the scientific party and technicians of IODP Expedition 346 for recovering the samples. We thank two anonymous reviewers for their constructive comments. This work was supported by the National Natural Science Foundation of China (41622603, 41806058 41576034, U1606401), National Program on Global Change and Air–Sea Interaction (GASI-GEOGE-03), Innovation Project (2016ASKJ13, MGQNLM-TD201805), Taishan and Aoshan Talents program (2017ASTCP-ES01), and China Postdoctoral Science Foundation (2018M632729).
Supplementary material
To view supplementary material for this article, please visit https://doi.org/10.1017/S0016756819000554.