





Introduction
Cytochrome P450 monooxygenases (commonly referred to as P450s) are considered one of nature’s most versatile biological catalysts. Due to their powerful catalytic activity, P450s play essential roles in the biosynthesis of various endogenous compounds and in the detoxification of exogenous substances. As one of the largest enzyme families in plant metabolism, P450s are widely involved in herbicide metabolism and contribute to metabolic resistance in various weeds, such as wimmera ryegrass [Lolium rigidum Gaudin], rice barnyardgrass [Echinochloa phyllopogon (Stapf) Koso-Pol.], American sloughgrass [Beckmannia syzigachne (Steud.) Fernald], flixweed [Descurainia sophia (L.) Webb ex Prantl], and roughfruit amaranth [Amaranthus tuberculatus (Moq.) Sauer] (Guo et al. Reference Guo, Iwakami, Yamaguchi, Uchino, Sunohara and Matsumoto2019; Han et al. Reference Han, Yu, Beffa, González, Maiwald, Wang and Powles2021; Shen et al. Reference Shen, Yang, Xu, Han, Li and Zheng2025; Suda et al. Reference Suda, Kubo, Yoshimoto, Tanaka, Tanaka, Uchino, Azuma, Hattori, Yamaguchi, Miyashita, Tominaga and Iwakami2023). A major threat posed by metabolic resistance is its potential to confer unpredictable cross-resistance to herbicides with diverse modes of action. This can undermine resistance management strategies such as herbicide rotation, thereby limiting their effectiveness in delaying the evolution of resistance (Gaines et al. Reference Gaines, Duke, Morran, Rigon, Tranel, Küpper and Dayan2020).
It is widely recognized that P450s confer herbicide resistance in weeds, yet the precise mechanisms remain partially elusive due to the complexity of the P450 superfamily. In most cases of P450-mediated metabolic resistance, enhanced herbicide metabolism is primarily achieved through the overexpression of P450 genes in resistant weed biotypes, which is referred to as “quantitative” change (Aarthy et al. Reference Aarthy, Shyam and Jugulam2022; Han et al. Reference Han, Yu, Beffa, González, Maiwald, Wang and Powles2021; Iwakami et al. Reference Iwakami, Kamidate, Yamaguchi, Ishizaka, Endo, Suda, Nagai, Sunohara, Toki, Uchino, Tominaga and Matsumoto2019). Although several hypotheses have been proposed, the regulatory mechanisms underlying P450 overexpression remain unclear (Gaines et al. Reference Gaines, Duke, Morran, Rigon, Tranel, Küpper and Dayan2020; Iwakami et al. Reference Iwakami, Endo, Saika, Okuno, Nakamura, Yokoyama, Watanabe, Toki, Uchino and Inamura2014). Theoretically, it is also plausible that P450s mediate herbicide metabolism and resistance through “qualitative” changes, such as amino acid mutations that alter the spatial conformation of P450. Such structural changes can subsequently enhance substrate binding affinity and/or catalytic efficiency, leading to increased herbicide metabolism. Although amino acid mutations are known to enhance P450-mediated detoxification and confer insecticide resistance in insects, whether such mutations also contribute to P450-mediated herbicide resistance in weeds remains unknown (Karunker et al. Reference Karunker, Benting, Lueke, Ponge, Nauen, Roditakis, Vontas, Gorman, Denholm and Morin2008; Yang et al. Reference Yang, Deng, Wei, Yang, Zhao, Yin, Du, Guo, Xia, Yang, Xie, Wang, Wu, Yang and Zhou2020).
The P450 gene CYP96A146 was initially identified in D. sophia, a notorious broadleaf weed species infesting winter wheat [Triticum aestivum (L.)] fields in China, and was demonstrated to confer resistance to tribenuron-methyl. The CYP96A146-S and CYP96A146-R genes, cloned from susceptible (S) and tribenuron-methyl-resistant (TR) D. sophia accessions, respectively, exhibited four amino acid differences at positions of Phe-39, His-163, Ser-203, and Val-361. Arabidopsis thaliana (L.) Heynh. transferring CYP96A146-R exhibited significantly faster metabolism of tribenuron-methyl and greater tolerance to the herbicides compared with lines transferring CYP96A146-S. (Shen et al. Reference Shen, Yang, Xu, Han, Li and Zheng2025).
Arabidopsis provides a physiologically relevant environment for studying P450 function, enabling direct observation of herbicide resistance phenotypes in transgenic plants. Nevertheless, the differences in expression levels of CYP96A146-S/R and the presence of endogenous P450 activity in Arabidopsis may interfere with the specific activity of exogenous CYP96A146, hindering accurate functional characterization. As an alternative, the WAT11 yeast strain is also widely used for the heterologous expression of plant P450 genes to investigate their function. In contrast to Arabidopsis, the WAT11 yeast lacks endogenous P450 enzymes, which greatly minimizes interference with heterologously expressed P450s and ensures highly specific and interpretable experimental outcomes. In addition, the Arabidopsis NADPH-P450 reductase 1 (ATR1), an essential component for P450-mediated catalytic metabolism, has been integrated into the genome of the WAT11 strain (Jiang et al. Reference Jiang, Huang, Cai, Xu and Lian2021; Jiang and Morgan Reference Jiang and Morgan2004; Pompon et al. Reference Pompon, Louerat, Bronine and Urban1996). To investigate whether amino acid mutations alter the metabolic capacity of P450 enzymes toward model substrates or herbicides, this study will utilize the WAT11 yeast expression system to heterologously express CYP96A146 derived from both S and TR D. sophia biotypes. Furthermore, the metabolic activity of heterologously expressed CYP96A146 will be systematically evaluated against a range of model substrates and herbicides.
Materials and Methods
PCR Amplification of the Full-length CYP96A146-S/R Gene
Frozen seedlings from S (pSD8) or TR (pN11) D. sophia populations were ground to a fine powder in liquid nitrogen using a mortar and pestle. Total RNA was extracted using the RNAprep Pure Plant Total RNA Extraction Kit (TIANGEN, Beijing, China) according to the manufacturer’s protocol. The cDNA was synthesized from the extracted RNA using the FastKing First-Strand cDNA Synthesis Kit (TIANGEN).
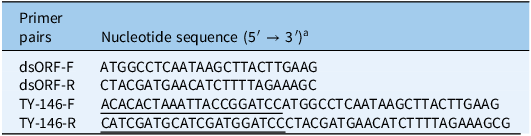
A pair of specific primers, dsORF-F and dsORF-R, was designed based on the reference sequences of CYP96A146-R (NCBI accession: MF152630.1) and CYP96A146-S (MF152629.1) (Table 1). PCR amplification was performed in a 50-μl reaction mixture containing 1 μl of cDNA, 1.25 μl of each primer, 25 μl of 2× Amplification Mix, and 21.5 μl of nuclease-free ddH2O. PCR was run per the following program: denaturation at 94 C for 2 min, 30 cycles of 98 C for 10 s, 60 C for 30 s, and 68 C for 30 s, followed by an extension step of 5 min at 68 C.
Information on primer pairs used for amplification of CYP96A146-S/R gene with full-length or BamHI restriction site.

Table 1. Long description
A table titled ‘Information on primer pairs used for amplification of CYP96A146-S/R gene with full-length or BamHI restriction site’ contains two columns and four rows. The first column is labeled ‘Primer pairs’ and the second column is labeled ‘Nucleotide sequence (5’ to 3’)’. The rows list the primer pairs and their corresponding nucleotide sequences. Row 1: dsORF-F, ATGGCCTCAATAAGCTTACTTGAAG. Row 2: dsORF-R, CTACGATGAACATCTTTTAGAAAGC. Row 3: TY-146-F, ACACACTAAATTACCGGATCCATGGCCTCAATAAGCTTACTTGAAG. Row 4: TY-146-R, CATCGATGCATCGATGGATCCCTACGATGAACATCTTTTAGAAAGC.
a Underlined bases are the homologous sequence at the end of the linearized vector pYeDP60S - line.
The PCR products were separated by 1% agarose gel electrophoresis. Target DNA bands were excised and purified from the gel. The purified fragments were ligated into the pLB vector using the pLB Zero Background Fast Cloning Kit (TIANGEN) and transformed into Escherichia coli TOP10-competent cells. Positive clones were identified by Sanger sequencing, and recombinant plasmids were extracted from the validated transformants for subsequent use.
Vector Construction and Saccharomyces cerevisiae Transformation of P450
The CYP96A146-S or CYP96A164-R gene was amplified with flanking sequences homologous to the terminal regions of the linearized pYeDP60S vector. The primers TY-146-F and TY-146-R were designed to incorporate BamHI restriction sites, using the plasmid pLB-CYP96A146-S/R as a template (Table 1). The PCR was performed in a 50-μl reaction mixture containing 2 μl of template DNA, 2 μl of each primer, 25 μl of 2× Amplification Mix, and 19 μl of nuclease-free ddH2O. PCR was run per the following program: denaturation at 94 C for 3 min, 30 cycles of 94 C for 30 s, 58 C for 30 s, and 72 C for 2 min, followed by an extension step of 5 min at 72 C.
The pYeDP60S vector was digested with BamHI restriction enzyme at 37 C for 5 min. The amplified CYP96A146-S and CYP96A164-R fragments were subsequently cloned into the linearized pYeDP60S vector using the Hieff Clone® Plus Multi One Step Cloning Kit (Yeasen, Shanghai, China) to generate the recombinant CYP96A146-pYeDP60S construct. The resulting plasmids were transformed into E. coli TOP10-competent cells, and positive clones were verified by Sanger sequencing.
Recombinant plasmid CYP96A146-pYeDP60S was transformed into S. cerevisiae WAT11-competent cells (Coolaber, Beijing, China), selected on SD-Ura solid medium, and validated by Sanger sequencing.
Optimization of P450 Expression in Saccharomyces cerevisiae
Positive clones were selected and inoculated into 30 ml of SD-Ura liquid medium, followed by incubation at 29 C with shaking at 180 rpm for 54 h. The optical density at 600 nm (OD600) of the culture was measured every 6 h throughout the incubation period. The optimal growth phase of S. cerevisiae was determined based on the OD600 measurements.
The optimal induction period for CYP96A146 expression was determined according to total protein content. Aliquots of 150 μl of cells from each S. cerevisiae strain, normalized to the same OD600 value, were transferred into 30 ml of SG/-Ura liquid medium and cultured under the same conditions (29 C, 180 rpm) for 36 h. Cells were harvested by centrifugation at 5,000 × g for 5 min at 4 C, resuspended in 100 ml of SG/-Ura medium without galactose, and incubated with shaking for 5 h. Subsequently, galactose was added to a final concentration of 20 g L−1 to induce CYP96A146 expression.
Cell pellets were collected at 0, 6, 12, 18, 24, and 30 h after induction by centrifugation at 5,000 × g for 5 min. Total protein content was quantified using the Bradford method (Bradford Reference Bradford1976) with bovine serum albumin as the standard.
Three biological replicates of each yeast strain were set in growth and galactose induction experiments.
Extraction of P450 from Saccharomyces cerevisiae
The yeast cells were washed twice with 10 ml of pre-chilled TEK buffer, followed by centrifugation at 5,000 × g for 5 min at 4 C to remove residual growth medium and excess buffer. After the supernatant was discarded, the pellet was resuspended in 2 ml of ice-cold suspension buffer. The cell suspension was transferred to a 10-ml centrifuge tube containing 0.5 g of glass beads and subjected to mechanical disruption by vortexing at maximum speed for 30 s, followed by 30 s on ice. This cycle was repeated 20 times to ensure complete cell lysis.
The lysate was then treated ultrasonically for 15 s in an ice-cold water bath, followed by 45 s on ice, with a total of 5 cycles. The resulting mixture was transferred to a new 10-ml tube, and the beads were rinsed with 2 ml of suspension buffer. The rinse was combined with the primary lysate. The pooled extract was centrifuged at 8,000 × g for 25 min at 4 C, and the supernatant was collected. Further ultracentrifugation was performed at 30,000 × g for 60 min at 4 C. The final supernatant was discarded, and the pellet containing the microsomal fraction enriched with P450 proteins was resuspended in 1 ml of resuspension buffer and stored at −80 C.
All P450 extractions of each yeast strain were performed in three biological replicates, which were subsequently used for P450 content determination, as well as for metabolism assays with model substrates and herbicides.
Determination of P450 Content in Saccharomyces cerevisiae Extracts
The P450 content was quantified using reduced carbon monoxide (CO)-difference spectroscopy with a dual-beam spectrophotometer (UV2600i, Shimadzu, Kyoto, Japan) (Murakami et al. Reference Murakami, Yabusaki and Ohkawa1986). The microsomal extract containing P450 was diluted with 0.1 mol L−1 phosphate buffer (pH 7.5) to a final protein concentration of 1.0 mg ml−1. Subsequently, 4 to 5 mg of sodium dithionite was added to the diluted extract. After incubation for 5 min, the reduced sample was equally divided into two cuvettes serving as reference and sample cells. An initial baseline was recorded between the two cells.
Carbon monoxide was bubbled through the sample cell for 1 min, followed by a 10-min incubation to allow complete complex formation between CO and reduced P450. A full-wavelength scan from 390 nm to 500 nm was then performed. The P450 content was calculated using the formula 1 with a millimolar extinction coefficient of 91 mM−1 cm−1. The C represents the concentration of total proteins.
 ${\rm{P}}450{\rm{\;content}}\,{\rm{(nmol}}/{\rm{mg\;protein}}) = {{{\rm{(O}}{{\rm{D}}_{{\rm{450}}}} - {\rm{O}}{{\rm{D}}_{{\rm{490}}}}{\rm{)}}\times1,000} \over {91 \times C}}$
Assays for p-Nitroanisole (PNOD) O-Demethylase Activity
A 1,950-μl Tris-HCl reaction mixture (41.0 mM, pH 7.5) containing PNOD (1.03 mM, first dissolved in dimethylsulfoxide [DMSO]) and 1.0 ml of P450 microsomal extract was pre-incubated at 30 C for 3 min. Thereafter, the reaction was triggered by adding 50 μl of 10 mM NADPH (0.256 mM final), followed by shaking incubation at 30 C for 20 min. The reaction was terminated with 40 μl of concentrated HCl.
Subsequently, 5 ml of chloroform was added to extract the product p-nitrophenol. The mixture was vortexed vigorously and allowed to stand for 3 to 5 min. After centrifugation at 3,800 × g for 15 min at 4 C, 3 ml of the chloroform phase was collected and mixed with an equal volume of 0.5 M NaOH. The mixture was shaken at 250 rpm and 30 C for 15 min to back-extract the product into the NaOH layer. Following phase separation, the NaOH layer was carefully removed, and its absorbance was measured at 400 nm using a microplate reader MK3 (Thermo Fisher Scientific). A standard curve prepared with p-nitrophenol was used for quantification, with 0.5 M NaOH serving as the blank control.
PNOD activity was expressed as nanomole p-nitrophenol produced per minute per milligram of protein (nmol min−1 mg protein−1), in accordance with the method described by Rose et al. (Reference Rose, Barbhaiya, Roe, Rock and Hodgson1995). The PNOD O-demethylase activity for each P450 protein extract is calculated according to Equation 2.
 $v\left( {{\rm{PNOD}}} \right) = {{{C_1} \times {V_1}} \over {{C_2} \times {V_2} \times t}}$
In Equation 2, v represents the PNOD O-demethylase activity; C 1 and C 2 represent the concentration of p-nitrophenol (pmol L−1) and protein concentration (mg ml−1), respectively; V 1 and V 2 represent the volume of reaction solution (L) and protein solution (ml), respectively; t is the reaction time (min).
Assays for Methoxyresorufin (MROD) O-Demethylase Activity
A 2,000-μl Tris-HCl reaction mixture (70 mM, pH 7.5) containing 0.50 mM MROD (first dissolved in DMSO) and 500 μl of P450 microsomal extract was pre-incubated at 30 C for 3 min, and then the reaction was initiated by adding 50 μl of 10 mM NADPH (final concentration: 0.25 mM). The reaction mixture was continuously incubated with shaking at 30 C for 20 min. The fluorescence of the resulting resorufin was immediately quantified using a Shimadzu RF-6000 fluorescence spectrophotometer with excitation and emission wavelengths set at 530 nm and 595 nm, respectively (both with 3-nm slit widths).
Resorufin concentration was determined using a standard curve, and enzyme activity was expressed as picomole resorufin produced per minute per milligram of protein (pmol min−1 mg protein−1). The MROD O-demethylase activity of each P450 protein extract is calculated according Equation 3 (Scott et al. Reference Scott, Lee and Shono1990).
 $v\left( {{\rm{MROD}}} \right) = {{{C_1} \times {V_1}} \over {{C_2} \times {V_2} \times t}}$
In Equation 3, v represents the MROD O-demethylase activity; C 1 and C 2 represent the concentration of resorufin (pmol L−1) and protein concentration (mg ml−1), respectively; V 1 and V 2 represent the volume of reaction solution (L) and protein solution (ml), respectively; t is the reaction time (min).
Assays for Ethoxyresorufin (EROD) O-Deethylase Activity
A 2,000-μl Tris-HCl reaction mixture (70 mM, pH 7.5) containing 0.50 mM EROD (first dissolved in DMSO) and 500 μl of P450 microsomal extract was pre-incubated at 30 C for 3 min, after which the reaction was triggered by adding 50 μl of 10 mM NADPH (final concentration: 0.25 mM). The reaction mixture was then shaken continuously at 30 C for 20 min. The fluorescence intensity of the product, resorufin, was immediately measured using a Shimadzu RF-6000 fluorescence spectrophotometer configured with an excitation and emission wavelengths of 530 nm and 595 nm, respectively (both with 3-nm slit widths).
Resorufin concentration was quantified based on a standard curve, and enzyme activity was expressed as picomole of resorufin generated per minute per milligram of protein (pmol min−1 mg protein−1). The EROD O-deethylase activity of each protein is calculated according to Equation 4 (Wang et al. Reference Wang, Li, Lv, Lou and Dong2013).
 $v\left( {{\rm{EROD}}} \right) = {{{C_1} \times {V_1}} \over {{C_2} \times {V_2} \times t}}$
In Equation 4, v represents the EROD O-deethylase activity; C 1 and C 2 represent the concentration of resorufin (pmol L−1) and protein concentration (mg ml−1), respectively; V 1 and V 2 represent the volume of reaction solution (L) and protein solution (ml), respectively; t is the reaction time (min).
Assays for 7-Ethoxycoumarin (ECOD) O-Deethylase Activity
A 1,650-μl Tris-HCl reaction mixture (48.5 mM, pH 7.5) containing 1.21 mM ECOD (first dissolved in absolute ethanol) and 700 μl of P450 microsomal extract was pre-incubated at 30 C for 3 min, and the reaction was triggered by adding 50 μl of 10 mM NADPH (final concentration: 0.303 mM). The reaction proceeded continuously at 30 C for 20 min and was then terminated with 300 μl of 50% (v/v) acetonitrile. The fluorescence of the product, 7-hydroxycoumarin, was immediately quantified using a Shimadzu RF-6000 fluorescence spectrophotometer with excitation and emission wavelengths of 368 nm and 455 nm, respectively (both with 5-nm slit widths).
The product concentration was determined using a standard curve of 7-hydroxycoumarin, and enzyme activity was expressed as picomole of 7-hydroxycoumarin produced per minute per milligram of protein (pmol min−1 mg protein−1). The ECOD O-deethylase activity of each protein is calculated according to Equation 5 (Wang et al. Reference Wang, Li, Lv, Lou and Dong2013).
 $v\left( {{\rm{ECOD}}} \right) = {{{C_1} \times {V_1}} \over {{C_2} \times {V_2} \times t}}$
In Equation 5, v represents the ECOD O-deethylase activity; C 1 and C 2 represent the concentration of 7-hydroxycoumarin (pmol L−1) and protein concentration (mg ml−1), respectively; V 1 and V 2 represent the volume of reaction solution (L) and protein solution (ml), respectively; t is the reaction time (min).
Assays for Benzo[a]pyrene Arylalkyl Hydroxylase (AHH) Activity
The 1,903-μl Tris-HCl (717 mM, pH 7.5) reaction mixture consisted of 3 μl of 2 mM benzo[a]pyrene (dissolved in acetone, 3.07 × 10⁻³ mM) and 500 μl of P450 microsomal extract. After pre-incubation at 30 C for 3 min, the reaction was initiated by adding 50 μl of 10 mM NADPH (0.256 mM) and incubated with shaking at 30 C for 20 min. The fluorescence of the benzo[a]pyrene was immediately measured using a Shimadzu RF-6000 fluorescence spectrophotometer with excitation and emission wavelengths set at 385 nm and 406 nm, respectively (both with 3-nm slit widths). Metabolites of benzo[a]pyrene were expressed as the reduction amount of benzo[a]pyrene.
Enzyme activity was expressed as picomole of benzo[a]pyrene metabolized per minute per milligram of protein (pmol min−1 mg protein−1). The benzo[a]pyrene arylalkyl hydroxylase activity of each protein is calculated according to Equation 6.
 $v\left( {{\rm{AHH}}} \right) = {{{C_1} \times {V_1}} \over {{C_2} \times {V_2} \times t}}$
In Equation 6, v represents the AHH arylalkyl hydroxylase activity; C 1 and C 2 represent the concentration of metabolites of benzo[a]pyrene (pmol L−1) and protein concentration (mg ml−1), respectively; V 1 and V 2 represent the volume of reaction solution (L) and protein solution (ml), respectively; t is the reaction time (min).
Metabolic Reaction of P450 to Herbicides and Pretreatment of Metabolic Samples
Previous findings from our group demonstrated that Arabidopsis transferring CYP96A146-S/R gene showed marked metabolic activity toward tribenuron-methyl (acetolactate synthase [ALS] inhibitor) and carfentrazone-ethyl (protoporphyrinogen oxidase inhibitor). Therefore, these two herbicides were retained in the present study, along with an additional ALS-inhibiting herbicide, bensulfuron-methyl.
The 1,262 μl phosphate-buffered saline (pH 7.4) contained the herbicide solution (9.51 × 10⁻² mg L−1) and 1 ml of CYP96A146 microsomal extract. The reaction was initiated by adding 50 μl of 3 mM NADPH (final concentration: 0.119 mM). Aliquots of 200 μl were collected at 0, 15, 30, 60, and 90 min to monitor herbicide metabolism. To terminate the reaction, 5 ml of acetonitrile was added to each aliquot, followed by vortexing for 3 min. Subsequently, 0.5 g of NaCl was added, and the mixture was vigorously shaken for 2 min and centrifuged at 5,000 × g for 5 min. A 1-ml portion of the acetonitrile layer was transferred to a 2-ml centrifuge tube, mixed with 50 mg of MgSO4, and vortexed for 1 min. After centrifugation at 12,000 × g for 3 min, 1 ml of the supernatant was filtered through a 0.22-μm syringe filter and subjected to liquid chromatography–tandem mass spectrometry (LC-MS/MS) analysis.
Validation of LS-MS/MS Methods
Herbicide quantification was performed using an LC-MS/MS system (Agilent 1290 Infinity II coupled with a 6470 triple quadrupole mass spectrometer; Agilent Technologies, Santa Clara, CA, USA) equipped with an electrospray ionization source. Chromatographic separation was achieved on a Shim-pack GIST C18 column (50 mm by 2.1 mm, 2-μm particle size, Shimadzu, Kyoto, Japan) maintained at 40 C.
The analytical method was validated for linearity, recovery, and precision. Linearity was assessed by analyzing working standard solutions of tribenuron-methyl, bensulfuron-methyl, or carfentrazone-ethyl at concentrations of 0.001, 0.005, 0.01, 0.05, 0.1, and 0.5 mg L−1, followed by linear regression analysis. Precision was expressed as the relative standard deviation (RSD, %) derived from recovery studies using matrix-spiked samples (n = 4) at fortification levels of 0.05, 0.1, and 0.2 mg L−1. Both spiked and unspiked samples underwent identical extraction, cleanup, and LC-MS/MS analysis procedures.
LC-MS/MS Analysis of Herbicides
The LC-MS/MS analysis was conducted in multiple reactions monitoring (MRM) mode. For tribenuron-methyl and bensulfuron-methyl, the optimized MRM transitions were m/z 396.2 → 155.1 and m/z 411.1 → 149.1, respectively. The mobile phase consisted of 30% water containing 0.1% (v/v) formic acid and 70% methanol, delivered at a flow rate of 0.6 ml min−1.
For carfentrazone-ethyl, the MRM transition was set to m/z 412.0 → 366.0. The corresponding mobile phase was composed of 30% water containing 5 mM ammonium acetate and 70% methanol, with a flow rate of 0.5 ml min−1.
Molecular Docking
The composite structure of the Protein (simulated protein and the heme iron–porphyrin complex) was generated using an open-source method that replicates the performance and methodology of AlphaFold3. The obtained structure was subsequently energy minimized using Rosetta Relax (https://hub.docker.com/r/rosettacommons/rosetta). Preprocessing of the acquired 3D protein structure, including the removal of water molecules and the addition of hydrogen atoms, was performed using PyMOL (https://www.pymol.org/pymol.html).
The protein receptor structure was preprocessed in AutoDockTools (ADT, https://autodock.scripps.edu/), which involved adding missing hydrogen atoms and assigning Gasteiger-Marsili charges. Concurrently, the small-molecule ligand was imported into ADT, where atom type assignment and charge allocation were performed sequentially. A docking grid box covering the vicinity of the protein’s HEM site was then defined using the Grid module. The docking procedure was executed with AutoDock Vina v. 1.2.7, with the number of docking runs set to 20. The final docking results were evaluated based on the binding energy predicted by AutoDock Vina, which utilizes the AMBER empirical force field. The conformation with the lowest binding energy was selected as the output complex structure. The interaction forces between the small molecule and the protein were analyzed using PLIP (https://plip-tool.biotec.tu-dresden.de/plip-web/plip/index), and the three-dimensional interaction networks were visualized with PyMOL.
Results and Discussion
Optimization of CYP96A146-S/R Expression in Saccharomyces cerevisiae
Sequencing analysis confirmed that the amino acid sequences of CYP96A146-S and CYP96A146-R recombinantly expressed in S. cerevisiae were identical to their original sequences, indicating that the CYP96A146-pYeDP60S plasmid was successfully constructed and transformed into the WAT11 strain (Supplementary Figure S1).
To achieve high-level expression of CYP96A146-S and CYP96A146-R in S. cerevisiae, the optimal durations for yeast cultivation and galactose induction were investigated. The growth of the three S. cerevisiae strains exhibited a lag phase within the first 12 h, followed by exponential growth between 12 and 30 h, and reached a plateau after 36 h (Supplementary Figure S2). Based on these kinetics, 36 h was selected as the optimal cultivation period for all strains. Furthermore, the total protein concentrations in S. cerevisiae expressing CYP96A146-S, CYP96A146-R, or the empty vector control (KZ) peaked at 18 h after galactose induction, reaching values of 7.398, 7.954, and 7.825 mg ml−1, respectively (Supplementary Figure S3).
Reduced CO-Difference Spectrum and Quantification of P450
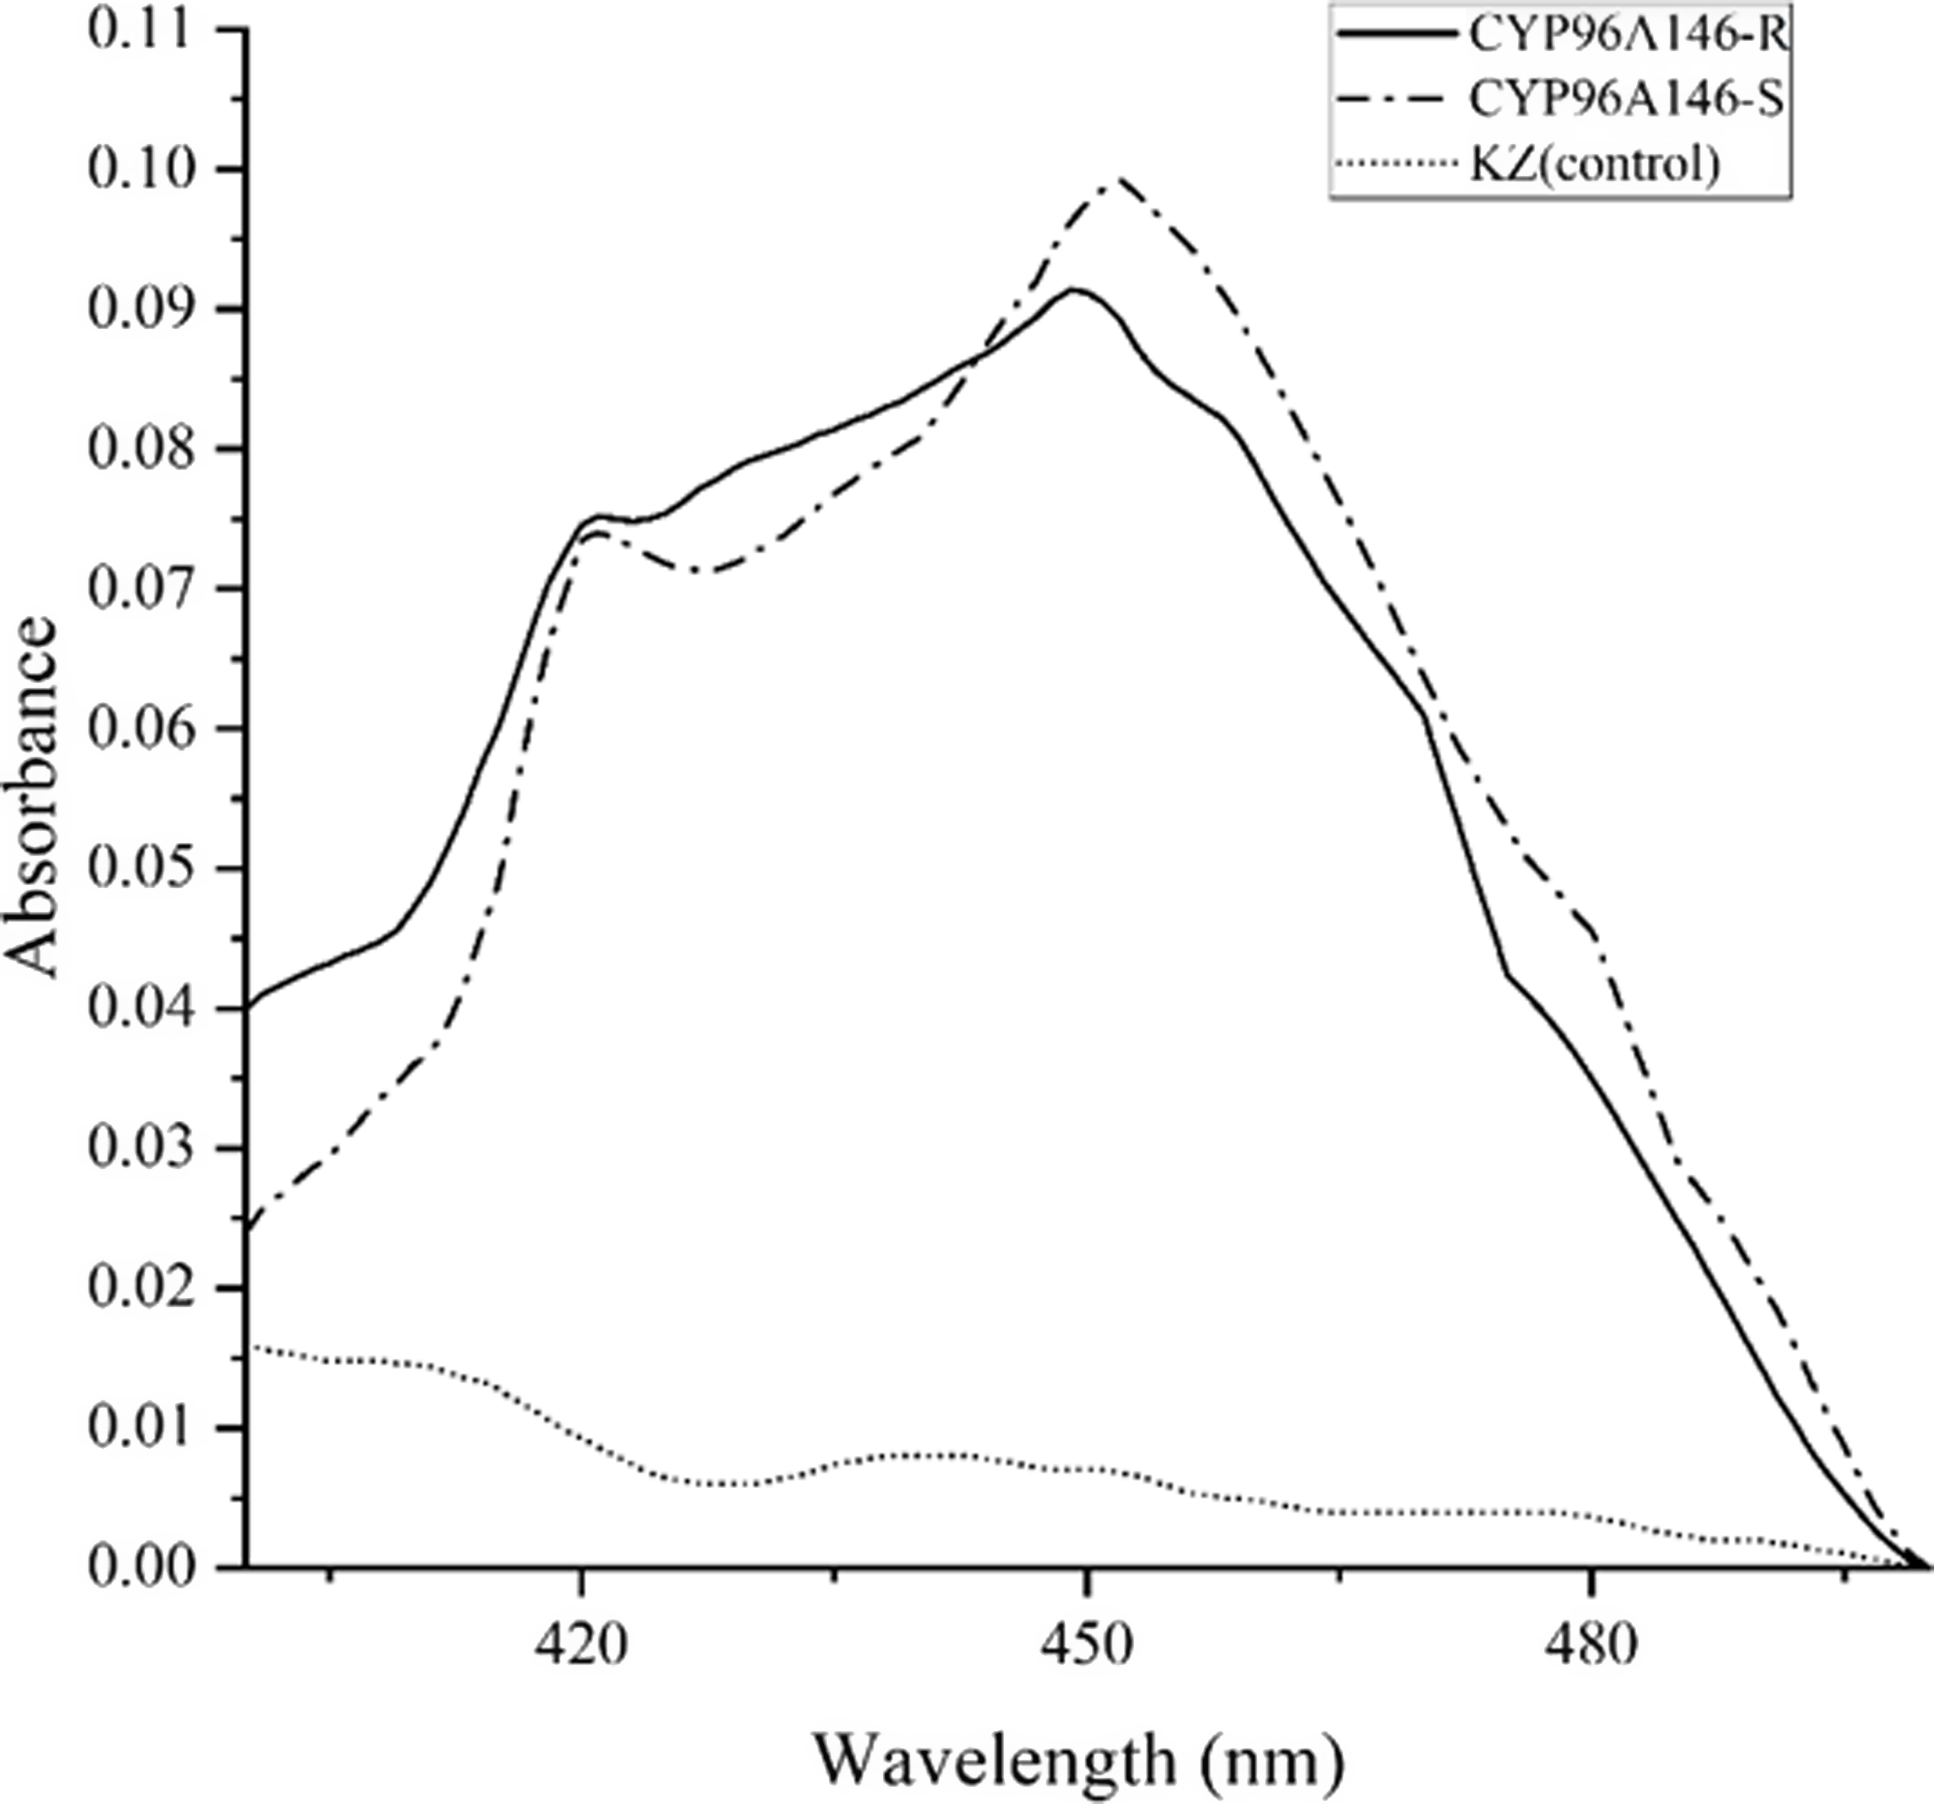
The characteristic absorption peak at λ = 450 nm, resulting from the binding of reduced P450 with CO, is a key feature of P450 enzymes. Furthermore, it serves as an important indicator for P450 identification. The characteristic absorption peak indicated that CYP96A146-S and CYP96A146-R were expressed successfully in S. cerevisiae. In contrast, no P450 expression was detected in the control KZ extract (Figure 1).
Reduced CO-difference spectra of P450 microsomes prepared from Saccharomyces cerevisiae expressing the empty vector (KZ) or the CYP96A146-S or CYP96A146-R gene.

Under optimized conditions, both CYP96A146-S and CYP96A146-R were highly expressed, yielding P450 contents of 0.416 and 0.384 nmol mg−1 protein, respectively. However, no statistically significant difference was observed between the P450 levels of the two variants. In contrast, no P450 signal was detected in the S. cerevisiae strain expressing the empty vector (KZ) (Figure 1).
Catalytic Activity of CYP96A146 to Model Substrates
The results indicated that both CYP96A146-S and CYP96A146-R exhibited significant catalytic activity against all tested model substrates. Compared with the KZ control, the O-demethoxylation activity toward PNOD was the highest, with increases of 3.38- and 5.27-fold for CYP96A146-S and CYP96A146-R, respectively. In contrast, the lowest activity was against ECOD, with O-deethoxylation levels at only 1.07- and 1.20-fold above the control (Table 2). The CYP96A146-R variant showed significantly higher catalytic activity than CYP96A146-S toward the substrates of PNOD, MROD, EROD, and ECOD, with increases of 1.56-, 1.11-, 1.87-, and 1.11-fold, respectively. In contrast, the two variants displayed comparable activity levels toward benzo[a]pyrene.
Catalytic activity of empty vector (KZ), CYP96A146-S, and CYP96A146-R expressed heterologously in Saccharomyces cerevisiae to model substrates p-nitroanisole, methoxyresorufin, ethoxyresorufin, 7-ethoxycoumarin, and benzo[a]pyrene.

Table 2. Long description
A table comparing catalytic activity of different substrates with three variants. The table has 6 rows and 5 columns. The columns are labeled Model substrate, Catalytic reaction, Catalytic activity, KZ (control), CYP96A146-S, CYP96A146-R, and RR. The rows are labeled with different model substrates and their respective catalytic reactions. Row 1: p-Nitroanisole (PNOD), O-demethoxylation, 312.05 ± 21.06 c, 1055.05 ± 40.90 b, 1645.13 ± 32.43 a, 1.56. Row 2: Methoxyresorufin (MROD), O-demethoxylation, 284.12 ± 9.58 c, 371.56 ± 9.78 b, 412.52 ± 27.55 a, 1.11. Row 3: Ethoxyresorufin (EROD), O-deethoxylation, 6.80 ± 0.71 c, 17.95 ± 0.60 b, 33.49 ± 1.13 a, 1.87. Row 4: 7-Ethoxycoumarin (ECOD), O-deethoxylation, 352.81 ± 3.40 c, 379.23 ± 0.26 b, 423.22 ± 0.77 a, 1.12. Row 5: Benzo[a]pyrene, Arylalkyl hydroxylation, 101.91 ± 7.78 b, 260.06 ± 10.62 a, 241.20 ± 13.14 a, 0.93.
a Data with different letters in the same row indicate the catalytic activity is significantly different at level of P < 0.05.
b RR, the resistance ratio, is calculated by dividing the catalytic activity of CYP96A146- R by that of CYP96A146-S.
We also noted that although no P450 expression was detected in KZ, its extracts still exhibited some metabolic activity toward these substrates. This may be attributed to nonspecific activity from endogenous yeast enzymes or to natural degradation during in vitro incubation (Table 2). A similar phenomenon was also observed in the herbicide metabolism assays described in the following section.
Metabolism of Tribenuron-Methyl, Bensulfuron-Methyl, and Carfentrazone-Ethyl Mediated by P450
The spiked recoveries and RSDs of the three herbicides met the relevant requirements, indicating that the LC-MS/MS detection method is reliable (Supplementary Table S1; Supplementary Figure S4).
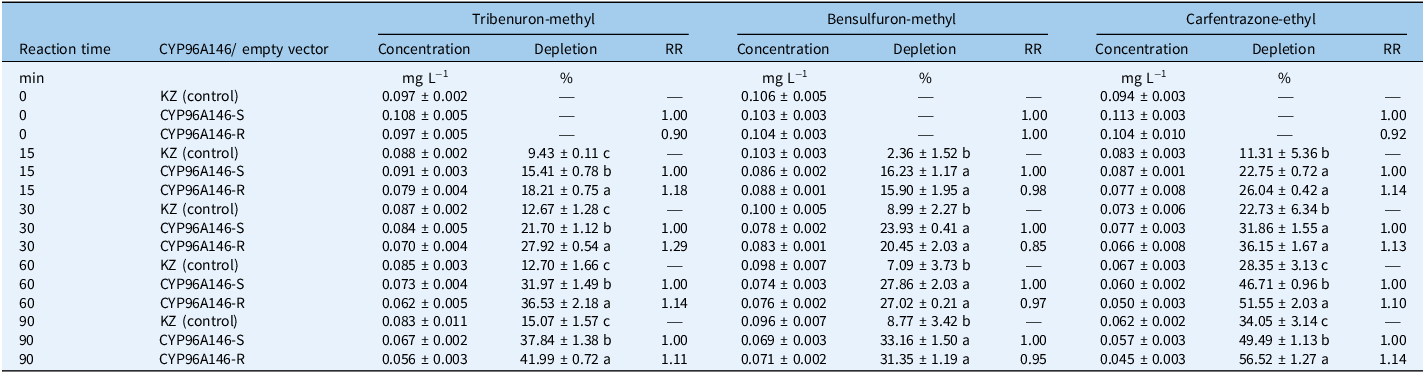
The results indicated that CYP96A146 exhibited significantly enhanced metabolic activity toward tribenuron-methyl, bensulfuron-methyl, and carfentrazone-ethyl, with substantially higher depletion than the empty vector control (KZ) at all times points (15, 30, 60, and 90 min) (Table 3).
Depletion of tribenuron-methyl, bensulfuron-methyl, and carfentrazone-ethyl over time by empty vector (KZ), CYP96A146-S, and CYP96A146-R expressed in Saccharomyces cerevisiae. a

Table 3. Long description
The table presents data on the depletion of tribenuron-methyl, bensulfuron-methyl, and carfentrazone-ethyl over time by empty vector (KZ), CYP96A146-S, and CYP96A146-R expressed in Saccharomyces cerevisiae. The table has 12 rows and 13 columns. The columns are labeled as Reaction time, CYP96A146/ empty vector, Concentration, Depletion, RR for each of the three chemicals. The rows are labeled with reaction times (0, 15, 30, 60, and 90 minutes) and the type of vector (KZ (control), CYP96A146-S, CYP96A146-R). Each cell contains specific values for concentration in mg L^-1, depletion in percent, and RR (relative rate). Notable trends include varying levels of depletion and relative rates for each chemical and vector combination over time.
a One-way ANOVA and independent sample t-tests are limited to comparisons between different P450s at the same time point; data with different letters indicate a significant difference at level of P < 0.05. Depletion is calculated as the difference between the initial and remaining herbicide concentrations, expressed relative to the initial concentration. RR, the resistance ratio, is calculated by dividing the depletion by that of CYP96A146-S.
Compared with CYP96A146-S, the CYP96A146-R variant exhibited significantly enhanced metabolic activity toward tribenuron-methyl at all tested time points, with depletion increases ranging from 1.11- to 1.29-fold. In contrast, significantly enhanced activity toward carfentrazone-ethyl was observed only at 60 (1.10-fold) and 90 (1.14-fold) min, while no obvious difference was detected during the first 15 and 30 min of reaction. For bensulfuron-methyl, no significant metabolic difference between the two variants was observed at any of the time points tested (Table 3).
Molecular Docking
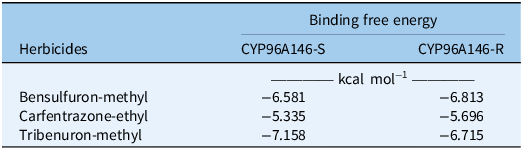
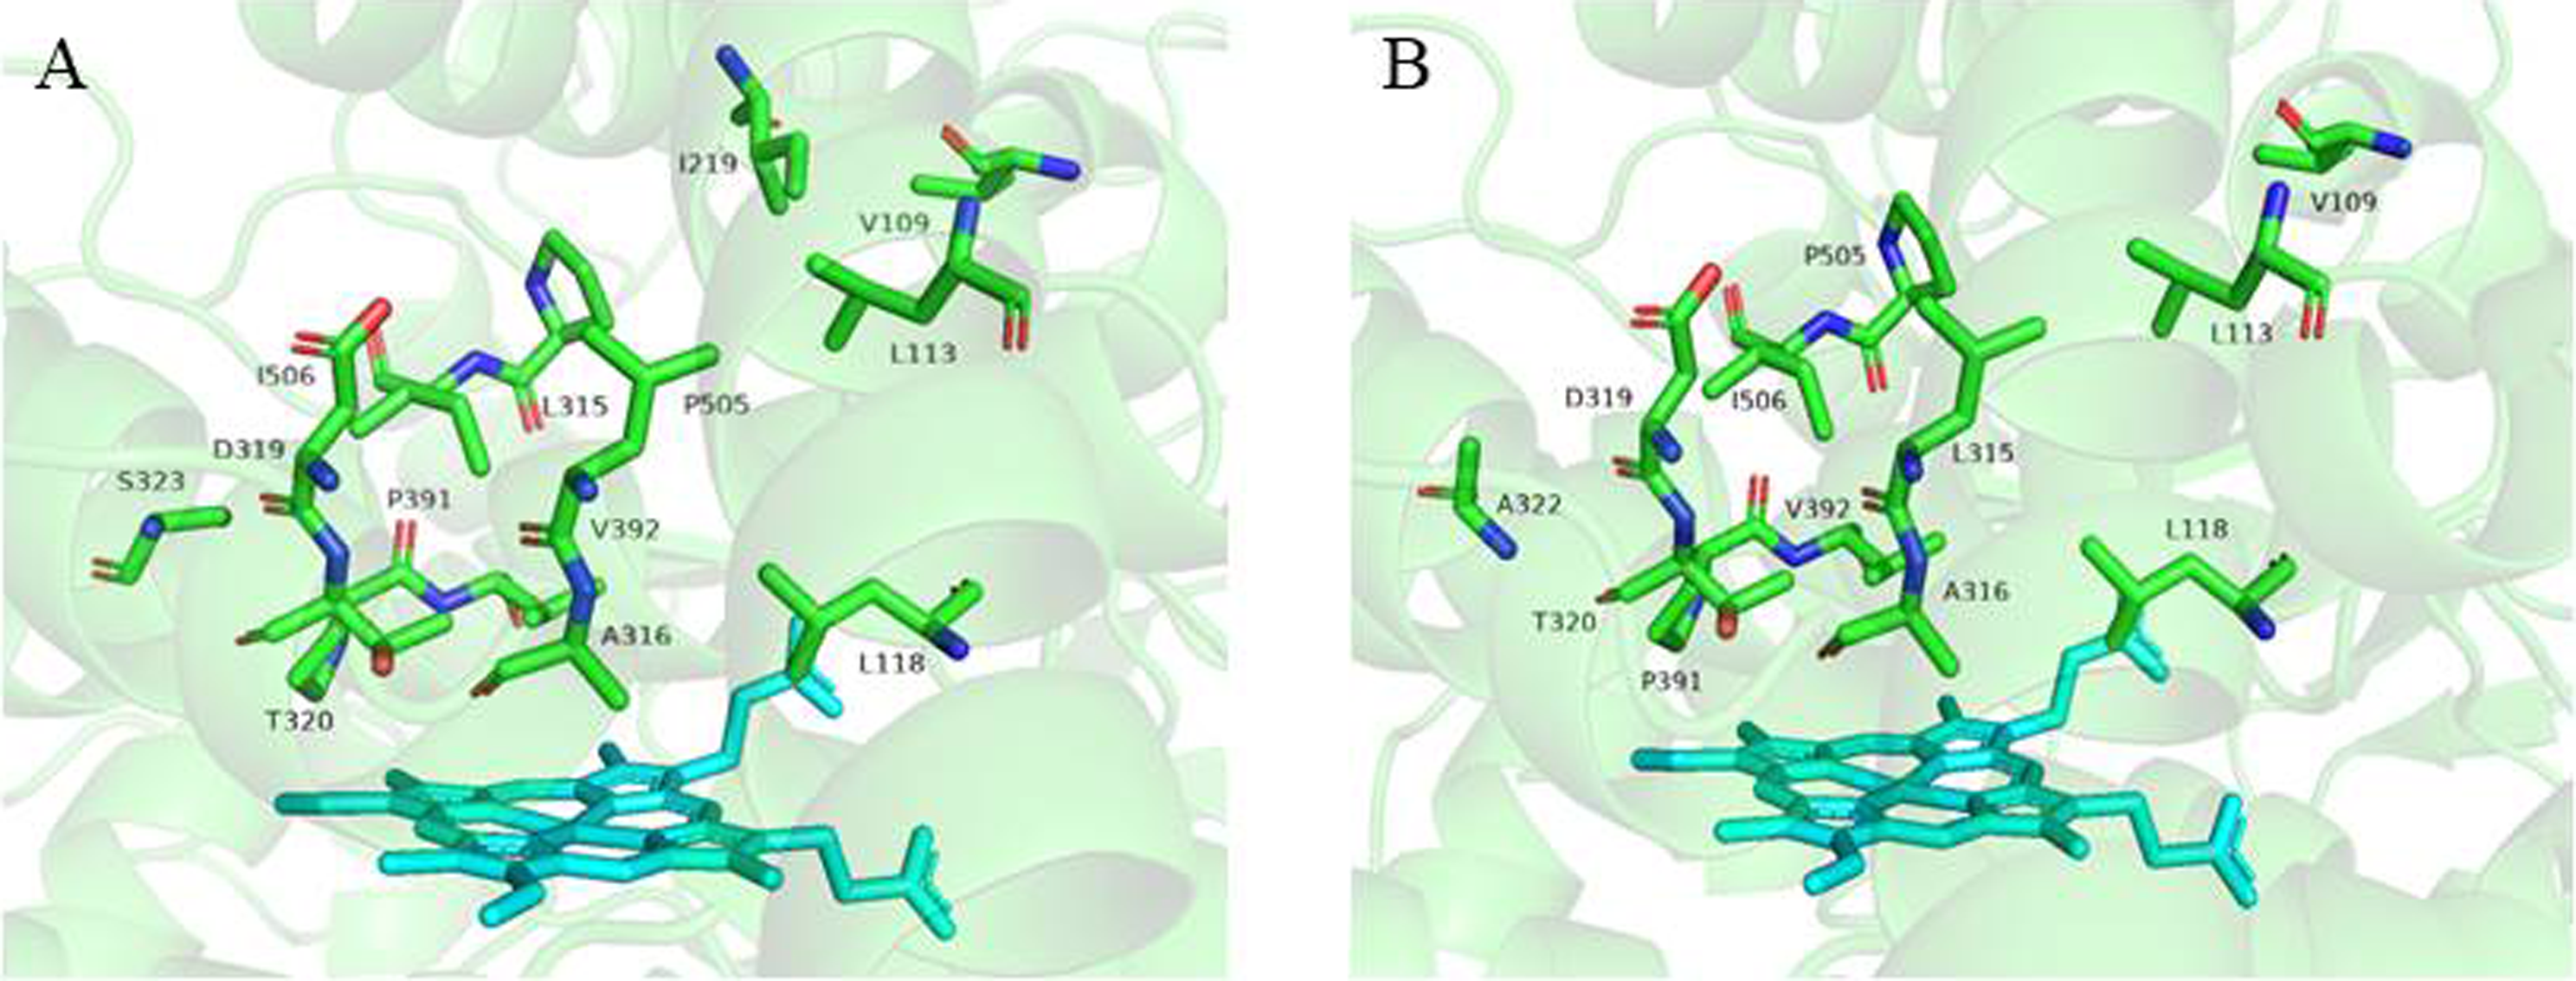
Compared with CYP96A146-S, CYP96A146-R exhibited no significant difference in binding free energy for the ligands of tribenuron-methyl, bensulfuron-methyl, and carfentrazone-ethyl (Table 4). However, the volume of its catalytic pocket was substantially enlarged, increasing approximately 24% from 870.01 Å3 in CYP96A146-S to 1077.25 ų in CYP96A146-R. Hydropathic analysis revealed that CYP96A146-R exhibits hydrophobic changes compared with CYP96A146-S at multiple discrete positions throughout the protein sequence, while the overall profiles remain largely similar (Supplementary Figure S5).
The binding free energy between the CYP96A146R/S and ligands of tribenuron-methyl, bensulfuron-methyl, and carfentrazone-ethyl.

Table 4. Long description
A table comparing the binding free energy of herbicides with CYP96A146-S and CYP96A146-R. The table has three rows and three columns. The columns are labeled ‘Herbicides’, ‘CYP96A146-S’, and ‘CYP96A146-R’. The row labels are ‘Bensulfuron-methyl’, ‘Carfentrazone-ethyl’, and ‘Tribenuron-methyl’. The values in the table are as follows: Row 1: Bensulfuron-methyl, -6.581, -6.813. Row 2: Carfentrazone-ethyl, -5.335, -5.696. Row 3: Tribenuron-methyl, -7.158, -6.715. The units for the binding free energy are kcal mol^-1.
Cytochrome P450s constitute a superfamily of heme-thiolate enzymes that are located primarily in the endoplasmic reticulum of plant cells. They play essential roles in the biosynthesis of various endogenous substances with critical physiological functions, including membrane sterols, phytohormones, signaling molecules, and structural biopolymers, among others (Hansen et al. Reference Hansen, Nelson, Moller and Werck-Reichhart2021; Schuler and Werck-Reichhart Reference Schuler and Werck-Reichhart2003). Additionally, P450s are involved in the detoxification of a wide range of exogenous compounds through diverse catalytic reactions such as hydroxylation, O-dealkylation, N-dealkylation, epoxidations, dealkylations, isomerizations, decarboxylations, and deaminations (Nelson and Werck-Reichhart Reference Nelson and Werck-Reichhart2011; Yuan et al. Reference Yuan, Tranel and Stewart2007).
Accumulating evidence indicates that P450s are widely involved in herbicide metabolism and metabolic resistance across various weed species. This phenomenon is particularly well documented in grass weeds, where multiple P450s from the CYP81A subfamily, such as CYP81A10v7 in L. rigidum and CYP81A12 and CYP81A21 in E. phyllopogon, have been shown to mediate resistance to herbicides with different modes of action (Han et al. Reference Han, Yu, Beffa, González, Maiwald, Wang and Powles2021; Iwakami et al. Reference Iwakami, Endo, Saika, Okuno, Nakamura, Yokoyama, Watanabe, Toki, Uchino and Inamura2014, Reference Iwakami, Kamidate, Yamaguchi, Ishizaka, Endo, Suda, Nagai, Sunohara, Toki, Uchino, Tominaga and Matsumoto2019). Similar mechanisms are being elucidated in broadleaf weeds. For instance, CYP72A254 from A. tuberculatus, CYP72A219 from Palmer amaranth (Amaranthus palmeri S. Watson), and CYP77B34 from D. sophia have been functionally validated to confer metabolic resistance to multiple herbicides (Dimaano et al. Reference Dimaano, Yamaguchi, Fukunishi, Tominaga and Iwakami2020; Ma et al. Reference Ma, Kaundun, Tranel, Riggins, McGinness, Hager, Hawkes, McIndoe and Riechers2013; Pan et al. Reference Pan, Yu, Wang, Han, Mao, Nyporko, Maguza, Fan, Bai and Powles2021; Shen et al. Reference Shen, Yang, Hao, Zhang, Li and Zheng2022).
In most documented cases of P450-mediated resistance, resistance is conferred mainly by quantitative changes in P450s (i.e., overexpression in resistant populations), rather than by qualitative changes such as beneficial amino acid mutations. However, it is well established in insects that specific amino acid mutations can significantly enhance the metabolic activity of P450s against insecticides, thereby conferring resistance. For example, three amino acid substitutions (Val-109-Ile, Asp-335-Glu, and Asn-384-Ser) in the CYP6P9b resistant allele of Anopheles funestus have been identified as key mutations conferring high metabolic efficiency against pyrethroids (Ibrahim et al. Reference Ibrahim, Riveron, Bibby, Irving, Yunta, Paine and Wondji2015). Similarly, a CYP6A2 variant carrying three point mutations (Arg-335-Ser, Leu-336-Val, and Val-476-Leu) is thought to confer DDT resistance in Drosophila melanogaster (Amichot et al. Reference Amichot, Tarès, Brun-Barale, Arthaud, Bride and Bergé2004). In contrast to the well-established role of amino acid mutations in insecticide resistance, this mechanism has not been conclusively demonstrated in P450-mediated herbicide resistance in weeds. Our previous research demonstrated that transgenic Arabidopsis expressing CYP96A146 with all four amino acid mutations simultaneously conferred higher resistance to tribenuron-methyl than those expressing the variant with any two or three mutations. Furthermore, no significant difference in resistance to tribenuron-methyl was observed between Arabidopsis lines expressing CYP96A146 with any single mutation and those expressing the CYP96A146-S variant (Shen et al. Reference Shen, Yang, Xu, Han, Li and Zheng2025). To avoid confounding effects from endogenous Arabidopsis P450s on tribenuron-methyl metabolism, the two CYP96A146 alleles were expressed in yeast. The results were consistent with previous findings, demonstrating that the CYP96A146-R variant exhibits stronger catalytic activity against the tribenuron-methyl than the CYP96A146-S variant (Table 3). Given the aforementioned results and the high sequence identity between the two CYP96A146 variants, it is reasonable to speculate that the amino acid mutations in CYP96A146-R are an important factor contributing to their differential metabolism toward tribenuron-methyl and carfentrazone-ethyl. The molecular docking demonstrated that amino acid substitutions enlarge the catalytic pocket in CYP96A146-R, thereby increasing the probability of collisions between the enzyme and these herbicides (Figure 2). Additionally, amino acid mutations could lead to localized remodeling of the hydropathy profiles of CYP96A146-R and CYP96A146-S. Although the overall hydrophobicity patterns are highly similar, CYP96A146-R exhibits hydrophobic changes at multiple discrete positions (indicated by black lines in Supplementary Figure S5). These localized hydrophobic changes may induce the following structural effects: (1) modulating the microenvironment of substrate access channels, potentially affecting the kinetics of substrate entry into the active site; and (2) altering the conformational flexibility of the active site, which may influence catalytic efficiency or product release rates. Collectively, these spatial conformational changes may affect the metabolic capacity of CYP96A146 to herbicides.
Structure of the catalytic pocket and heme in CYP96A146-S (A) and CYP96A146-R (B).

Additionally, the two CYP96A146 variants were shown to catalyze O-demethoxylation, O-deethoxylation, and arylalkyl hydroxylation reactions. Notably, three herbicides (tribenuron-methyl, bensulfuron-methyl, and carfentrazone-ethyl) contain a benzene ring, and both tribenuron-methyl and bensulfuron-methyl possess a nitrogen heterocycle with one or two methoxy groups. Given these structural features and the observed catalytic activities, we infer that CYP96A146 likely metabolizes the three herbicides primarily via O-demethoxylation of the methoxy groups and arylalkyl hydroxylation of the aromatic rings. These types of metabolic reactions have also been documented for other P450 enzymes. For example, the heterologously expressed CYP81A12 and CYP81A21 proteins, originally cloned from E. phyllopogon, were shown to metabolize bensulfuron-methyl through Odemethylation in yeast (Iwakami et al. Reference Iwakami, Endo, Saika, Okuno, Nakamura, Yokoyama, Watanabe, Toki, Uchino and Inamura2014). Similarly, transgenic rice lines overexpressing B. syzigachne CYP81Q32 were found to metabolize mesosulfuron-methyl via O-demethylation (Wang et al. Reference Wang, Lian, Qi, Fang, Nypork, Yu, Bai and Pan2023). In addition, rice seedlings overexpressing E. crus-galli CYP81A68 metabolize penoxsulam through O-demethylation (Pan et al. Reference Pan, Guo, Wang, Shi, Yang, Zhou, Yu and Bai2022). In addition, these three herbicides or their intermediate metabolites may undergo de-esterification catalyzed by esterases, resulting in the corresponding parent acids, which are herbicidally inactive. De-esterification is an important degradation or detoxification mechanism of sulfonylurea herbicide in microbes and plants. For example, the esterase (SulE), which was cloned from Hansschlegelia zhihuaiae S113, can catalyze the de-esterification of a variety of sulfonylurea herbicides (Hang et al. Reference Hang, Hong, Xie, Huang, Wang, He and Li2012). Carboxylesterase catalyzes the de-esterification to degrade chlorimuron-ethyl in Rhodococcus erythropolis D310-1 (Zang et al. Reference Zang, Wang, Miao, Cheng, Zhang, Liu, Sun, Wang and Li2020). Soybean tolerance to thifensulfuron-methyl results from rapid de-esterification to inactive free acid (Walker et al. Reference Walker, Hatzios and Wilson1994). Once herbicides enter weeds or plants, they are degraded into metabolites having low or no toxicity through several metabolic stages involving multiple enzymes. Nevertheless, the order and patterns of these enzymes in the metabolic pathway are not well defined. Consequently, it is unknown whether O-demethoxylation, arylalkyl hydroxylation, or de-esterification occur sequentially or in random order. However, the specific reaction types and the sites of metabolic reactions require further validation through structural identification of the metabolites.
Supplementary material
To view supplementary material for this article, please visit https://doi.org/10.1017/wsc.2026.10130
Acknowledgments
The pYeDP60S plasmid was provided by Yanhui Wang, Academy of Agricultural Sciences of Guangxi Province.
Funding statement
This research received no specific grant from any funding agency or the commercial or not-for-profit sectors.
Competing interests
The authors declare no conflicts of interest.



 Open access

