Implications
Feline obesity is increasing, and one of the risk factors for obesity in female cats is ovariohysterectomy. High-protein (HP) diets have been utilized in felines to promote weight loss while maintaining lean body mass and to control diabetes, and have been shown in rodents and humans to modify satiety and food intake. This study evaluated the use of a HP diet to ameliorate post-ovariohysterectomy weight gain in cats. Our results indicate that a HP diet did not ameliorate weight gain, but did result in changes in adipose and skeletal muscle gene expression that may be of interest in future studies.
Introduction
Obesity is a widespread problem in domestic cat populations of developed countries. It is estimated that 25% to 34% of cats are overweight or obese (Scarlett et al., Reference Scarlett, Donoghue, Saidla and Wills1994; Donoghue and Scarlett, Reference Donoghue and Scarlett1998; Allan et al., Reference Allan, Pfeiffer, Jones, Esslemont and Wiseman2000; Lund et al., Reference Lund, Armstrong, Kirk and Klausner2005; Freeman et al., Reference Freeman, Abood, Fascetti, Fleeman, Michel, Laflamme, Bauer, Kemp, Van Doren and Willoughby2006). As in humans, feline obesity leads to hyperlipidemia, insulin resistance and glucose intolerance. The main risk factors for feline obesity are middle age and ovariohysterectomy or neutering (Scarlett et al., Reference Scarlett, Donoghue, Saidla and Wills1994; Donoghue and Scarlett, Reference Donoghue and Scarlett1998; Robertson, Reference Robertson1999; Lund et al., Reference Lund, Armstrong, Kirk and Klausner2005). Middle-aged cats (5 to 11 years of age) appear to have the highest risk of developing obesity (Lund et al., Reference Lund, Armstrong, Kirk and Klausner2005). Although neutering increases the risk of obesity, the benefits of controlling pet overpopulation outweigh this risk.
Authors often report that ovariohysterectomized cats have decreased metabolic energy requirements, increased food intake and altered blood hormone concentrations, but without explanation. Research aimed at identifying mechanisms responsible for increased feline obesity following ovariohysterectomy or neutering, and the influence diet may have on its development, has been limited. Measuring changes in gene transcripts (mRNA) may identify key mechanisms by which neutering influences energy homeostasis and targets for dietary intervention.
The effects of dietary composition on appetite, body composition and tissue gene expression in rodents and humans are well documented, but similar data are lacking in the cat. HP diets increase satiety response, which has been attributed to increased hormone concentrations, including glucagon like peptide-1 and cholecystokinin that are known to curb appetite (Liddle et al., Reference Liddle, Green, Conrad and Williams1986; Backus et al., Reference Backus, Rosenquist, Rogers, Calam and Morris1995; Lejeune et al., Reference Lejeune, Westerterp, Adam, Luscombe-Marsh and Westerterp-Plantenga2006). The exact mechanisms by which satiety is reached and the hormone interactions that occur are still unknown. HP diets (50% crude protein; 58 g/kg BW0.67) increase heat production (Hoenig et al., Reference Hoenig, Thomaseth, Waldron and Ferguson2007), maintain insulin sensitivity (Hoenig et al., Reference Hoenig, Thomaseth, Waldron and Ferguson2007) and maintain lean body mass during weight loss (Laflamme and Hannah, Reference Laflamme and Hannah2005) in cats. Thus, a HP diet may be protective of weight gain following ovariohysterectomy or neutering.
Estrogen plays a key role in adipose tissue deposition and function (Cooke and Naaz, Reference Cooke and Naaz2004), and decreases leptin receptor expression in the hypothalamus and adipose tissue (Meli et al., Reference Meli, Pacilio, Raso, Esposito, Coppola, Nasti, Di Carlo, Nappi and Di Carlo2004). Estrogen plays a role in spontaneous physical activity, and therefore, its removal can lead to decreased muscle mass and strength (Brown, Reference Brown2008). These findings suggest that estrogen plays a role not only in appetite regulation but also influences tissues important in energy balance, lipid metabolism and glucose transport. An earlier study in our lab reported changes in feline adipose and skeletal muscle tissue mRNA following ovariohysterectomy (Belsito et al., Reference Belsito, Vester, Keel, Graves and Swanson2009), but was focused on food-restriction rather than dietary composition.
Therefore, the objective of this study was to determine the effects of ovariohysterectomy on changes in body composition, blood metabolite concentrations, physical activity levels and adipose and skeletal muscle tissue mRNA abundance in cats fed a HP or moderate-protein (MP) diet. We hypothesized that HP-fed cats would regulate food intake, resulting in less weight gain and fewer metabolic changes following ovariohysterectomy, as compared with MP-fed cats.
Material and methods
Animals and diet
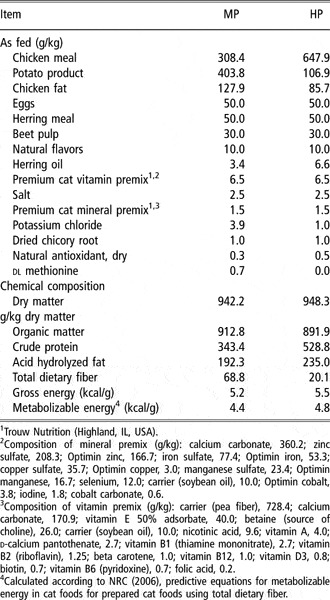
Eight adult (mean age = 2.0 ± 0.02 years of age; mean BW = 4.19 ± 0.37 kg) female domestic shorthair cats (Liberty Research, Inc., Waverly, NY, USA) were used. Cats were individually housed in stainless steel cages (0.61 m × 0.61 m × 0.61 m) in the animal facility of the Edward R. Madigan Laboratory at the University of Illinois. Room dimensions were 7.32 m wide × 9 m long × 3.96 m high. The room was climate controlled (22°C) with a 16 h light : 8 h dark cycle. Cats were randomized to HP or MP diets (Table 1) and were fed these diets for several months prior to baseline. Cats were allowed ad libitum access to food and water throughout the study. All procedures were approved by the University of Illinois Institutional Animal Care and Use Committee prior to experimentation.
Ingredient and chemical composition of the high-protein (HP) and moderate-protein (MP) diets fed to cats

1Trouw Nutrition (Highland, IL, USA).
2Composition of mineral premix (g/kg): calcium carbonate, 360.2; zinc sulfate, 208.3; Optimin zinc, 166.7; iron sulfate, 77.4; Optimin iron, 53.3; copper sulfate, 35.7; Optimin copper, 3.0; manganese sulfate, 23.4; Optimin manganese, 16.7; selenium, 12.0; carrier (soybean oil), 10.0; Optimin cobalt, 3.8; iodine, 1.8; cobalt carbonate, 0.6.
3Composition of vitamin premix (g/kg): carrier (pea fiber), 728.4; calcium carbonate, 170.9; vitamin E 50% adsorbate, 40.0; betaine (source of choline), 26.0; carrier (soybean oil), 10.0; nicotinic acid, 9.6; vitamin A, 4.0; d-calcium pantothenate, 2.7; vitamin B1 (thiamine mononitrate), 2.7; vitamin B2 (riboflavin), 1.25; beta carotene, 1.0; vitamin B12, 1.0; vitamin D3, 0.8; biotin, 0.7; vitamin B6 (pyridoxine), 0.7; folic acid, 0.2.
4Calculated according to NRC (2006), predictive equations for metabolizable energy in cat foods for prepared cat foods using total dietary fiber.
Experimental design
Cats were evaluated using a completely randomized design with repeated measures over time. Cats were acclimated to a physical activity schedule according to Belsito et al. (Reference Belsito, Vester, Keel, Graves and Swanson2009). Cats were housed in pens individually for 7 h/day and group housed for 17 h/day in the room, including the dark period. Food was available only during times cats were individually housed in cages. Cats underwent ovariohysterectomy at week 0 and were evaluated for an additional 24 weeks. Baseline (week 0) body composition and physical activity were assessed and 12 h food-restricted blood samples, subcutaneous adipose tissue and skeletal muscle (longissimus dorsi) tissue were collected prior to ovariohysterectomy. All measurements were repeated at 12 and 24 weeks after ovariohysterectomy. Cats were weighed (GSE 350; Mettler Toledo, Inc., Columbus, OH, USA) and body condition score (Laflamme, Reference Laflamme1997) determined weekly.
Body composition
Lean mass, fat mass and bone mineral content (BMC) were determined using DEXA (dual-energy X-ray absorptiometry), which has been previously validated in cats (Speakman et al., Reference Speakman, Booles and Butterwick2001). Determinations were conducted after ovariohysterectomy and tissue biopsy, while still under sedation. Cats were placed in ventral recumbency and body composition was analyzed using a Hologic model QDR-4500 Fan Beam X-ray Bone Densitometer and software (Hologic Inc., Waltham, MA, USA).
Physical activity level assessment
Voluntary physical activity levels were evaluated using Actical activity collars (Mini Mitter, Bend, OR, USA), which were worn around the neck for seven consecutive days prior to weeks 0, 12 and 24. Collars contain omnidirectional sensors capable of accurately incorporating both intensity and duration of movements. Once the collars were removed, Actical software analyzed data compiled by the collar and converted it into arbitrary numbers referred to as ‘activity counts’. In the current dataset, average activity was presented as activity counts per epoch (epoch length = 0.25 min). Actical software allowed for the determination of average activity counts per epoch during light and dark periods without human interference.
Sample collection
Food was withheld for at least 12 h prior to ovariohysterectomy and tissue biopsies. Tissue biopsies were collected during ovariohystectomy at week 0. Cats were allowed free access to water. For all tissue biopsies, cats were sedated with butorphanol (0.02 mg/kg), atropine (0.04 mg/kg) and medetomadine (0.02 mg/kg; intramuscular). Anesthesia was induced and maintained with isoflurane in 100% oxygen during ovariohysterectomy. Food-restricted blood samples (via jugular venipuncture, prior to isoflurane exposure) and approximately 1 g of subcutaneous abdominal adipose tissue and 1 g of longissimus dorsi muscle were collected following an overnight fast. Tissue samples were immediately flash frozen in liquid nitrogen and stored at −80°C until further analyses.
Sample analyses
Representative diet samples were collected and ground using a Wiley mill (model 4; Thomas Scientific, Swedesboro, NJ, USA) through a 2 mm screen and dry ice in preparation for chemical analyses. Diet samples were analyzed for dry matter (DM) and organic matter according to the Association of Official Analytical Chemists (1984). Crude protein was determined according to the Association of Official Analytical Chemists (1995) using a Leco Nitrogen/Protein Determinator (model FP-2000; Leco Corporation, St. Joseph, MI, USA). Fat concentrations were measured by acid hydrolysis (American Association of Cereal Chemists, 1983) followed by ether extraction (Budde, Reference Budde1952). Gross energy was measured using a bomb calorimeter (Model 1261; Parr Instrument Co., Moline, IL, USA). Total dietary fiber concentration was determined according to Prosky et al. (Reference Prosky, Asp, Schweizer, DeVries and Fruda1992).
Food-restricted blood samples were immediately analyzed for glucose using the glucose oxidase method (Precision G Blood Glucose Testing System; Medisense, Bedford, MA, USA). Blood was then transferred to the appropriate collection tubes, and all tubes were centrifuged (30 min at 1300 × g; 4°C) within 1 h of collection. Following centrifugation, supernatant was collected, separated into respective cryovials and stored at −80°C until further analyses.
Serum fructosamine, triglyceride (TG), nonesterified fatty acid (NEFA) and thyroxine concentrations were analyzed by the University of Illinois Clinical Diagnostic Laboratory. Plasma leptin concentrations were determined using a commercially available radioimmunoassay kit (Multispecies Leptin RIA Kit; Linco Research, St. Louis, MO, USA; inter-assay variation 7.9%; intra-assay variation 4.8%). Serum insulin concentrations were determined using a commercial RIA kit (Double Antibody RIA; Diagnostic Systems Laboratories Inc., Webster, TX, USA), validated in cats by the manufacturer. Serum total ghrelin concentrations were determined using a commercially available enzyme immunoassay kit (Ghrelin Rat EIA Kit; Phoenix Pharmaceuticals Inc., Belmont, CA, USA; inter-assay variation 12.5%; intra-assay variation 8.7%), following a ten-fold dilution of serum. All blood analysis kits were previously validated for use in our laboratory (Belsito et al., Reference Belsito, Vester, Keel, Graves and Swanson2009). Insulin, leptin and ghrelin data were analyzed using GraphPad Software (Prism Software, San Diego, CA, USA) before statistical analyses were performed.
Total RNA extraction and quantitative reverse transcriptase-PCR
Total cellular RNA was isolated from adipose tissue and skeletal muscle using Trizol (Invitrogen, Carlsbad, CA, USA). The concentration and purity of RNA was determined using a ND-1000 spectrophotometer (Nanodrop Technologies, Wilmington, DE, USA). Conversion of RNA to cDNA was done using a cDNA Archive kit (Applied Biosystems, Foster City, CA, USA) according to manufacturer’s instructions. Isolated cDNA was amplified using real time reverse transcriptase-PCR on an ABI PRISM 7900HT Sequence Detection System (Applied BioSystems). Gene-specific primers (Supplementary Table 1) were designed using Primer Express 2.0 Software (Perkin Elmer, Boston, MA, USA) or from published literature (Zini et al., Reference Zini, Linscheid, Franchini, Kaufmann, Monnais, Kutter, Ackermann, Lutz and Reusch2009). Genes with available mRNA sequence and having roles in lipid metabolism and transport (peroxisome proliferator-activating receptor gamma isoform-1 (PPARγ1); peroxisome proliferator-activating receptor gamma isoform-2 (PPARγ); hormone sensitive lipase (HSL); lipoprotein lipase (LPL)), glucose metabolism and transport (insulin receptor (IR); glucose transporter 1 (GLUT1); glucose transporter 4 (GLUT4)), inflammation (interleukin 1 (IL-1); interleukin 6 (IL-6); tumor necrosis factor alpha (TNF-α); monocyte chemotactic protein 1 (MCP-1); chemokine receptor 5 (CCR5); toll-like receptor 4 (TLR4)) and genes having various roles in adipose tissue (uncoupling protein 2 (UCP2); leptin; adiponectin; vascular endothelial growth factor (VEGF); estrogen receptor 1 (ESR1); plasminogen activator inhibitor 1 (PAI1)) were evaluated in adipose tissue samples. Skeletal muscle tissue was analyzed for UCP2, LPL, HSL, GLUT1 and GLUT4 mRNA abundance.
The PCR mixture contained 5 and 50 ng/μl of cDNA from adipose and skeletal muscle tissue, respectively, 15 pmol of each primer, and 5 μl SYBR Green. The final volume was adjusted to 10 μl using sterile deionized water. The 18S rRNA gene was used as an internal standard. Data analyses were conducted with sequence detection system software (Applied BioSystems). All target genes were normalized to 18S prior to statistical analyses.
Statistical analyses
Data were analyzed as repeated measures using the Mixed Models procedure of SAS (SAS Inst. Inc., Cary, NC, USA) with the best-fit covariance structure applied. The main effects of diet and week were tested and the interaction term was investigated if significant. Initial BW was used as a covariate when analyzing BW over the course of the study. Orthogonal contrasts were tested if the effect of week was significant. If the interaction term was significant, contrasts were used to compare the effect of diet within each week. Results are presented as means ± standard error of the mean. The correlation between leptin and body fat mass was analyzed using Pearson’s Correlation in SAS. A probability of P < 0.05 was considered significant. Due to the small number of animals per treatment, P < 0.10 was considered a trend.
Results
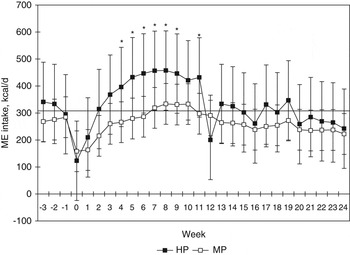
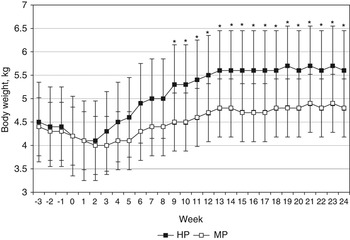
Dry matter intake increased (P < 0.001) following ovariohysterectomy and was greater (P < 0.001) at weeks 12 and 24 compared to week 0 (Figure 1). Intake was lower (P < 0.001) at week 24 compared to week 12, but remained higher than baseline. Intake was highest at week 8 (81.6 g DM/day). Caloric intake over the entire course of the study (determined from calculated metabolizable energy (ME)) tended to be greater (P = 0.08) in HP-fed cats. BW and body condition scores (BCS) increased (P < 0.001) from week 0 (mean BW = 4.18 kg; mean BCS = 6.0) to weeks 12 (mean BW = 5.08 kg; mean BCS = 7.0) and 24 (mean BW = 5.21 kg; mean BCS = 7.0), regardless of dietary treatment (Figure 2). Cats consumed less (P < 0.05) food from week 12 to 24; however, BW did not differ from week 12 to 24.
Food intake of cats fed a high- or moderate-protein diet prior to and following ovariohysterectomy. Line represents the average initial metabolizable energy requirement calculated based on NRC (2006). Food intake was greater (P < 0.05) in cats fed high-protein diet at weeks 4 to 11 after ovariohysterectomy. Each point represents the mean of four cats ± s.d. (* Difference (P < 0.05) due to diet).

BW of cats fed a high- or moderate-protein diet prior to and following ovariohysterectomy. BW was greater (P < 0.05) in cats fed high-protein diet at weeks 9 to 24 after ovariohysterectomy. Each point represents the mean of four cats ± s.d. (*Difference (P < 0.05) due to diet).

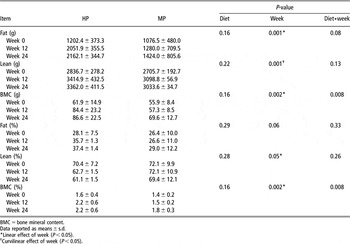
Body composition did not change due to diet; however, body fat mass (g) increased (P < 0.05) over time (Table 2). Body fat percentage tended to increase (P = 0.06) linearly over time. Lean tissue mass (g) increased (P < 0.05) curvilinear over time, increasing rapidly from week 0 to 12 and then was stable from week 12 to 24. Lean body mass percentage decreased (P < 0.05) linearly over time. Bone mineral mass (g) increased (P < 0.05) linearly over time. At week 12, bone mineral mass was greater (P < 0.05) in cats fed HP compared to those fed MP, but this difference was not present at week 24. Body fat mass was positively correlated (r = 0.89; P < 0.001) with BCS.
Body composition of cats fed a high-protein (HP) or moderate-protein (MP) diet prior to and following ovariohysterectomy

BMC = bone mineral content.
Data reported as means ± s.d.
*Linear effect of week (P < 0.05).
†Curvilinear effect of week (P < 0.05).
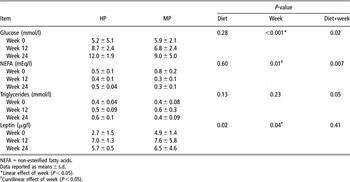
Food-restricted blood glucose concentrations increased (P < 0.05) over time, while serum NEFA concentrations decreased (P < 0.05) from week 0 to weeks 12 and 24, regardless of dietary treatment (Table 3). Glucose increased over time in cats, regardless of dietary treatment; however, HP-fed cats had a greater increase from week 0 to week 12 compared to MP-fed cats. A significant diet-by-week interaction was present for blood TG concentrations. While cats fed HP had increasing blood TG over time, TG in MP-fed cats peaked at week 12 and decreased back to baseline concentrations by week 24. Blood leptin concentrations increased (P < 0.05) from week 0 to 12, and were greater (P < 0.05) in MP cats. Leptin concentrations decreased (P < 0.05) from week 12 to 24, but were still greater than week 0. Blood leptin concentrations were positively correlated (P < 0.001) with body fat mass (g; r = 0.80) and BW (r = 0.71). Blood insulin, ghrelin, fructosamine and thyroxine concentrations were not changed over time.
Blood concentrations of cats fed a high-protein (HP) or moderate-protein (MP) diet prior to and following ovariohysterectomy

NEFA = non-esterified fatty acids.
Data reported as means ± s.d.
*Linear effect of week (P < 0.05).
†Curvilinear effect of week (P < 0.05).
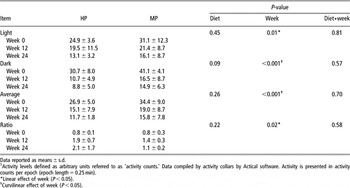
Physical activity decreased (P < 0.01) during the light and dark periods over time following ovariohysterectomy (Table 4). Activity during the light period was unaffected by diet, but activity in the dark period tended to be higher (P < 0.10) in MP-fed cats. The light to dark ratio of activity increased (P < 0.02) linearly over time, increasing from week 0 to week 12 and 24.
Physical activity of cats fed a high-protein (HP) or moderate-protein (MP) diet prior to and following ovariohysterectomyFootnote 1

Data reported as means ± s.d.
1 Activity levels defined as arbitrary units referred to as ‘activity counts.’ Data compiled by activity collars by Actical software. Activity is presented in activity counts per epoch (epoch length = 0.25 min).
* Linear effect of week (P < 0.05).
† Curvilinear effect of week (P < 0.05).
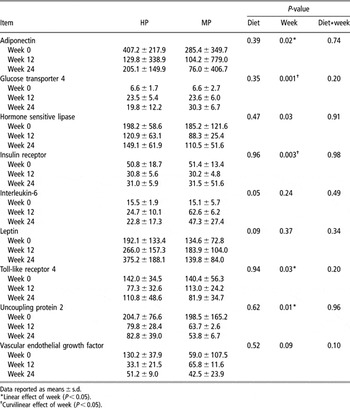
Adipose tissue mRNA abundance of adiponectin, HSL, TLR4, UCP2 and VEGF decreased (P < 0.05) linearly over time, regardless of diet (Table 5). IR mRNA decreased (P < 0.05) curvilinear over time, while GLUT4 had a curvilinear increase (P < 0.05) over time. Adipose IL-6 mRNA was higher (P < 0.05) in MP-fed cats, while leptin mRNA tended to be greater (P < 0.10) in HP-fed cats. IL-6 or leptin mRNA were not changed over time. Adipose adiponectin mRNA expression was negatively correlated (P < 0.05) with BW (r = −0.39). Adipose UCP2 mRNA abundance was positively correlated (P < 0.04) with physical activity during the dark period (r = 0.44).
Adipose tissue mRNA abundance (arbitrary units) of cats fed a high-protein (HP) or moderate-protein (MP) diet prior to and following ovariohysterectomy

Data reported as means ± s.d.
*Linear effect of week (P < 0.05).
†Curvilinear effect of week (P < 0.05).
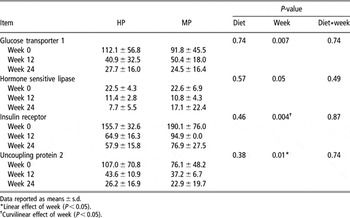
Skeletal muscle mRNA abundance for GLUT1, HSL and UCP2 decreased (P < 0.05) over time, while IR mRNA decreased (P < 0.05) curvilinearly over time, regardless of dietary treatment (Table 6). 18S rRNA, used as an endogenous control, did not differ due to diet (P > 0.05), week (P > 0.05), or diet*week (P > 0.05).
Skeletal muscle tissue mRNA abundance (arbitrary units) of cats fed a high-protein (HP) or moderate-protein (MP) diet prior to and following ovariohysterectomy

Data reported as means ± s.d.
*Linear effect of week (P < 0.05).
†Curvilinear effect of week (P < 0.05).
Discussion
Given the increasing numbers of obese cats, identifying methods to prevent obesity following ovariohysterectomy and neutering are of great importance. Understanding the mechanisms responsible for the increased weight gain may enable researchers to develop better feeding strategies. Diets that increase feelings of satiety, thereby decreasing energy intake, may be developed. Therefore, the objective of this study was to evaluate metabolic changes in cats fed a HP or MP diet after ovariohysterectomy and to identify relationships between metabolic changes and mRNA abundance in adipose and skeletal muscle tissue.
While protein concentration was not the only difference between the HP and MP diets, it constituted the largest difference between the diets. These diets were formulated to simulate typical commercial-type diets available on the market today, using common ingredients and levels of protein, fat and fiber. Despite our primary interest in dietary protein concentration, we acknowledge slight differences in other dietary constituents (dietary fat and fiber concentration and/or source) that may have also influenced the outcome variables measured in this study.
Food intake and BW increased in all cats following ovariohysterectomy, as has been noted in other studies (Fettman et al., Reference Fettman, Stanton, Banks, Hamar, Johnson, Hegstad and Johnston1997; Harper et al., Reference Harper, Stack, Watson and Moxham2001; Kanchuk et al., Reference Kanchuk, Backus, Calvert, Morris and Rogers2003; Nguyen et al., Reference Nguyen, Dumon, Siliart, Martin, Sergheraert and Biourge2004; Backus et al., Reference Backus, Cave and Keisler2007; Cave et al., Reference Cave, Backus, Marks and Klasing2007; Belsito et al., Reference Belsito, Vester, Keel, Graves and Swanson2009). Earlier research has indicated that an estimated 20% to 30% reduction in food intake is needed to maintain BW of neutered cats (Flynn et al., Reference Flynn, Hardie and Armstrong1996; Root et al., Reference Root, Johnston and Olson1996; Belsito et al., Reference Belsito, Vester, Keel, Graves and Swanson2009). Therefore, BW gain following ovariohysterectomy is not only due to increased food intake, but may also be due to a lower metabolic rate and decreased physical activity. In the current study, consumption of a HP diet did not ameliorate increases in food intake or BW gain. In fact, there was a significant (P = 0.05) diet by time interaction, as HP-fed cats consumed more food than MP-fed cats during week 4 through week 9. At week 12, there was a large decrease in food intake by HP-fed cats. While it was expected that cats would decrease their intake at 12 weeks due to surgery, this drastic change following week 12 was primarily the result of one cat decreasing food intake after this time point. Because of the small number of animals per treatment, one cat drastically changing her intake led to a large shift in average intakes of the HP-fed cats.
Before undergoing ovariohysterectomy (week −3 through 0), cats consumed 100.2 ± 34.55% of their ME requirement and maintained BW. Within 3 weeks (HP-fed cats) or 8 weeks (MP-fed cats) after ovariohysterectomy, cats consumed more ME than at baseline and did so for several weeks. When cats began to consume at or below their initial ME requirement (at week 13 for MP-fed cats and at week 20 for HP-fed cats), they continued to maintain or gain weight. By week 24, lean body mass was increased by 15% from week 0. Therefore, it would be expected that ME requirement would increase above the initial calculated value. By week 13, however, cats were consuming near or below their initial ME requirement, but continued to maintain or even gain BW. Interestingly, cats consumed only 89% of their initial calculated ME requirement (100 × BW0.67; National Research Council, 2006) at week 24.
All cats gained weight following ovariohysterectomy, with the majority comprising adipose tissue rather than lean body mass or BMC. Similar to BW gain, HP-fed cats gained body fat mass faster than MP-fed cats and had increased BMC earlier in the study, which was likely to support increased weight gain. Changes in fat and lean mass percentages were similar to values reported by Harper et al. (Reference Harper, Stack, Watson and Moxham2001) in cats < 4 years of age (23.6% fat pre-neutering; 34.4% fat 12 months post-neutering; P < 0.002).
Physical activity has an inverse relationship with BW. In a review of physical activity in animal models, Tou and Wade (Reference Tou and Wade2002) suggested that decreases in physical activity were in response to, rather than the cause of, increased BW. Researchers have reported that BW gains following ovariohysterectomy were due to increased food intake and not decreased energy expenditure (Flynn et al., Reference Flynn, Hardie and Armstrong1996; Kanchuk et al., Reference Kanchuk, Backus, Calvert, Morris and Rogers2003). The methods used in these studies, however, did not allow for objective measurements of spontaneous physical activity without human interference. The availability of activity collars now allows researchers to monitor activity without human interference and provides objective data that may be quantified and statistically analyzed.
Published literature provides clear evidence that estrogen influences physical activity (Wade and Gray, Reference Wade and Gray1979; Mystkowski and Schwartz, Reference Mystkowski and Schwartz2000; Ainslie et al., Reference Ainslie, Morris, Wittert, Turnbull, Proietto and Thornburn2001; Garey et al., Reference Garey, Morgan, Frohlich, McEwen and Pfaff2001). Withdrawal of estrogen in rats, through ovariectomy, decreased spontaneous physical activity within 7 weeks of surgery compared to sham-operated controls (Ainslie et al., Reference Ainslie, Morris, Wittert, Turnbull, Proietto and Thornburn2001). Injection of estrogen in ovariectomized mice (Swiss-Webster mice; 8 to 10 weeks of age at start of study) led to increased time spent on the running wheel by these animals (Garey et al., Reference Garey, Morgan, Frohlich, McEwen and Pfaff2001).
Belsito et al. (Reference Belsito, Vester, Keel, Graves and Swanson2009) reported decreased physical activity (approximately 64%) in ovariohysterectomized cats that were limit-fed to maintain BW. In that study, however, limit-feeding may have influenced energy expenditure. The largest portion of decreased energy expenditure occurred during the dark period (Belsito et al., Reference Belsito, Vester, Keel, Graves and Swanson2009). Our data confirm these findings, as week 24 activity during the light period decreased by approximately 91%, while activity during the dark period decreased by approximately 500%, as compared to baseline. Due to the design of the current study, it was impossible to determine a causal relationship between BW and physical activity.
Other researchers have noted that ovariohysterectomized or neutered cats have increased insulin and leptin concentrations, with no change in glucose or TG concentrations (compared to intact cats) (Fettman et al., Reference Fettman, Stanton, Banks, Hamar, Johnson, Hegstad and Johnston1997; Kanchuk et al., Reference Kanchuk, Backus, Calvert, Morris and Rogers2003). In the current study, food-restricted glucose concentrations increased from week 0 to 24, suggesting decreased insulin sensitivity with weight gain; however, food-restricted blood insulin concentrations did not change over time. Szabo et al. (Reference Szabo, Ibrahim, Sunvold, Dickey, Rodgers, Toth, Boissonneault and Bruckner2000) reported increased blood glucose concentrations in cats following ovariohysterectomy (and weight gain) with no increases in insulin concentration. Glucose concentrations reported by Szabo et al. (Reference Szabo, Ibrahim, Sunvold, Dickey, Rodgers, Toth, Boissonneault and Bruckner2000) were similar to those measured in the current study. Kanchuk et al. (Reference Kanchuk, Backus, Calvert, Morris and Rogers2003) reported increased insulin concentrations of neutered male v. intact male cats; however, changes over time within the neutered males were not statistically analyzed. In the current study, food-restricted TG concentrations increased in HP cats by week 24 following ovariohysterectomy. TG concentrations at week 0 in the current study were similar to those reported by Fettman et al. (Reference Fettman, Stanton, Banks, Hamar, Johnson, Hegstad and Johnston1997) after neutering. The increased blood TG concentrations were likely due to an adaptation to the gluconeogenic state of HP-fed cats, which enabled them to mobilize fat stores more quickly than the MP-fed ones. This change may have also been in response to the increased weight gain of the HP-fed cats.
Leptin concentrations are positively correlated with adipose tissue mass (Appleton et al., Reference Appleton, Rand and Sunvold2000; Backus et al., Reference Backus, Havel, Gingerich and Rogers2000; Belsito et al., Reference Belsito, Vester, Keel, Graves and Swanson2009). Backus et al. (Reference Backus, Havel, Gingerich and Rogers2000) used linear regression and estimated that for every 1 g increase in BW, a 1.2 ng/ml increase in leptin occurred. In the current study, circulating blood leptin concentrations not only increased over time in cats fed both diets, but were also greater in MP-fed cats. While MP-fed cats had increased blood leptin concentrations, HP-fed cats tended to have increased adipose leptin mRNA abundance. A positive correlation (r = 0.388; P < 0.0001) between adipose leptin gene expression and serum concentrations has been noted in humans studies (Knerr et al., Reference Knerr, Herzog, Rauh, Rascher and Horbach2006). In the current study, adipose leptin mRNA concentrations tended to be correlated with circulating leptin values (r = 0.39; P = 0.07). Cats, similar to other species, have increased circulating leptin concentrations following weight gain. Increased blood leptin concentrations, without decreases in food intake suggests decreased leptin sensitivity (Appleton et al., Reference Appleton, Rand and Sunvold2000; Backus et al., Reference Backus, Havel, Gingerich and Rogers2000; Martin et al., Reference Martin, Siliart, Dumon, Backus, Biourge and Nguyen2001).
High-protein (low-carbohydrate) diets may improve leptin sensitivity in humans. Hayes et al. (Reference Hayes, Miller, Ulbrecht, Mauger, Parker-Klees, Davis Gutschall, Mitchell, Smiciklas-Wright and Covasa2007) noted decreased blood leptin and increased blood ghrelin concentrations in individuals fed a low-carbohydrate diet, even though energy intake was consistent among groups. Therefore, the authors hypothesized that the low-carbohydrate diet led to improved leptin signaling. In contrast to the current study in which cats increased food intake and BW, those individuals reduced energy intake to lose BW (93.5 ± 3.6 kg at baseline; 88.3 ± 3.4 kg at end of trial).
Measuring mRNA abundance in adipose and skeletal muscle tissues may identify tissue-specific metabolic changes that are undetectable in blood. Identifying the changes that occur following the removal of estrogen may determine the mechanisms by which increased adiposity occurs, potentially revealing targets for dietary intervention.
Diet had little influence on gene expression in the current study, which may have been masked by large BW increases. Changes in mRNA abundance of target genes were similar to reported human and rodent data. In contrast to leptin, blood adiponectin concentrations decrease with increasing adiposity and are thought to contribute to decreased insulin sensitivity. In cats, adiponectin has been reported to decrease with obesity and increase upon losing BW (Hoenig et al., Reference Hoenig, Thomaseth, Waldron and Ferguson2007). Adipose adiponectin mRNA abundance decreased over time in the current study. As BW increased, cats had increased food-restricted blood glucose concentrations. Although insulin sensitivity was not measured in the current study, measurement of adiponectin and glucose concentrations and insulin sensitivity would be useful in future studies.
Other notable changes in gene expression included increased adipose GLUT4 expression and decreased adipose and skeletal muscle IR expression. We hypothesized that GLUT4 mRNA abundance would decrease with obesity, as was noted by Brennan et al. (Reference Brennan, Hoenig and Ferguson2004) in obese v. lean cats. In that study, female cats (n = 17) were studied before and after 6 months of ad libitum feeding that resulted in obesity. It is possible that increased GLUT4 mRNA abundance noted in the current study was a compensatory response to decreased translation of GLUT4 protein or translocation of GLUT4 protein to the cell membrane. Because GLUT4 protein expression or translocation were not measured in the current study, this is only speculation. Brennan et al. (Reference Brennan, Hoenig and Ferguson2004) also reported decreased GLUT4 protein expression in skeletal muscle of obese v. lean cats but no changes in GLUT1. In the current study, GLUT4 mRNA expression did not change in skeletal muscle of cats fed either diet.
In the current study, GLUT1 gene expression decreased over time in skeletal muscle, regardless of dietary treatment. GLUT1 is located in many tissues throughout the body. It is insulin insensitive and plays a role in basal glucose uptake. Obese and obese diabetic rats had decreased skeletal muscle GLUT1 mRNA abundance compared to lean rats of the same genetic line (Kahn and Pedersen, Reference Kahn and Pedersen1993). Those authors stated, however, that this transporter plays a small role in overall insulin-resistant glucose uptake, and therefore may not play a large role in the development of insulin resistance. The usefulness of GLUT1 expression as an early indicator of insulin insensitivity, however, is unknown in cats.
Hormone sensitive lipase and UCP2 both play a role in fatty acid catabolism. Hormone sensitive lipase releases fatty acids from the cell while UCP2 plays a role in energy expenditure. Hormone sensitive lipase enzyme activity, protein expression and mRNA abundance were lower in subcutaneous adipose tissue of obese humans as compared to non-obese controls (Large et al., Reference Large, Reynisdottir, Langin, Fredby, Klannemark, Holm and Arner1999). Decreased adipose and skeletal muscle HSL expression observed in the current study may have been due to the removal of estrogen or increased weight gain, which is consistent with rodent data. Decreased HSL response was consistent with decreased blood NEFA concentrations. Obese humans also have impaired fatty acid release from skeletal muscle compared to lean individuals (Blaak et al., Reference Blaak, Van Baak, Kemerink, Pakbiers, Heidendal and Saris1994a).
Contrary to our data, Hoenig et al. (Reference Hoenig, McGoldrick, deBeer, Demacker and Ferguson2006) reported increased HSL gene expression in adipose and skeletal muscle in obese v. lean cats. Those researchers also reported decreased LPL mRNA abundance in adipose tissue, but greater mRNA abundance in skeletal muscle of obese v. lean cats (Hoenig et al., Reference Hoenig, McGoldrick, deBeer, Demacker and Ferguson2006). Given the change in LPL : HSL, the authors hypothesized that HSL in adipose tissue was shuttling fat to skeletal muscle. Increased lipid deposition in skeletal muscle tissue leads to decreased insulin sensitivity. In the current study, adipose and skeletal muscle tissue LPL expression levels were unchanged.
Decreases noted in adipose UCP2 expression were consistent with decreased HSL expression. A blunted fat oxidation response to β-androgenic stimulation may be a primary factor for increased fat stores and maintaining adipose tissue deposits following weight loss (Blaak et al., Reference Blaak, Van Baak, Kemerink, Pakbiers, Heidendal and Saris1994b). UCP2 activity increases with increased blood lipid circulation. Therefore, with less fat released from adipose tissue, UCP2 may also be expected to decrease. Furthermore, decreased UCP2 expression may indicate a decreased metabolic rate of ovariohysterectomized cats.
Inflammation occurs in adipose tissue with prolonged obesity. Obese cats have been noted to have increased inflammatory cytokine mRNA and protein concentrations (Hoenig et al., Reference Hoenig, McGoldrick, deBeer, Demacker and Ferguson2006; Tanner et al., Reference Tanner, Martin and Saker2007). Gene expression of inflammatory markers (TNF-α, IL-1, IL-6, MCP-1 and PAI1) did not change over time in the current study. Expression of TLR4 decreased over time in adipose tissue. Although all cats gained weight, the lack of change in this regard (BCS only 7/9 at week 24) may be an indication that extreme obesity (BCS = 8 or 9/9) is required to elicit an inflammatory response.
Adipose tissue IL-6 mRNA expression increased in MP-fed cats, which may indicate increased inflammation. Bastard et al. (Reference Bastard, Maachi, Tran Van Nhieu, Jardel, Bruckert, Grimaldi, Robert, Capeau and Hainque2002) reported that IL-6 might impair insulin action locally in adipose tissue. The authors noted a strong inverse correlation between adipose tissue IL-6 concentrations and insulin-stimulated glucose disposal, and a positive correlation between plasma glucose and obese individuals with varying levels of insulin resistance. The effect of IL-6 on insulin resistance may be due to its effect on gene transcription. Chronic exposure of IL-6 to 3T3-L1 adipocytes inhibited gene transcription of IR substrate-1, GLUT4, and PPAR-γ (Rotter et al., Reference Rotter, Nagaev and Smith2003). Given that increases in IL-6 did not occur in MP-fed cats until after weight gain, it may be of interest in future studies testing the effect of diet on insulin resistance and diabetes in cats.
Evaluation of cats fed a HP diet did not appear to ameliorate any metabolic or gene expression changes associated with increased weight gain. Feeding a HP diet to maintain BW following ovariohysterectomy may lead to different changes that have yet to be evaluated at present. Further evaluation of HP diets fed to cats with known insulin resistance may illicit changes in gene expression that aid in our understanding of feline obesity and comorbidities.
In summary, we report several metabolic and gene expression changes following ovariohysterectomy in cats. Notable increases in food intake, BW and body fat were expected and have been well reviewed in the literature. Decreased physical activity, especially during the dark period, indicated that physical activity greatly decreased in ovariohysterectomized cats, contributing to further weight gain. Our experimental design did not allow for the testing of a causal relationship between physical activity and weight gain. We hypothesize, however, that increased food intake leads to weight gain and consequent decreased activity. The novel approach of measuring physical activity without human interference may aid in testing this hypothesis in the future.
Gene expression changes may be a good indicator of metabolic changes in the body. It was clear that fatty acid metabolism was altered after ovariohysterectomy and weight gain, leading to increased storage of fat, coupled with decreased metabolic rate (i.e. decreased UCP2). These alterations in fatty acid metabolism may be due to obesity itself, or as a primary factor contributing to the onset of obesity. Further research testing the role of estrogens on adipose gene expression in cats is warranted. Not all blood metabolite concentrations aligned with changes in mRNA abundance. The relationship of leptin mRNA expression and circulating blood concentrations require more study.
Due to metabolic changes that occur in adipose and skeletal muscle tissue, it is inadvisable to feed cats ad libitum following ovariohysterectomy, regardless of diet fed. Further feline research focused on controlling metabolic changes or influencing satiety factors is needed, as it is possible that limit-feeding a HP diet to maintain BW will yield different results. While feeding a HP diet did not control food intake or ameliorate increasing BW herein, more research is needed to fully elucidate its role in managing feline obesity.