I. INTRODUCTION
Nanocrystalline materials (grain size < 100 nm) constitute a focal point of interest for fundamental scientific as well as applied research as such materials have a variety of applications in view of their properties, which are often superior to the properties of coarse-grained materials.Reference Koch, Ovid’ko, Seal and Veprek1, Reference Gleiter2 Examples of such properties are higher strength and hardness,Reference Meyers, Mishra and Benson3, Reference Meyers, Mishra and Benson4 extreme ductility without strain hardening,Reference Lu, Sui and Lu5 hard magnetic properties,Reference Croat, Herbst, Lee and Pinkerton6 etc. Mechanical attrition provides a simple but efficacious method for producing large batches of nanocrystalline material exhibiting far-from-equilibrium microstructures and phases with tunable compositions produced by mechanical alloying. In addition, the grain size can be tailored by varying the milling time and/or the milling parameters.Reference Suryanarayana7–Reference Murty and Ranganathan9 In nanomaterials, where the classical scaling laws break down, control of the microstructure is extremely important.
Nanocrystalline material exhibits a high driving force for grain coarsening due to the high density of grain boundaries.Reference Koch, Scattergood, Darling and Semones8, Reference Detor and Schuh10 The onset of grain coarsening for nanocrystalline materials can thus occur at distinctly lower homologous temperatures (even close to ambient temperature: “self annealing”) than for the corresponding coarse-grained materials.Reference Hansen and Pantleon11, Reference Ames, Markmann, Karos, Michels, Tschoepe and Birringer12 The grain boundary velocity during grain growth is proportional to the driving force and the grain boundary mobility.Reference Mittemeijer13 Thus, two approaches for suppressing grain growth to preserve the microstructure of nanocrystalline materials, upon aging or application of some time-temperature program, can be adopted:
(i) The thermodynamic approach (e.g., Refs. Reference Koch, Scattergood, Darling and Semones8 and Reference Weissmüller14–Reference Liu and Mücklich17): The driving force, i.e., the grain boundary energy, can be reduced by alloying. Specifically, grain boundary segregation has been proposed as a mechanism for lowering the excess energy contained in grain boundaries.
(ii) The kinetic approach (e.g., Refs. Reference Michels, Krill, Ehrhardt, Birringer and Wu18 and Reference Eckert, Holzer and Johnson19): Solute atoms or precipitates at grain boundaries impose drag forces on the interface.
Though independent, under practical circumstances and depending on the system, both mechanisms might be operative simultaneously.
Nickel–tungsten (Ni–W) alloys with a high W content have found wide-ranging applications where high density, tensile strength, and durability are required while combining with the useful ferromagnetic properties of Ni.Reference Younes-Metzler, Zhu and Gileadi20 Incorporation of W into Ni improves its mechanical properties by solid solution strengthening. Combined with its high temperature resistance, this material is a good candidate for corrosion-resistant material in high-temperature applicationsReference Yao, Zhao, Guo and Kowaka21 (and in this context, it is a good replacement for the environmentally hazardous hexavalent chromiumReference Osada, Maeda, Kawamoto, Shimizu, Nishimura and Yamaharu22); it exhibits great potential for use as a substrate for high-temperature superconductor applications.Reference Goyal, Feenstra, Paranthaman, Thompson, Kang, Cantoni, Lee, List, Martin, Lara-Curzio, Stevens, Kroeger, Kowalewski, Specht, Aytug, Sathyamurthy, Williams and Ericson23, Reference Hongli, Yue, Min, Lin, Dong, YingXiao and Meiling24 Such substrate needs to be mechanically strong and should possess preference for having {001} planes parallel to the surface (“cube texture”). However, addition of W generally adversely affects the development of such a texture (due to the decrease of the stacking fault energy of Ni upon adding W).Reference Tiearney and Grant25 Yet, high-energy ball-milled Ni–W alloys could be processed to substrates with more than 90% cube texture component.Reference Zhou, Ghalsasi, Hanna, Tang, Meng and Salama26 Thus, the powder metallurgical approach toward production of such material has gained momentum recently and appears to be a promising alternative to the traditional melting–casting route.Reference Gao, Suo, Gao, Zhao, Ma, Wang, Liu, Qiu and Ji27, Reference Bhattacharjee and Ray28 In recent years, research has been performed on nanocrystalline Ni–W materials synthesized by, in particular, electrodepositionReference Detor and Schuh10, Reference Eliaz, Sridhar and Gileadi29–Reference Yamasaki32 but also by sputteringReference Welzel, Kummel, Bischoff, Kurz and Mittemeijer33 and ball milling.Reference González, Sagarzazu, Villalba and Ochoa34–Reference Aning, Wang and Courtney36 The knowledge and general understanding of the properties of nanocrystalline Ni–W alloys is still in its infancy.Reference Welzel, Kummel, Bischoff, Kurz and Mittemeijer33, Reference Detor and Schuh37, Reference Choi, Al-Kassab, Gärtner, Kreye and Kirchheim38
The present work describes the microstructural evolution (i) upon ball milling of pure Ni powder and of a mixture of Ni powder and W powder with a nominal composition Ni–15 at.% W and (ii) upon annealing of the ball-milled Ni(W) product powder. To study the microstructural developments, x-ray diffraction (XRD) has proven to be a powerful nondestructive tool and is used extensively in extracting the microstructural information of nanocrystalline samples.Reference Mittemeijer and Scardi39, Reference Mittemeijer and Welzel40 XRD is often the most (also and in particular, statistically) reliable tool at hand when studying bulk specimens. From the diffraction peak parameters, such as peak width, position, shape, and intensity, information regarding the distribution of phases, crystallite shape, and crystallite size and its distribution, solute concentration, and density and distribution of crystal defects such as dislocations, faults, twins, etc. can be determined.Reference Delhez, de Keijser and Mittemeijer41, Reference Mittemeijer and Welzel42 In this work, the evolution of the grain size and the microstrain was studied using XRD analysis using integral breadth [single-line and Williamson–Hall (WH)] methodsReference Mittemeijer and Welzel42 and the method of whole powder pattern modeling (WPPM).Reference Scardi and Leoni43 The evolution of the microstructure of the Ni(W) solid solution, as produced by ball milling, was traced upon annealing; in particular, the grain coarsening behavior was investigated using in situ XRD measurements in the temperature range between 25 and 850 °C. Preliminary results have been presented in Ref. Reference Rane, Apel, Welzel and Mittemeijer35.
II. THEORETICAL BACKGROUND: XRD LINE PROFILE ANALYSIS
A. Integral breadth methods
1. Correction for instrumental broadening
The measured profile h is a convolution of the specimen profile f and the instrumental profile g. The instrumental profile g and the measured profile h in this study can be represented by the Voigt functions. Then, a simple correction for instrumental diffraction line broadening on the basis of the integral breadths and Voigt parameters of the measured and instrumentally broadened line profiles is possibleReference Delhez, de Keijser and Mittemeijer41 by subtracting the instrumental Lorentzian and Gaussian integral breadths of the instrumental profile from the Lorentzian and Gaussian integral breadths of the measured profile, linearly and quadratically, respectively.
2. Single-line analysis method
It is assumed that the specimen profile f can be described by a Voigt profile, which is a convolution of a Gaussian and a Lorentzian profile, where the Gaussian component of the profile is due to the microstrain ε and the Lorentzian component of the profile is due to the finite crystallite size.Reference Delhez, de Keijser and Mittemeijer41, Reference de Keijser, Langford, Mittemeijer and Vogels44 The integral breadths  ${\rm{\hslant20%\beta }}_{\rm{C}}^{\,f} $ and
 ${\rm{\hslant20%\beta }}_{\rm{G}}^{\,f} $ (on the diffraction angle, 2θ, scale) of the Lorentzian (Cauchy) and Gaussian components, respectively, can be related to the volume-weighted column length L vand the microstrain ε:
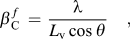 $${\rm{\hslant20%\beta }}_{\rm{C}}^{\,f} \, = \,{{\rm{\lambda }} \over {L_{\rm{v}} \cos {\rm{\hslant20%\theta }}}}\quad,$$
 $${\rm{\hslant20%\beta }}_{\rm{G}}^{\,f} \, = \,4{\rm{\hslant20%\varepsilon }}\tan {\rm{\hslant20%\theta \quad,}}$$
where λ is the wave length.
The volume-weighted crystallite size (diameter) D v can be calculated from the volume-weighted column length L v if an assumption for the crystallite shape is adopted.Reference Langford and Wilson45 In this work, a spherical crystallite shape has been assumed, hence, L v = 3D v/4, where, if not all spherical grains are of the same size, the value of D vstill depends on the size distribution.
3. Multiple-line WH method
Under the assumption that the integral breadths pertaining to the size- and the strain-broadened profiles are linearly additive, it follows thatReference Williamson and Hall46:
 $${\rm{\hslant20%\beta }}^{\,f} \, = \,{{\rm{\lambda }} \over {L_{\rm{v}} \cos {\rm{\hslant20%\theta }}}}\, + \,4{\rm{\hslant20%\varepsilon }}\tan {\rm{\hslant20%\theta }}\quad{\rm{.}}$$
Converting to reciprocal space pendants of β and d, β* and d *, respectively, using β* = βcos θ/λ and d *= 2sin θ/λ, gives:
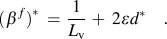 $$({\rm{\hslant20%\beta }}^{\,f})^{\rm{*}} \, = \,{1 \over {L_{\rm{v}} }}\, + \,{\rm{}}2{\rm{\hslant20%\varepsilon }}d^{\rm{*}} \quad.$$
Hence, a plot of  $({\rm{\hslant20%\beta }}^{\,f} )^* $ versus d* should result in a straight line, and then, the values for crystallite/grain size (= volume-weighted column length, L v) and strain can be obtained from the intercept of the ordinate and the slope.
The WH method, when applied to reflections from different sets of lattice planes, in principle implies a uniform microstrain in all crystallographic directions in each crystalliteReference Leineweber and Mittemeijer47 and hence is questionable when applied to elastically anisotropic materials. The uniform deformation stress (uds) model leads to an anisotropic microstrain state εhkl (with the stress taken independent of direction in the crystallites).Reference Biju, Sugathan, Vrinda and Salini48, Reference Rosenberg, Machavariani, Voronel, Garber, Rubshtein, Frenkel and Stern49 This anisotropic microstrain εhkl can be related to the uniform stress σ via the Hooke’s law: σ = εhkl·E hkl where E hkl is the Young’s modulus in the direction perpendicular to the hkl lattice plane. Then, ε in Eq. (3) has to be replaced by εhkland it follows:
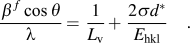 $${{{\rm{\hslant20%\beta }}^{\,f} \cos {\rm{\hslant20%\theta }}} \over {\rm{\lambda }}} = {\rm{}}{1 \over {L_{\rm{v}} }} + {\rm{}}{{2{\rm{\hslant20%\sigma }}d^{\rm{*}} } \over {E_{{\rm{hkl}}} }}\quad.$$
Hence [see text below Eqs. (3) and (4)], from a plot of  $({\rm{\hslant20%\beta }}^{\,f} )^* $ versus d*, values can be obtained for the crystallite size (from the intercept) and the microstrain (from the slope; using the obtained value of σ). This method will be called here as the WH-uds method.
B. Whole powder pattern modeling
In the WPPM method, a diffraction pattern is synthesized directly from physical models describing the microstructure of the material under study, and the model parameters are then fitted to the measured data, thus overcoming the possible bias, which is introduced by integral breadth methods due to the arbitrariness of using analytical profile functions (see Sec. II. A).Reference Mittemeijer and Scardi39, Reference Mittemeijer and Welzel40, Reference Scardi, Leoni, Mittemeijer and Scardi50–Reference Scardi, Leoni and D’Incau52 The method has been successfully applied in several cases; recent applications have been summarized in Ref. Reference Scardi, Dinnebier and Billinge53. The basics are briefly described here.
The diffraction profile can be written as:
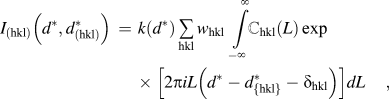 $$I_{({\rm{hkl}})} \left( {d^{\rm{*}} ,{\rm{}}d_{({\rm{hkl}})}^{\rm{*}} } \right)\, = \,k(d^{\rm{*}} )\mathop \sum \limits_{{\rm{hkl}}} w_{{\rm{hkl}}} \int\limits_{ - \infty }^\infty {\mathbb {C}_{{\rm{hkl}}} (L)\exp \left[ {2{\rm{\pi }}iL\left( {d^{\rm{*}} - d_{\{ {\rm{hkl}}\} }^{\rm{*}} - {\rm{\delta }}_{{\rm{hkl}}} } \right)} \right]dL} \quad,$$
where  $d_{({\rm{hkl}})}^* $ is the value of the reciprocal space variable d* at the Bragg position, k(d *) includes constants and known functions of d*, w hkland δhkl are, respectively, the weight of a reflection (related to its multiplicity) and the shift of a reflection from the exact Bragg position for a (hkl) member of the {hkl} family of crystallographic planes. The last parameter, δhkl, is related to lattice defects, like faulting, which, in addition to a profile broadening, causes different shifts of the various (hkl) subcomponents.Reference Warren54, Reference Velterop, Delhez, de Keijser, Mittemeijer and Reefman55 Thus, the observed peak profile is expressed as a weighted sum of all the different subcomponents. The Fourier transform ℂhkl(L) includes all the instrumental and specimen-related effects, such as the instrumental profile, domain size, faulting, dislocations, and antiphase domain boundaries, all of which are described by physical models.
In the present work, the XRD patterns were modeled by using PM2K,Reference Leoni, Confente and Scardi56 a software package based on the WPPM approach that allows refinement of the data by a nonlinear least squares fitting routine. The instrumental component is handled by fitting of pseudo-Voigt functions to the reflections recorded from a suitable standard specimen (e.g., LaB6, NIST SRM660a). The background, described with a Chebyshev polynomial (of degree 3), peak intensities, specimen displacement, and the lattice parameters of Ni and W were refined simultaneously for each diffraction pattern. The specimen-related physical broadening parameters to be determined by the fitting were the mean (μ) and variance (σ) of a lognormal size distribution adopted for spherical crystallites, the dislocation density (ρ) and the effective outer cutoff radius of the dislocations for both Ni and W, and, additionally, the faulting parameters α (deformation) and β (twin) for Ni, which has a fcc crystal structure. The average contrast factors for edge and screw dislocations, to be included as known data for the WPPM calculations, were obtained for the <110>{111} slip system with the Burgers vector  $a_0^{{\rm{Ni}}} $/(21/2) for Ni and the <111>{110} slip system with the Burgers vector
 $a_0^{\rm{W}} $ × (31/2/2) for W where a0denotes the concerned lattice parameter.
III. EXPERIMENTAL PROCEDURES
A. Ball milling
Ball milling was carried out at room temperature in a planetary ball mill (Fritsch Pulverisette P6) and in a high-energy shaker mill (Spex 8000M). Elemental powders of Ni, having a purity of 99.8 wt% and a particle size smaller than 50 μm (≤300 mesh), and of W, having a purity of 99:95 wt% and a particle size of 44–77 μm (≤200 mesh), were mixed to achieve a gross composition of 15 at.% W (both powders from Alfa Aesar GmbH & Co. KG, Karlsruhe, Germany). The powder mixtures were milled in WC–Co vessels (93.8 wt% WC and 6 wt% Co) with WC–Co milling balls (10 mm in diameter) of the same purity maintaining a ball to powder ratio of 10:1. All powders were handled under Ar atmosphere while filling the milling vessel to avoid contamination with impurities. The rotation speed of the planetary mill was maintained at 150 rpm. The chemical analysis [inductively coupled plasma optical emission spectroscopy (ICP-OES)] showed a small amount of about 0.7 at.% Co (contaminant from the milling media) in the longest time Spex-milled specimen. This content of Co leads to an insignificant increase in the lattice parameter of the Ni matrix (∼0.002 Å),57 e.g., as compared to the effect of the solute W, and this does not affect the conclusions drawn in this work (in particular regarding the amount of dissolved W; see Sec. IV. A. 2).
B. Ex situ and in situ XRD measurements
The microstructures of the materials under study were characterized using a Bruker AXS D8 Advance θ-θ diffractometer operating in the Bragg–Brentano geometry using Cu Kα radiation. The diffractometer was equipped with a Cu x-ray tube and a Ni absorption edge filter (to remove Cu Kβradiation) positioned in front of the one-dimensional position-sensitive VANTEC-1 detector (Bruker AXS). The x-ray tube was operated at a tube voltage of 40 kV and a tube current of 40 mA. An “infinitely thick” sample with a flat surface was prepared by gently pressing the sample (powder) into the sample holder cavity. The XRD patterns of the ball-milled powder samples were recorded in the range of 2θ = 30–140° (comprising the Ni 111, 200, 220, 311, 222, and 400 reflections and the W 110, 200, 211, 220, 310, 222, and 321 reflections) using a 0.25° divergence slit and a 0.5°antiscatter slit.
In situ heating and annealing experiments were conducted under a N2–H2 gas atmosphere (98% N2 and 2% H2) with a gas flow of 0.7 L/min, in an Anton Paar HTK 1200N oven chamber in the temperature range of 300–850 °C. A heating rate of 0.5 °C/s was used to reach each annealing temperature. During the heat treatment, in situ XRD measurements at selected temperatures were performed. The 2θ scan range was divided into three ranges to optimize the measurement conditions for minimal measurement time (the time per step was selected so that a peak maximum intensity of at least 2000 counts was achieved). The entire measurement (comprising all three 2θ ranges) took about 1 h. The measured diffraction patterns were analyzed either by fitting pseudo-Voigt functions with the α2/α1 ratio set to 0.5Reference Delhez and Mittemeijer58 to the measured reflections [for WH and single-line analysis (SLA)] or by WPPM. The instrumental broadening was characterized by measuring a LaB6powder specimen (NIST Standard Reference Material 660a; see Sec. II. A).
C. Scanning and transmission electron microscopy
The local microstructure and the morphology of the powder particles after various milling times were characterized by scanning and transmission electron microscopy.
Scanning electron microscopy (SEM) was performed using a JEOL 6300F microscope operated in secondary electron (SE) imaging mode at acceleration voltages between 3 and 5 kV depending on the specimen. For each specimen, a small amount of the powder particles was embedded in Polyfast. The specimen was then ground and polished.
Transmission electron microscopy (TEM) was performed on a Philips CM200 transmission electron microscope operated with a 200 kV electron beam. The electron transparent foils for TEM were prepared using a focused ion beam Nova Nanolab 600 workstation by the lift-out technique. To this end, first, a protective Pt layer was deposited covering the surface of a selected powder particle to prevent Ga+ damage in the region of interest during the following cutting and thinning process. Then, applying a focusing Ga+ ion beam operating at 30 KeV, a thin slice of the Ni powder particle was cut and ion beam cleaned. This slice of the powder particle was picked thereafter using a micromanipulator and then welded onto a Cu grid for TEM examination. Finally, this sample was thinned to electron transparency using low Ga+ ion currents of 10–30 pA.
D. Differential scanning calorimetry
Calorimetric experiments were conducted in a Perkin Elmer Pyris 1 differential scanning calorimeter (under high-purity argon gas flowing at a rate of 20 mL/min) using approximately 60 mg of powder. The temperature and the heat flow were calibrated by measuring the melting temperatures and the heats of fusion of pure In, Sn, and Zn. The samples were first heated to 80 °C at a heating rate of 10 °C/min followed by an isothermal hold for 300 min at 80 °C. The specimens were then heated to 340 °C at a heating rate of 20 °C/min. After reaching 340 °C, the specimens were cooled down to room temperature.
IV. RESULTS AND DISCUSSIONS
A. Microstructural evolution upon milling
1. Morphology
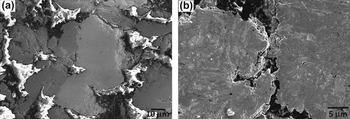
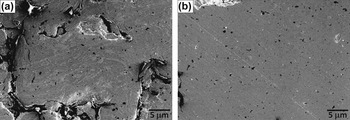
SEM micrographs of the powders milled in the planetary mill and the shaker mill are shown in Figs. 1 and 2, respectively. The bright gray phase in the micrographs represents the W phase (as will be shown in Sec. IV. A. 2, Ni does not dissolve significantly in W) and the dark gray phase in the micrographs represents the Ni(-rich) phase. After milling for 5 h in the planetary mill, the W and Ni particles have been welded together but the locations of the two elements are still distinctly separate [Fig. 1(a)]. After 80 h milling [Fig. 1(b)], the microstructure has undergone substantial changes and consists of lamellae of the more brittle W phase embedded inside the more ductile Ni(-rich) phase. Thereby, a significant increase of the contact area of W(-rich) and Ni(-rich) particles has been realized. A similar lamellar structure is obtained for powder prepared in the shaker mill already after 5 h of milling [Fig. 2(a) and compare with Fig. 1(b)]. After further milling, until a milling time of 30 h, a separate W phase can hardly be distinguished: a very fine dispersion of (remaining; see discussion in Sec. IV. A. 2) W particles in the Ni(-rich) matrix occurs [Fig. 2(b)].
SEM (SE) micrograph of powder particles after milling a Ni–15 at.% W powder mixture in the planetary mill for (a) 5 h and (b) 80 h. Bright gray phase: W phase; dark gray phase: Ni-rich phase.

SEM (SE) micrograph of powder particles after milling a Ni–15 at.% W powder mixture in the shaker mill for (a) 5 h and (b) 30 h. Bright gray phase: W phase; dark gray phase: Ni-rich phase. The different phases are almost indistinguishable in (b) (the black spots are due to the embedding material used for preparing specimens for cross-sectional analysis).

2. W dissolution in Ni
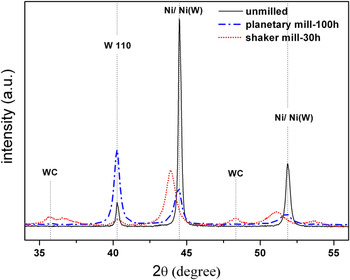
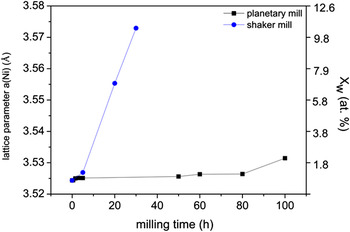
Sections of the diffraction patterns recorded from the initial powder mixtures (Ni–15 at.% W) and from the powders milled for the longest times in the shaker and planetary mills are shown in Fig. 3. Both the W 110 and the Ni 111 and 200 diffraction lines broaden considerably upon ball milling due to the reduction of the size of the diffracting crystallites and an increase in microstrain (see Sec. IV. A. 3). A shift of the Ni peaks to lower angles is ascribed to the dissolution of W in Ni (i.e., the lattice constant of Ni is increased upon W dissolution), which, as compared to the powder milled in the planetary mill, is much more pronounced for the powder milled using the shaker mill despite the much shorter milling time. The W concentration in Ni can be calculated from the peak position using lattice parameter data for the Ni-rich Ni(W) solid solution from Ref. Reference Welzel, Kummel, Bischoff, Kurz and Mittemeijer33. The obtained results are shown in Fig. 4. The powder milled in the planetary mill shows an initially small increase of the W content, which then stays practically constant up to 80 h of milling, followed by a relatively major increase to about 2 at.% W after 100 h of milling. For the powder milled in the shaker mill, the W peaks have almost completely vanished after 30 h of milling and the positions of the Ni peaks have shifted pronouncedly to lower 2θ values, thereby indicating dissolution of a very large part of W in the powder mixture into Ni: the composition of the alloy formed, as deduced from the line shifts, reveals that about 12 at.% of W has dissolved into Ni after 30 h of milling. Thus, mechanical alloying in the shaker mill using WC milling balls results in the formation of a Ni(W) solid solution of roughly the alloy composition as given by the phase diagram. On the contrary, no peak shift has been observed for the W reflections, and thus, no significant dissolution of Ni into W takes place, as expected according to the equilibrium phase diagram.
X-ray diffractograms of Ni–15 at.% W powder mixtures: unmilled and milled for the longest times in the planetary mill and the shaker mill.

Lattice parameter variation of the Ni-rich phase in Ni–15 at.% W powder mixtures milled in the planetary and shaker mills as function of the milling time. The ordinate at the right-hand side indicates the composition of the Ni(W) solid solution formed.

Whereas the maximum intensities of the diffraction peaks of the Ni(W) solid solution decrease upon prolonged ball milling, due to increasing peak broadening, the maximum of the W 110 diffraction line has increased appreciably after 100 h of ball milling in the planetary mill. The W 110 peak broadening has also increased significantly. Hence, the integrated intensity of the W 110 peak has increased pronouncedly. A possible explanation for this striking behavior could be the occurrence of a pronounced extinction effectReference Warren54 for the relatively coarse-grained W powder in the initial state, which vanishes upon pronounced ball milling, due to an increase of the crystalline imperfection as indicated by decrease of crystallite size and increase of microstrain; see the 110 reflection for W shown in Fig. 3 for the powder milled in the shaker mill.
The powder milled in the shaker mill with WC milling balls is contaminated, as can be seen from the diffraction pattern showing the presence of WC peaks, which is due to the abrasion of the brittle milling balls in this high-energy mill. The powders milled in the planetary mill do not show the presence of distinct impurities (according to chemical analysis by ICP-OES, less than a total 1 wt% of C, N, and O was present in the longest milled specimens).
3. Crystal imperfection
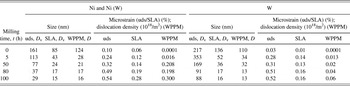
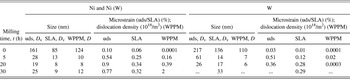
The results obtained by applying the different methods of line broadening analysis (see Sec. II) have been gathered in Tables I and II for powders milled in the planetary mill and shaker mill, respectively. The integral breadth methods (SLA and WH-uds) yield the volume-weighted column length, from which the volume-weighted crystallite size (diameter, D v) can be calculated assuming a spherical crystallite shape (see Sec. II. A). The WPPM method yields the average crystallite diameter, D, under the assumption of a spherical crystallite shape and a lognormal size (diameter) distribution.
Size–strain analysis results (as averages over all measured reflections) according to SLA and WH-uds methods and the WPPM for Ni–15 at.% W milled in the planetary mill. SLA, WH-uds: size D v and microstrain ε; WPPM: grain diameter D and dislocation density (in units of 1018/m2).

Size–strain analysis results (as averages over all measured reflections) according to SLA and WH-uds methods and the WPPM for Ni–15 at.% W milled in the planetary mill. SLA, WH-uds: size D v and microstrain ε; WPPM: grain diameter D and dislocation density (in units of 1018/m2).

According to the SLA, WH-uds, and WPPM methods (see Tables I and II), after an initial rapid decrease of the average crystallite size of both Ni and W, the rate of reduction of crystallite size decreases and a saturation crystallite size of about ∼15 nm for Ni and 16 nm for W according to SLA, 16 nm for Ni and 13 nm for W according to WPPM, is reached after 100 h of milling in the planetary mill. Slightly smaller crystallite sizes are obtained according to the different methods of diffraction line broadening analysis for the powders milled in the shaker mill: a saturation crystallite size of about ∼9 nm for Ni and 33 nm for W according to SLA and 12 nm for Ni a according to WPPM is reached after 30 h of milling. Analysis of the W peaks with WPPM was not possible for the longest milling time in the shaker mill due to the too low intensity of the W diffraction lines (indeed, an unrealistically high value for the grain size was obtained in the SLA).
The microstrain in the Ni(-rich) phase, according to SLA and WH-uds methods, and the dislocation density, according to WPPM, increase continuously upon prolonged ball milling in the planetary mill. The microstrain in the W phase according to SLA and WH-uds methods and the dislocation density according to the WPPM are distinctly smaller than in the Ni phase and also overall increase with increasing milling time.
The relatively hard bcc W phase, having a very high melting point (3410 °C) and a large elastic modulus (for W: 411 GPa; for Ni: 200 GPa), upon deformation behaves much different from the relatively soft fcc Ni phase. In the case of W, the grain size reduction upon ball milling may not be due to plastic deformation alone (i.e., by dislocation motion, possibly associated with subgrain formation), but may also be due to fracturing of the brittle W particles. Recognizing that grain size reduction due to breaking of particles occurs by transgranular fracture, thus the occurrence of grain size reduction without (such) pronounced increase of the microstrain/dislocation density is possible, as is observed here for W (see paragraph immediately above). Indeed, the SEM micrographs show a finely dispersed W phase in relatively large Ni grains on prolonged milling [see Figs. 1(b) and 2(b)].
The more effective ball milling realized in the shaker mill is also exhibited by the introduction of an amount of microstrain after only 5 h for which almost about 80 h of milling were required in the planetary mill (see Tables I and II).
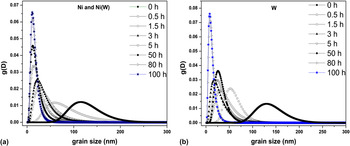
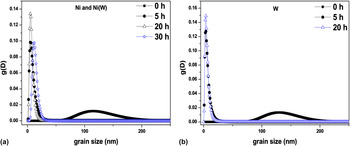
In addition to the mean crystallite size, the WPPM method also yields the width (variance) of the crystallite size distribution, making it possible to follow the effect of milling on the shape of the crystallite size distribution. The as-received Ni powder [Fig. 5(a)] shows an asymmetric broad size distribution; the size distribution for the as-received W powder is less broad and more symmetric [Fig. 5(b)]. In the early stages of milling (0–3 h) in the planetary mill, the crystallite size distribution for Ni [Fig. 5(a)], while shifting to smaller grain sizes, becomes slightly narrower and more asymmetric. After 5 h of milling, the size distribution gets distinctly narrower and the asymmetry starts reducing, indicating the formation of fine grains with a very small dispersion of size upon prolonged milling. In contrast with the change of the size distribution observed for the Ni(W) solid solution, W exhibits a crystallite size distribution that becomes increasingly broad and asymmetric upon ball milling in the planetary mill up to almost 50 h of milling time [Fig. 5(b)]. After 50 h of milling, the crystallite size distribution for the W phase abruptly gets narrow and becomes almost symmetric and shifts on the size scale to a smaller average grain size. Milling in the shaker mill (Fig. 6) shows similar trends as in the planetary mill; however, the width of the size distribution is smaller in the case of milling carried out in the shaker mill than as in the case of milling in the planetary mill.
Crystallite/grain size distribution with milling for (a) Ni and (b) W in Ni–15 at.% W powder mixture milled in the planetary mill.

Crystallite/grain size distribution with milling for (a) Ni and (b) W in Ni–15 at.% W powder mixture milled in the shaker mill.

Close inspection of the diffraction peak shapes reveals the occurrence of peak asymmetry for the Ni diffraction lines for, in particular, the longest milling time of 100 h in the planetary mill: the development of a more pronounced broadening at the low-angle sides of the Ni-rich phase diffraction lines (“left-hand asymmetry”) is indicative of W dissolution, resulting in lattice parameter increase; apparently, the W concentration in Ni is not (fully) homogeneous: W enrichment can occur in the proximity of the Ni–W interfaces (see Fig. 1; the microstructure at this stage consists of lamellae of the more brittle W embedded inside the more ductile Ni; see also what follows in Sec. IV. B). Milling in the shaker mill apparently leads to a more homogeneous distribution of W in Ni, as no pronounced Ni diffraction peak asymmetry could be discerned. It should be noted that neither the integral breadth methods (SLA and WH-uds) nor the WPPM method of line profile analysis consider a W concentration profile as a source of line broadening, and therefore, the microstructural parameters (in particular the microstrain), e.g., as obtained after 100 h of ball milling in the planetary mill, should be interpreted within this context.
B. Microstructural evolution upon annealing after milling
1. Crystal imperfection: grain growth
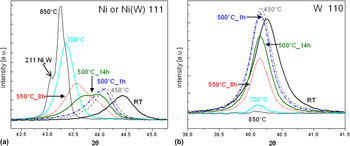
To investigate the grain coarsening behavior of the milled nanocrystalline material, non-ambient XRD measurements were performed on the powders milled in the planetary mill [the milling carried out in the shaker mill led to contamination (see Sec. IV. A. 2) due to abrasion of the milling equipment, and therefore, these specimens were not subjected to subsequent anneals]. Studies were performed in particular on the sample milled for 100 h in the planetary mill by heating (cumulatively) to various temperatures between 300 and 850 °C in steps of 50 °C while making in situ XRD measurements at the selected temperatures. Sections of the thus recorded diffraction patterns containing the Ni 111 and W 110 reflections have been gathered in Fig. 7. The measurements were performed repeatedly at each temperature, holding the temperature until no further changes in the diffraction pattern occurred, before proceeding to the next higher temperature.
XRD peak evolution of the nanocrystalline Ni(W) solid solution upon in situ annealing at different successive annealing temperatures for (a) the 111 reflection from the Ni(W) solid solution and (b) the 110 reflection from W. The times indicated in the figure denote the stage of (cumulative) annealing of the specimen (see Sec. III. B).

Except for peak shifts due to thermal expansion, no significant changes of the diffraction patterns of both the Ni-rich Ni(W) solid solution phase and the W phase occur up to 450 °C. At 500 °C, after annealing for 1 h, considerable broadening of the Ni(W) 111 reflection occurs, in parallel with an intensity decrease of the W 110 reflection. Upon continued annealing at 500 °C (for 14 h; see Fig. 7), the broadening is exhibited by the development of a pronounced shoulder at the low-angle side of the Ni(W) 111 reflection, while the W 110 reflection intensity decreases further. After continued intensity increase of the low-angle shoulder of the Ni(W) 111 reflection, a sharpening of the Ni(W) 111 reflection occurs during annealing to 700 °C; at this temperature, the W 110 diffraction line has almost completely vanished. Above 700 °C, the intermetallic phase Ni4W starts to develop.
These observed changes in the diffraction pattern can be interpreted as follows: the onset of pronounced dissolution of W into the Ni-rich Ni(W) solid solution occurs at 500 °C. This leads to a concentration variation in Ni(W) such that W-rich regions develop in the proximity of the interfaces of the finely dispersed W particles, embedded in Ni grains, with the Ni matrix, implying that regions with a lower W concentration prevail: pronounced broadening of the Ni(W) 111 reflection occurs. Upon further heating, a homogenization of the W concentration, associated with Ni(W) 111 peak narrowing, and a further uptake of W in the Ni(W) solid solution occur, leading to further decrease of the intensity of the W 110 reflection. Upon reaching the solubility limit for W in Ni, the intermetallic phase Ni4W forms. At 850 °C, the entire material consists of largely a Ni–12 at.% W solid solution and the minority Ni4W phase (in agreement with the Ni–W phase diagram).57
Since the broadening of the Ni peaks, induced by annealing of the nanocrystalline powders produced in the planetary mill, is due to W dissolution, the line broadening analysis methods used for the as-milled powder (Sec. IV. A) cannot be used here straightforwardly to extract information on microstructural change upon annealing. Therefore, the following approximate analysis described below has been adopted to trace the changes of microstructural parameters during annealing of the nanocrystalline powders.
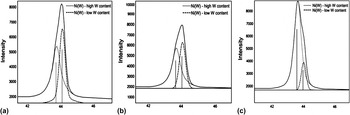
The asymmetric peaks of the Ni(W) solid solution in the diffraction patterns measured upon annealing are fitted using two symmetric pseudo-Voigt functions; the high angle peak is attributed to a Ni(W) solid solution with a lower W content and the low-angle peak is attributed to a Ni(W) solid solution with a high W content. This fitting procedure allows the decomposition of the asymmetric diffraction profiles into peaks pertaining to the W-rich and W-poor parts of the Ni(W) phase (see above). Examples of this fitting procedure are provided in Fig. 8.
Decomposition of the 111 Ni(W) reflection by using two symmetric pseudo-Voigt functions: the lower angle peak represents the high W content Ni(W) and the higher angle peak represents the low W content Ni(W) in the powder at different stages of annealing as indicated in the figure.

It follows that with increasing annealing time at 500 °C, the integrated intensity of the peak attributed to the Ni(W) solid solution with a high W content increases, whereas the integrated intensity of the peak from the Ni(W) solid solution with a low W content decreases [Figs. 8(a) and 8(b)]. Upon continued annealing at 550 °C, a further increase of the intensity of the high W content peak occurs, concurrent with a further decrease of the intensity of the low W content Ni(W) peak, along with narrowing of all diffraction profiles [Fig. 8(c)]. Eventually, at higher temperatures, the profile can again be fitted with one single symmetric function, while the broadening further reduces.
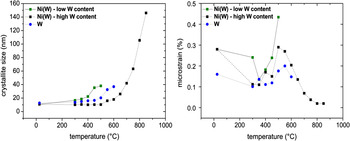
On the above basis, the crystallite size and the microstrain have been calculated using the SLA by averaging over all measured reflections. The thus determined developments of the crystallite size and microstrain with increasing temperature are shown for the different phases in Fig. 9.
Development of the crystallite size and the microstrain for the different phases [low W content Ni(W) and high W content Ni(W), and W] as function of temperature. The plotted data are those obtained from the last measurement performed at each temperature.

With increasing annealing temperature, the Ni-rich crystallites containing a relatively higher content of W reveal a lower degree of grain growth than the Ni-rich crystallites of small W content: grain growth is suppressed for the W-rich Ni(W) solid solution up to a temperature of almost 500 °C, whereas grain growth in the W-poor Ni(W) solid solution starts at a temperature of about 400 °C. The relatively large value of microstrain for the W-poor Ni(W) solid solution at 400 °C can be understood as the consequence of concentration inhomogeneity.Reference Leineweber and Mittemeijer59 Starting at a temperature of 650 °C, the Ni(W) diffraction peaks can be well fitted (again) with a single (symmetric) pseudo-Voigt function and the W peak intensities have then reduced such pronouncedly that further line broadening analysis of the W peaks has become impossible. These observations imply that the last remaining W dissolves in the Ni(W) solid solution, which at the same time realizes homogenization of the W concentration in the Ni(W) grains. [Note that the microstrain value representing a W concentration variation (see above) reduces markedly above 500 °C and eventually becomes negligible.] The lattice parameter of the Ni(W) solid solution eventually reaches a saturation value upon increasing annealing temperature compatible with the maximum solubility of W in Ni (∼12 at.%).57
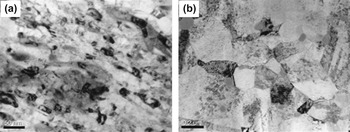
The grain growth evolution exhibits a grain size <30 nm even after annealing at a temperature of 650 °C. Subsequent annealing at higher temperature induces pronounced grain growth: a mean grain size of ∼150 nm is reached at 850 °C. TEM micrographs made for this stage of annealing (Fig. 10) confirm the grain size at this stage as determined by XRD: the as-milled specimen consists of crystallites with sizes of the order 10 nm [Fig. 10(a)], which have grown more or less uniformly upon annealing up to 850 °C [Fig. 10(b)], i.e., showing no signs of abnormal grain growth (which contrasts with the observation of abnormal grain growth taking place in pure Ni powder milled under similar conditions).Reference Rane, Welzel and Mittemeijer60
TEM bright field micrographs of the Ni–15 at.% W powder (a) as milled for 100 h in the planetary mill and (b) after annealing the milled specimen up to 850 °C.

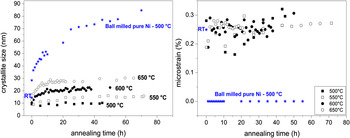
Noncumulative isothermal annealing experiments were conducted at temperatures in the range from 500 to 650 °C while performing in situ XRD measurements. The thus determined grain size and microstrain evolutions, upon isothermal annealing at various temperatures, for the W-rich Ni(W) solid solution are shown in Fig. 11. The microstructural evolution of ball-milled pure Ni powder, prepared under exactly the same milling conditions and subsequently annealed isothermally at 500 °C (see data indicated by the symbol ⋆), has also been presented in Fig. 11. Evidently, the nanocrystalline Ni(W) solid solution experiences a very much smaller grain growth than the nanocrystalline pure Ni. At 500 °C, no grain growth occurs for the W-rich Ni(W) solid solution, which is in line with the results reported in Ref. Reference Detor and Schuh10 that a nanocrystalline microstructure was stabilized up to a temperature as high as 500 °C in electrodeposited Ni–W films containing between 6 and 21 at.–%W. At temperatures higher than 500 °C, grain growth takes place (Fig. 11).
Crystallite size and microstrain of the W-rich Ni(W) solid solution phase as function of annealing time at the temperatures indicated. The star data points pertain to pure Ni, which was ball milled under the same conditions and having a quite similar initial microstructure as the Ni–W specimens subjected to isothermal anneals indicated in the figure (RT denotes the data point of the as-milled Ni before annealing).

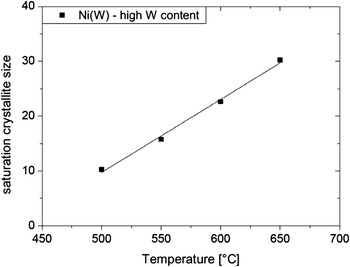
The crystallite/grain size appears to attain a saturation value at each temperature [Fig. 11(a)]. This saturation value increases with increasing annealing temperature (Fig. 12). A possible dramatic decrease of the genuine microstrain due to crystalline imperfection, as observed to take place prominently for pure Ni [see ⋆ data points in Fig. 11(b)], is masked by the microstrain-like broadening due to the compositional inhomogeneity (see above).
The stability of the microstructure of the nanocrystalline W-rich Ni(W) solid solution, as compared to nanocrystalline pure Ni, up to an annealing temperature of about 500 °C has to be ascribed to the (consequence of the) presence of dissolved W. On the one hand, grain boundary energy reduction can be caused by W segregation, i.e., the driving force for grain coarsening is reduced. On the other hand, an increased activation energy for grain boundary migration can be due to the presence of dissolved W.Reference Detor and Schuh10, Reference Choi, Al-Kassab, Gärtner, Kreye and Kirchheim38
Maximum crystallite size obtained for the W-rich Ni(W) phase upon isothermal annealing at each temperature.

2. Composition of the Ni(W) solid solution
To determine the change of the W content of the Ni(W) solid solution during annealing, the development of the lattice parameter of the Ni(W) solid solution, as derived from both the high and low W content Ni(W) peak positions, was traced by XRD. The dependence of the Ni(W) lattice parameter on W content was adopted according to Ref. Reference Welzel, Kummel, Bischoff, Kurz and Mittemeijer33.
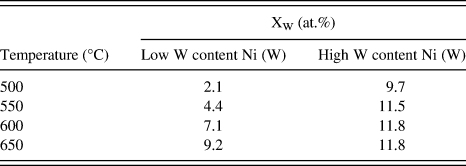
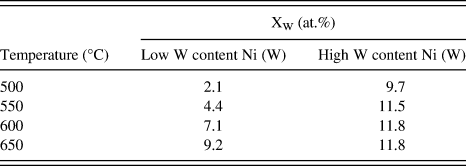
The development of the lattice parameter of the high and low W content Ni(W) solid solutions, as determined at the end of each isothermal annealing process (i.e., pertaining to the saturation crystallite size), is provided by the data gathered in Table III. The high W content Ni(W) phase attains the maximum equilibrium concentration of ∼12 at.% at 600 °C. At this temperature, the low W content Ni(W) phase has a W content still below the maximum equilibrium concentration. This corresponds with the presence of a distinct W concentration gradient in the Ni grains even at this high temperature of 600 °C: the dissolution of W into the Ni(W) phase and its subsequent homogenization occur relatively slowly. This can be considered as a consequence of a small driving force for dissolution, i.e., the small negative heat of mixing of Ni and W (approximately −3 kJ/mol) and the small diffusivity of W in Ni.Reference Brandes and Brook61
W content of the high W content and low W content Ni(W) solid solutions as determined from lattice parameter measurements (i) for the Ni(W) solid solution with a low W content and (ii) for the Ni(W) solid solution with a high W content, for the samples isothermally annealed at various temperatures.
3. Enthalpy change: heat evolution
A number of studies have focused on the heat (enthalpy) evolution during annealing of both pureReference Jang and Atzmon62, Reference Zhao, Sheng and Lu63 and alloyedReference Choi, da Silva, Klement, Al-Kassab and Kirchheim64, Reference Blázquez, Ipus, Millán, Franco, Conde, Oleszak and Kulik65 nanocrystalline materials. Exothermic effects have mainly been attributed to two irreversible reactions: grain boundary relaxation and grain growth. During grain boundary relaxation, energy stored in the form of excess free volumeReference Kuru, Wohlschlogel, Welzel and Mittemeijer66 and/or grain boundary dislocations (excess grain boundary dislocations are additional dislocations with respect to the geometrically necessary grain boundary dislocations that account for the misorientation across the boundary and that are associated with the structural geometry of the boundary) is released as the boundary transforms to a more stable configuration. Crystallite growth is also an exothermic process because of the associated reduction of total grain boundary area in the specimen.
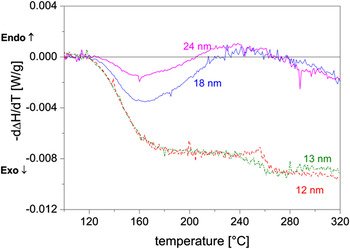
In the present work, calorimetric measurements were carried out on specimens milled in the planetary mill for various times to produce different grain sizes. For specimens with very small grain sizes, an exothermic heat evolution starts at ∼120 °C and extends beyond the measurement, temperature region (Fig. 13). As in this temperature region, no grain growth occurs (see Sec. IV. B. 2); it is concluded that grain boundary relaxation processes are responsible for this heat evolution, which agrees with the results obtained for electrodeposited NiW reported in.Reference Detor and Schuh10
Heat flow (= −d∆H/dT) as function of temperature for the samples milled for various times (grain size obtained upon milling has been indicated in the plot) in the planetary ball mill. A heating rate of 20 °C/min was used for the data shown.

V. CONCLUSIONS
(i) Ball milling of elemental powder mixtures of Ni and W, with a nominal composition of Ni–15 at.% W, carried out in a planetary mill and a high-energy shaker mill, leads to the formation of a nanocrystalline Ni(W) solid solution phase with a crystallite size of one to a few tens of a nanometer. A considerable compositional inhomogeneity is present in the Ni(W) phase produced by ball milling, as evidenced by the asymmetric nature of its diffraction peaks. A maximum solute concentration of ∼12 at.% W in Ni was obtained upon milling in the shaker mill for 30 h.
(ii) The milling process in the shaker mill is much more efficient than that in the planetary mill: similar degrees of powder mixing/alloying can be obtained by using the shaker mill in a much shorter time as compared to the planetary mill.
(iii) As compared to the pronounced grain growth occurring in nanocrystalline ball-milled pure Ni powder upon annealing, the nanocrystalline Ni(W) solid solution produced by ball milling does not show grain growth up to about 500 °C. At higher temperatures, crystallite/grain growth occurs. At the same time, the (remaining) W dissolves into the Ni(W) solid solution phase, resulting in concentration inhomogeneities exhibited by pronounced diffraction line broadening.
(iv) Before grain growth occurs, significant grain boundary relaxation takes place, as revealed by a significant amount of released heat at this stage.
(v) The distinction of a high W content Ni(W) phase and a low W content Ni(W) phase allows a good fitting of the observed diffraction line broadening. The high W content Ni(W) phase experiences a lesser degree of grain growth than the low W content Ni(W) phase.
ACKNOWLEDGMENTS
The authors thank Dr. S. Meka and Dr. E. Bischoff for beneficial discussions and help with the TEM analysis. We also thank Prof. Dr. P. van Aken for providing access to transmission electron microscopy facilities.