I. INTRODUCTION
Nanoindentation measurement involves continuously monitoring the load and depth of an indenter during an indentation process at the microscale and nanoscale. This technique is often used to assess materials’ nanomechanical properties at high spatial resolution. The material systems being measured include thin-films, coatings, nanostructured material, surface, interface/interphase, microelectromechanical systems, and functionally graded materials, with which the conventional mechanical tests become ineffective or inaccessible based on the size of specimen and the testing equipment. 1–Reference Hu, Shrestha and Fan4 Material’s various mechanical properties can be determined by nanoindentation, such as Young’s modulus, hardness, yield strength, and stress–strain relationship, in a micro/nano scale level which undoubtedly facilitated the reliable design of devices and structural applications of materials with microsized or nanosized features. With the advancement of technology, different indenter tips have been made with reduced size, different shapes, and improved accuracy. The accuracy and reliability of the load versus depth measurements have also been improved. However, since the pyramidal sharp-tip, such as Berkovich, conical, Vickers, or spherical tip, constantly changes its contact area as it is undergoing an indentation, the true projected contact area of the indenter on the specimen is unknown which makes the material property extracting from the testing data more difficult or less accurate. A cylindrical flat-tip indenter has a constant contact area allowing for the indenter to press on the specimen. A mechanical model proposed for directly extracting the yield strength of the tested materials, based on the hemispherical stress–strain distribution assumption, was analytically derived and numerically validated. Reference Hu, Lynne, Markondapatnaikuni and Delfanian5,Reference Hu, Lynne and Delfanian6 This nanoindentation technique using a cylindrical flat-tip indenter was successfully used to characterize the material’s elastic–plastic properties at microscale and nanoscale. Reference Hu, Lynne, Markondapatnaikuni and Delfanian5–Reference Lu, Kurapati and Yang14
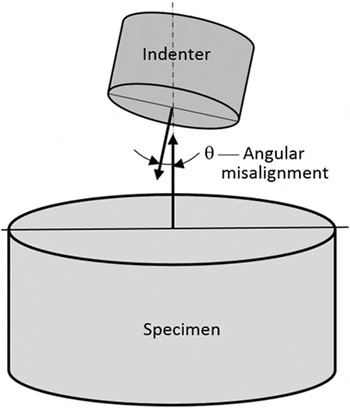
However, due to the structural tolerance of the testing device and the imperfection of the specimen preparation, the surface of the testing specimen is not perfectly perpendicular to the symmetric axis of the tip and results in a so-called angular misalignment between the normal to the specimen’s testing surface and the symmetric axis of the indenter tip, as shown in Fig. 1. The influence of the angular misalignment on the load versus depth measurement data can be ignored when the misalignment angle is less than 1.2° for the indentation using a pyramidal sharp-tip indenter, such as Berkovich, conical, Vickers, whereas in nanoindentation using a cylindrical flat-tip indenter the load versus depth measurements are extremely sensitive to the angular misalignment, even if the misalignment angle is less than 1°. Reference Tadmor, Miller and Phillips15–Reference Paoli and Volinsky23 In theory, in nanoindentation testing using a cylindrical flat-tip indenter, the contact area does not change with the indentation depth. However, incomplete contact between the flat-tip surface and the specimen testing surface occurs at the beginning stage of the indentation because of the angular misalignment. Thus, to achieve full contact between the tip surface and the specimen testing surface, a preloading process would be adopted which results in a totally different load versus depth response from the nanoindentation tests. So far the effect of this angular misalignment on the nanoindentation load versus depth response remains unclear and how to correct the error from the testing data induced by the angular misalignment remains unknown.
Schematic of angular misalignment in nanoindentation using a cylindrical flat-tip indenter.

In this work, the effect of an angular misalignment on the load versus depth measurements from a nanoindentation testing using a cylindrical flat-tip indenter was numerically investigated. A nanoindentation three-dimensional solid model was built and finite element analysis (FEA) was conducted. The misalignment angles ranging from 0° to 1° were considered in the modeling to explore the effect of the misalignment angle on the elastic–plastic property characterization and to minimize the influence of such an induced error on the testing measurements. The numerical modeling was validated by experiments. Low carbon steel AISI 1018 was selected as nanoindentation testing sample material and its material properties were extracted from the standard tensile tests and input for modeling. Young’s modulus and hardness were evaluated, and 0.1% offset and 0.2% offset yield strengths were adjusted.
II. COMPUTER MODELING OF NANOINDENTATION
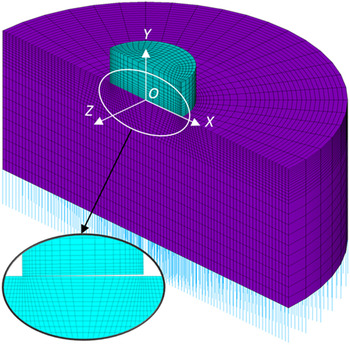
Commercial FEA software ANSYS® version 15.0 24 was used for modeling the nanoindentation using a cylindrical flat-tip indenter. A three-dimensional model was built, assuming that the misalignment angle between the normal of the specimen testing surface and the symmetric axis of the indenter ranges from 0° to 1°. 3D homogeneous structural elements of SOLID185 were used for modeling three-dimensional indenter and specimen. The elements have nonlinear capabilities, such as large strain, large deflection, and elasto-strain hardening plasticity. To model the contact between the flat-tip surface of the indenter and the specimen testing surface, a surface-to-surface contact model was used, in which 3D target segment TARGE170 and 3D contact element CONTA173 were used. The target elements were used to represent various “target” surfaces for the associated contact elements. Contact occurs when the element surface penetrates one of the target segment elements on a specified target surface. Coulomb and shear stress friction are allowed. The modeling of the indentation testing load versus depth is sensitive to the specimen thickness and the FEA model generated was much smaller than the real one due to the limitation of the total number of elements and computational time. These factors led to the introduction of spring elements of COMBIN39 vertically connecting to each node on the bottom of the specimen Reference Hu, Shrestha and Fan4–Reference Hu, Lynne and Delfanian6 to correct this expected error caused by insufficient thickness of the model. COMBIN39 is a unidirectional element with nonlinear generalized force-deflection capability that can be used to treat real continuous materials as discretized element and to characterize the interactions between the material points in the area away from the plastic deformation zone. Thus, COMBIN39 defines elastic properties of the physical body. The model was meshed as shown in Fig. 2. The specimen dimensions are 40 μm in diameter and 20 μm in height. The nominal diameter of the cylindrical tip is 10 μm. However, using 3D laser scanning microscope, the actual diameter measured is 9.318 μm.
3D view of meshed nanoindentation model.

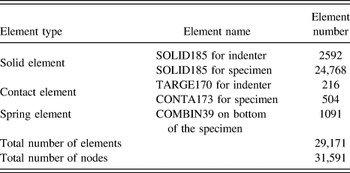
For improving the accuracy of the modeling and saving the computational time, it is important to check the mesh density and to refine them accordingly. Since the deformation during the indentation process is primarily concentrated underneath the indenter around the edge of the indenting area, denser meshes around this critical region were used. For the same reason, a symmetric plane (x–y plane) was assumed for the model, so that only halves of the specimen and indenter were generated for modeling. The proper element size, total elements, and total nodes were determined as in the current model (listed in Table I) through convergence study of the indentation load versus depth so that the model in Fig. 2 is mesh-independent.
Number of elements and nodes used in modeling.

Defining appropriate boundary and loading conditions is another crucial factor to get an authentic solution. The origin of the Cartesian coordinate system is defined at the center on the top surface of the specimen underneath the indenter tip. All the nodes on the x–y symmetric plane (z = 0) were constrained without perpendicular displacement, i.e., at z = 0, u z = 0. The bottom nodes of the spring elements are fixed, i.e., u x = u y = u z = 0. The stiffness coefficients of the spring element are determined by fitting the load–depth curves of the sample material so that the model can be used to predict the nanoindentation tests. All the nodes on the top of the indenter were constantly moving down for conducting indentation testing and then lifting up for unloading, referring to Fig. 1.
To be consistent with the material used in nanoindentation tests, tensile tests were conducted to find the material elastic–plastic properties for modeling inputs. The low carbon steel AISI 1018 was selected as the testing specimen material, Reference Hu, Lynne, Markondapatnaikuni and Delfanian5,Reference Hu, Lynne and Delfanian6 the following material data were extracted: Young’s modulus E = 208.24 GPa, Poisson’s ratio ν = 0.3, yield strength σ y = 439.8 MPa at yield strain ε y = 0.211%, 0.1% offset yield strength σ y0.1 = 500.4 MPa at yield strain ε y0.1 = 0.340%, and 0.2% offset yield strength σ y0.2 = 513.2 MPa at yield strain ε y0.2 = 0.446%. The necking onset occurred at engineering strain of approximately 5.5%. The true stress–true strain was corrected after the necking point based on the net cross-sectional area in the necking area. Diamond material was used for cylindrical flat-tip indenter, where Young’s modulus E i = 1140 GPa and Poisson’s ratio ν i = 0.07. The fiction coefficient between the contact surfaces of the indenter (diamond) and the polished specimen (metal), including the top surface of the specimen, and the bottom and the edge of the flat-tip indenter, was measured as 0.15. Reference Hu, Lynne, Markondapatnaikuni and Delfanian5 The friction is not sensitive to the indentation’s elasticity, such as Young’s modulus calculation, even to the yield strength estimation, since the sliding between the indenter and the specimen is very mild when the indentation reaches the indentation depth with regard to the yield point. Reference Hu, Lynne, Markondapatnaikuni and Delfanian5
III. RESULTS AND DISCUSSION
A. Load versus depth curves
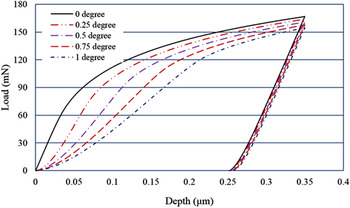
The effect of the angular misalignment on indentation load versus depth measurement was numerically investigated. The indenter was deliberately tilted over an angle of 0, 0.25°, 0.5°, 0.75°, and 1°, respectively, with respect to its perfectly aligned position. The corresponding load–displacement curves were recorded in Fig. 3, where an increasing angle of misalignment leads to a decrease load, especially in the earlier stage of the indentation due to the point contact and localized plastic deformation.
Load versus depth for various angular misalignment at maximum depth of 0.35 μm.

B. Young’s modulus and hardness
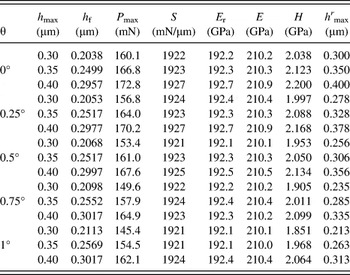
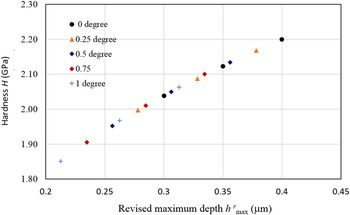
The mechanical properties, such as Young’s modulus E and hardness H, were calculated from the nanoindentation load-depth modeling data and listed in Table II, where the misalignment angle ranges from 0° to 1° and the maximum indentation depth from 0.3 μm to 0.4 μm. It can be seen that the influence of the misalignment angle and the maximum depth on Young’s modulus is less than ±0.5% and can be neglected. The reason is that the difference of the contact areas between a perfect alignment case and a misalignment angle of 1° case is less than 1‰ which can be neglected, and after fully loaded indentation, the unloading for both cases would follow the same linear elastic pathway, on which the Young’s moduli were calculated. Therefore, the effect of a small misalignment angle can be neglected. The contact area used in Table II is based on a perfect alignment indentation and the very small perturbation of Young’s modulus values extracted from modeling is within the simulation error. While the influence on hardness close to ±10%, and as the misalignment angle increases the error increases. The reason is that the hardness is very sensitive to the indentation depth, since AISI 1018 is a elastoplastic material with strain hardening. A larger indentation depth leads to a larger strain, a higher deformation load, and a greater hardness, thus, proper defining the indentation depth for a misalignment model is critical. After adjusting the maximum depth (listed as h r max in the last column in Table II) by counting the center point on the bottom area of the flat-tip indenter as the contact point, the error induced by the angular misalignment on the hardness measurement was minimized, and the hardness versus the revised maximum depth are consistent whatever the misalignment angles are, as shown in Fig. 4.
Nanoindentation data analysis for different misalignment angles and at various maximum depths (θ = 0°, 0.25°, 0.5°, 0.75°, and 1°, h max = 0.3, 0.35, and 0.4 μm).

Note:
 ${h'_{\max }} = {h_{\max }} - a\,\sin \theta$
, where a is the radius of the cylindrical flat-tip indenter.
Hardness versus revised maximum depth for various misalignment angle (θ = 0°, 0.25°, 0.5°, 0.75°, and 1°).

C. Stress–strain development at the beginning of indentation
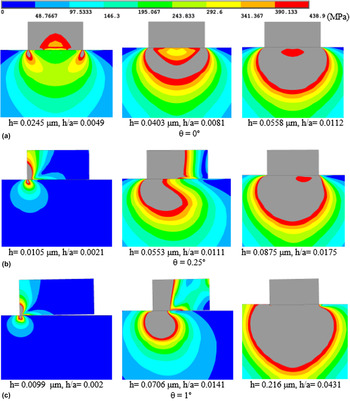
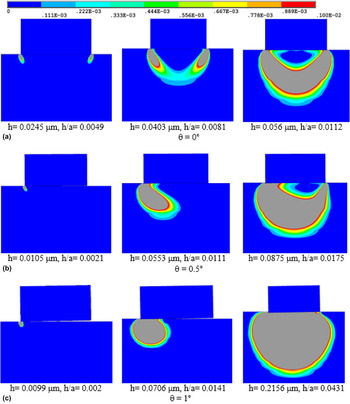
The stress–strain development in the beginning of the indentation process for different angular misalignments is shown in Figs. 5 and 6. It is observed that for the case of having an angular misalignment, even for a small load a local plastic deformation occurred near the edge of the indenter tip. As the misalignment angle increases, the model makes a steady hemispheric stress and strain distribution at a greater depth. Therefore, instead of an idealized plane contact at the very beginning of the indentation, with an angular misalignment, the stress and strain development process is starting from a point contact to a line contact and then plane contact, and a deeper depth is needed to form a steady hemispherical stress or strain distribution as the misalignment angle gets larger. In these cases, a modified depth, corresponding to the formation of a steady hemispheric stress and strain distribution, should be considered to find the yield strength.
von Mises stress development in the beginning of the indentation process for different angular misalignments (θ = 0°, 0.25°, and 1°).

von Mises strain development in the beginning of the indentation process for different angular misalignments (θ = 0°, 0.25°, and 1°).

D. Yield strength estimation
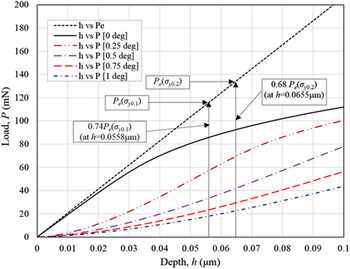
If a perfect elastic model is considered, ignoring the plasticity of the material, the indentation load P e is proportional to the Young’s modulus of the specimen E and the ratio of the indentation depth to the indenter radius h/a. Reference Hu, Lynne, Markondapatnaikuni and Delfanian5,Reference Hu, Lynne and Delfanian6 The comparison of the indentation load versus depth curves for the perfectly elastic model and the elastoplastic model is shown in Fig. 7. It shows that when the model is perfectly aligned (misalignment angle θ = 0°), the load of an elastoplastic material at the depth corresponding to the hemispherical stress–strain distribution contour model formed with σ y0.1 and σ y0.2 are 26% and 32%, respectively, lower than that of the perfectly elastic material model. A significant lower load can be observed from the model with angular misalignment than that from the perfectly elastic material and without angular misalignment. The pressure around the cylindrical indenter contact edge is infinite for the perfectly elastic material model while the pressure is finite value for an elastoplastic material model due to the plastic deformation, refer to Fig. 6.
Indentation load versus depth comparison for a perfectly elastic and elastoplastic material model at the beginning state for measuring yield strength.

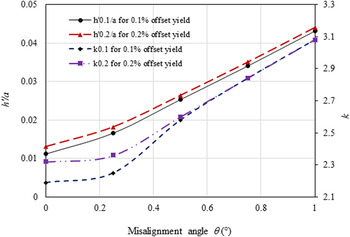
Table III lists the indentation data obtained from modeling. With an appropriate depth modification, the yield strength at 0.1% offset and 0.2% offset were evaluated from the modeling. Fig. 8 shows the relationships between the misalignment angle θ and the relative depth h′/a for forming a hemispherical stress–strain distribution or modifier coefficient k for estimating yield strength.
Indentation modeling data for extracting yield strength.

Note: The 0.1% and 0.2% offset yield strengths are
 ${\sigma _{y0.1}} = {{{P_{0.1}}} \over {{k_{0.1}}A}}$
and
 ${\sigma _{y0.2}} = {{{P_{0.2}}} \over {{k_{0.2}}A}}$
, respectively, where A is the indenter contacting area, A = πa
2,
Reference Hu, Lynne, Markondapatnaikuni and Delfanian5,Reference Hu, Lynne and Delfanian6
k
0.1 and k
0.2 are the modifiers determined from the calibration test or modeling, and P
0.1 and P
0.2 are the indentation loads at the depth h′0.1 and h′0.2, respectively. h′0.1 and h′0.2 are the depths corresponding to the hemispherical stress–strain distribution contour model formed with angular misalignment for σ
y0.1 and σ
y0.2, respectively.
Misalignment angle versus ratio of depth to radius h′/a or modifier coefficient k.

E. Misalignment angle measurement from tests
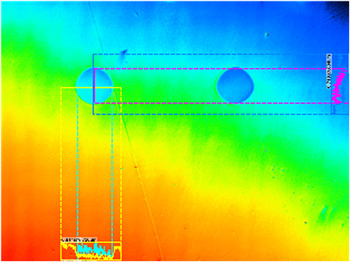
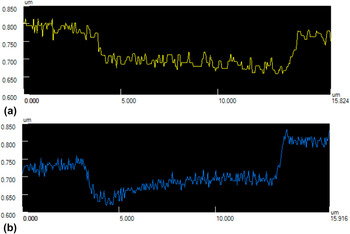
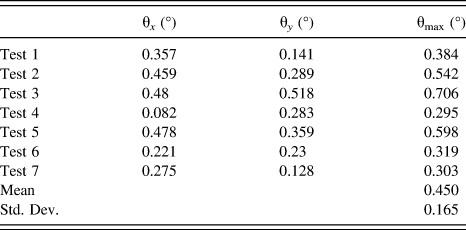
The existence of angular misalignment on the cylindrical flat-tip indentation test creates significant errors for finding the yield strength of the material from the load–displacement graph. Indentation tests done by Hu et al. Reference Hu, Lynne and Delfanian6 were used as the experimental results for the current work. The indentation profiles obtained from the tests were utilized to analyze the angular measurement. Figure 9 shows the surface profiles of a specimen scanned from KEYENCE VK-9710 Color 3D Violet Laser Scanning Microscope (Keyence Corp. of America, Itasca, Illinois). Profile lines (blue wavy line on the left bottom and pink wavy line on the upper right) were measured horizontally and vertically across the upper left indentation such that the maximum to minimum height of the indentation along these lines can be measured. Based on the profile lines, the laser microscope allows for calculating the angle of the specimen surface which was used to estimate the misalignment angles of the indentation. The detailed profile (surface height) measurements are shown in Fig. 10, in which the indentation region and the entire profile line for both horizontal and vertical lines are included. Table IV lists the misalignment angles measured from the indentation profiles of the specimens. Due to the difference of the testing and surface conditions from each indentation, the maximum misalignment angles measured range from 0.295° to 0.706° with a mean value of 0.450°.
Selected profile lines from specimen surface for surface measurement.

Profile measurement from a typical indentation for estimating angular misalignment: (a) horizontal and (b) vertical.

Calculated maximum misalignment angles from the indentation profile measurements.

F. Nanoindentation test data analysis
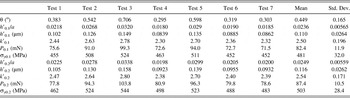
Table V summarizes the indentation data with measured misalignment angles. By considering the misalignment angle, the corrected relative depths h′0.1/a and h′0.2/a and the modifiers k 0.1 and k 0.2 can be interpreted from Table III or Fig. 8. Then the depths h′0.1 and h′0.2 corresponding to the formation of the hemispherical stress–strain contours of σ y0.1 and σ y0.2 can be calculated, where the practical cylindrical indenter tip diameter 2a takes 9.318 μm. Based on h′0.1 and h′0.2, the loads P 0.1 and P 0.2 from the load–depth curves can be read. Finally, the 0.1% offset and 0.2% offset yield strengths σ y0.1 and σ y0.2 can be calculated. The mean value of the yield strengths σ y0.1 and σ y0.2 are 481 and 503 MPa, respectively, with the standard deviations of 32.0 MPa and 28.4 MPa, respectively, and errors of 3.9% and 2.0%, respectively, comparing to the actual yield strengths of σ y0.1 = 500.4 MPa and σ y0.2 = 513.2 MPa. Possible error sources include testing specimen preparation (surface roughness) and the misalignment angle measurement.
0.1% and 0.2% offset yield strength estimation by indentation testing data.

G. Dimensional analysis in nanoindentation
Dimensional analysis, or physical similarity analysis, is very important, since the dimension, i.e., the diameter (2a), of the cylindrical flat-tip indenter matters the indentation load versus depth measurements. In the above experimental and modeling data analysis, what size of the indenter diameter should be properly selected? How can the experimental data from the indentation tests using a cylindrical flat-tip indenter of a 9.318 μm in diameter be compared with the modeling data by a nominal diameter of 10 μm? Furthermore, is it possible that the aforementioned data and analysis, and even the conclusive statement can be applied to the general nondimensional parametric analysis? The answer is YES, Reference Hu, Lynne, Markondapatnaikuni and Delfanian5,Reference Baker, Westine and Dodge25,Reference Zohuri26 based on the dimensional analysis and similarity principle on a replica model, i.e., a model of a dynamic system or structure of exactly the same geometry and materials as a prototype, but scaled in size alone. In the aforementioned analysis of a quasistatic mechanical model, nondimensional parameters, such as the ratio of the indentation depth to the indenter radius h/a, have been adopted, referring to Figs. 5, 6 and 8 and Tables III and V, so that the modeling data, especial the yield strength data, can be compared with the experimental data, even though the indenter diameter by the modeling is slightly larger than that by the testing. In addition, since the grain size of a low carbon steel, e.g., AISI 1018 in this study, is around a couple of micrometers in diameters, Reference Davis27 and an indenter diameter of 10 μm can cover dozens of such grains underneath the contact area and plastic deformation involves hundreds of such grains during the indentation testing. Therefore, the effect of the grain orientations can be neglected.
H. Comparison of the misalignment angle effect on indentation by different types of indenters
As discussed in the Introduction, a more or less misalignment angle always exists due to the structural tolerance of the testing device and the imperfection of the specimen preparation. Reference Tadmor, Miller and Phillips15–Reference Paoli and Volinsky23 For a spherical indenter, since it has a rotational symmetry, i.e., its shape looks the same after some rotation by a partial turn, thus, there is no influence on indentation measurements if a finite misalignment angle exists. For a pyramidal sharp-tip indenter, such as Berkovich, conical, or Vickers, the angular misalignment results in increases in the indentation load, contact area and contact stiffness at the same penetration depth. This results in a underestimation of indentation projected contact area, and in turn leads to an overestimation of the mechanical properties measured by nanoindentation. Research indicated that the influence of the angular misalignment on the load versus depth measurement of an indentation test can be ignored when the angle is less than 1.2°. However, when the angle is larger than 1.2°, the misalignment angle needs to be determined and the measurement compensation needs to be estimated. Simulation shows that a 5° misalignment angle results in about 25% contact area higher than untitled indentation. The misalignment angle can be assessed from measurements of the sides of the indented impression if a good image is available. A simple but effective method is based on the ratio of the long to short side of the indented impression. Reference Oliver and Pharr16 But practically, the accuracy is questionable. For an advanced indentation device, the tilt correction functionality could be integrated into the controlling software for measuring the tilt and adjust the data. Reference Srivastava17 For a cylindrical flat-tip indenter with a constant contact area, from this study, the influence of the angular misalignment on Young’s modulus assessment can be ignored when the angle is less than 1° or even a little bit larger. However, other properties assessed are sensitive to the misalignment angle and need to be adjusted accordingly, such as the hardness to be adjusted by considering an average or effective indentation depth instead of the contact depth, and yield strength—one of the advantages of the property measurement by a flat-tip indenter—to be adjusted by considering a misalignment angle related correction factor. The tilt angle assessment is easier and more accurate based on the indented impression.
IV. CONCLUSIONS
This study shows that the elasticity and yield strength of metallic materials can be characterized through a micro/nanoindentation test using a cylindrical flat-tip indenter. Due to the angular misalignment, to effective estimate the 0.1% offset and 0.2% offset yield strengths of the specimens, corrected indentation depths, h′0.1 and h′0.2, and the yield strength calculation modifiers, k 0.1 and k 0.2, corresponding to the formation of the hemispherical stress–strain distribution model, need be considered. To adjust the hardness, an average or effective indentation depth needs be considered. The influence of the angular misalignment can be ignored for assessing hardness in the case of a small misalignment angle. Numerical modeling is a powerful and effective tool to conduct this critical calibration and adjustment.
ACKNOWLEDGMENTS
The authors gratefully acknowledge generous support from the South Dakota Research Infrastructure Center Programs of Composite and Nanocomposite Advanced Manufacturing Center (CNAM) and the Materials Evaluation and Testing Lab (METLab), along with the Department of Mechanical Engineering at South Dakota State University. Help from Kevin Lynne for contacting nanoindentation tests and computational facility supported from University High Performance Computing at South Dakota State University are gratefully acknowledged.