Introduction
Individuals with psychotic disorders such as schizophrenia typically exhibit neurocognitive deficits in overall cognitive abilities, attention, working memory, declarative memory, and executive functioning (Green, Horan, & Lee, Reference Green, Horan and Lee2019; Harvey & Rosenthal, Reference Harvey and Rosenthal2018; Mesholam-Gately, Giuliano, Goff, Faraone, & Seidman, Reference Mesholam-Gately, Giuliano, Goff, Faraone and Seidman2009; Sheffield, Karcher, & Barch, Reference Sheffield, Karcher and Barch2018). Frequently, these individuals also demonstrate deficits in ‘social cognition’, which refers to a multidimensional set of cognitive abilities that are necessary to learn social norms and to perceive emotions and other social cues in interpersonal interactions. Importantly, impairments in social cognitive domains may impair social functioning more than other types of neurocognitive deficits (Fett et al., Reference Fett, Viechtbauer, Dominguez, Penn, van Os and Krabbendam2011; Green et al., Reference Green, Horan and Lee2019; Green, Horan, & Lee, Reference Green, Horan and Lee2015; Harvey, Strassnig, & Silberstein, Reference Harvey, Strassnig and Silberstein2019).
Current research on social cognition in schizophrenia is primarily conducted in high-income countries with urban samples comprised of young adults with good education who are currently in treatment (Bell, Corbera, Johannesen, Fiszdon, & Wexler, Reference Bell, Corbera, Johannesen, Fiszdon and Wexler2013; Bora, Yucel, & Pantelis, Reference Bora, Yucel and Pantelis2009). Much less is known about social cognition among individuals with schizophrenia in low- and middle-income countries (LMIC), particularly those living in rural communities where the level of education is low, where many community residents with psychosis are older adults, and where a substantial proportion of individuals with psychosis have never received antipsychotic medication. Another limitation of current research is that many studies use instruments that assess social cognition by asking respondents to make comments on stories or case vignettes [e.g. Mayer-Salovey-Caruso Emotional Intelligence Test MSCEIT test (Mayer, Salovey, Caruso, & Sitarenios, Reference Mayer, Salovey, Caruso and Sitarenios2003), Hinting Task test (Corcoran, Mercer, & Frith, Reference Corcoran, Mercer and Frith1995), and the Combined Story Test (Achim, Ouellet, Roy, & Jackson, Reference Achim, Ouellet, Roy and Jackson2012)], some of which make cultural assumptions or describe situations that are unfamiliar to rural respondents from LMIC.
Another commonly used test of social cognition, the Reading the Mind in the Eyes Test (RMET) (Baron-Cohen, Wheelwright, Hill, Raste, & Plumb, Reference Baron-Cohen, Wheelwright, Hill, Raste and Plumb2001), is not based on interpreting stories or vignettes, so it is potentially less culture-dependent and, thus, may be more suitable for use in LMIC. Based on the first stage of the Theory of Mind, RMET assesses an individual's use of social cues to attribute another person's mental state. Respondents are shown images of the eye region of 36 Caucasian faces along with four adjectives describing contrasting mental states (e.g. terrified, upset, arrogant, annoyed) and asked to select the label that best reflects the mental state of each individual pictured and (to ensure the respondent is attending to the task) to indicate the individual's gender. The psychometric properties of RMET are good (Eddy, Reference Eddy2019; Pinkham, Penn, Green, & Harvey, Reference Pinkham, Penn, Green and Harvey2016), but some authors report that it has poor construct validity because – like many other cognitive measures – it assesses a multifactorial construct (Carter et al., Reference Carter, Barch, Gur, Gur, Pinkham and Ochsner2009; Olderbak et al., Reference Olderbak, Wilhelm, Olaru, Geiger, Brenneman and Roberts2015). The RMET has been translated into 21 languages.
Although originally developed for autism spectrum disorders, RMET has also been widely used to assess social cognition in schizophrenia (Balogh, Égerházi, Berecz, & Csukly, Reference Balogh, Égerházi, Berecz and Csukly2014; Caletti et al., Reference Caletti, Paoli, Fiorentini, Cigliobianco, Zugno, Serati and Altamura2013; Couture, Penn, Addington, Woods, & Perkins, Reference Couture, Penn, Addington, Woods and Perkins2008; Donohoe et al., Reference Donohoe, Duignan, Hargreaves, Morris, Rose, Robertson and Corvin2012; Guastella et al., Reference Guastella, Hermens, Van Zwieten, Naismith, Lee, Cacciotti-Saija and Hickie2013; Kettle, O'Brien-Simpson, & Allen, Reference Kettle, O'Brien-Simpson and Allen2008; Mazza et al., Reference Mazza, Catalucci, Pino, Giusti, Nigri, Pollice and Gallucci2013; Stanford, Messinger, Malaspina, & Corcoran, Reference Stanford, Messinger, Malaspina and Corcoran2011; Thaler, Allen, Sutton, Vertinski, & Ringdahl, Reference Thaler, Allen, Sutton, Vertinski and Ringdahl2013; Vohs et al., Reference Vohs, Lysaker, Francis, Hamm, Buck, Olesek and Breier2014; Zhang et al., Reference Zhang, Tang, Cui, Lu, Hu, Liu and Wang2016). However, the small sample sizes in these studies (only one had more than 100 subjects) make it impractical to adjust RMET results for important potential confounders such as age, gender, and years of schooling; only one of the studies made such adjustments (Thaler et al., Reference Thaler, Allen, Sutton, Vertinski and Ringdahl2013). Moreover, these studies were all conducted in urban areas among young or middle-aged adults (range in mean age: 23–48) with relatively high levels of education (at least middle school) who were regularly receiving antipsychotic medications. The social cognition of patients with schizophrenia who are older, have little or no formal schooling, live in rural communities, or have never been treated with antipsychotic medication has not, to our knowledge, previously been assessed.
Using a parallel Chinese version of RMET with 34 pictures of eyes of Asian individuals, Wang and coworkers reported that social cognition was worse in individuals with schizophrenia than in healthy controls (Wang, Wang, Zhu, & Wang, Reference Wang, Wang, Zhu and Wang2006). Another research team in China combined a translation of the 36-item English version with the 34-item Chinese version (Zhang et al., Reference Zhang, Tang, Cui, Lu, Hu, Liu and Wang2016, Reference Zhang, Cui, Wei, Tang, Xu, Tang and Wang2018) into a combined 70-item Chinese version of RMET (RMET-CV). Using this instrument with urban, well-educated respondents, they found that compared to healthy controls, social cognitive deficits are most severe in patients with chronic schizophrenia and less severe in individuals at clinical high risk for schizophrenia.
This paper reports on the administration of the 70-item RMET-CV in 234 untreated patients with chronic schizophrenia (UT), 154 treated patients with chronic schizophrenia (TC), and 259 healthy controls (HC), most of whom reside in rural communities in China. Included participants are quite distinct from typical samples used in previous studies: they had a mean (s.d.) age of 51.1 (11.7) years and a mean of 4.0 (3.6) years of schooling (30% never attended school). Revisions in the administration and scoring of the RMET-CV (without changing the test items themselves) were required to make it suitable for use with these subjects; we call our revised scale the ‘revised Chinese version of RMET’ (RMET-CV-R).
In addition to confirming previous results about deficits in social cognition among patients with schizophrenia in this unique sample of respondents, this analysis aims to assess several previously unexplored issues: (1) differences in social cognition between never-treated and currently treated patients, (2) the feasibility of administering RMET-CV-R as an interviewer-completed instrument, and (3) the feasibility of administering RMET-CV-R to older respondents and respondents with little or no formal education – respondents not included in previous studies with RMET or RMET-CV.
Methods
The administration of the RMET-CV-R reported in this paper was part of an ongoing study comparing cognitive functioning among UT, TC, and HC. All participants were community residents primarily living in rural parts of the Ningxia Hui Autonomous Region (a province in northwest China) and the Guangxi Zhuang Autonomous Region (a province in southwest China). Cognitive function was assessed using an adapted Chinese version of the Measurement and Treatment Research to Improve Cognition in Schizophrenia (MATRICS) Consensus Cognition Battery (MCCB-CV-R; Stone et al., Reference Stone, Cai, Liu, Grivel, Yu, Xu and Phillips2020). Pilot testing revealed that rural residents with limited education were unfamiliar with the situations described in the MSCEIT vignettes used to assess social cognition in the original Chinese version of MCCB (Shi et al., Reference Shi, Kang, Yao, Ma, Li, Liang and Yu2015), so MSCEIT was replaced with RMET-CV-R in the MCCB-CV-R.
Participants
UT and TC were identified from the provincial registries of individuals with severe mental disorders in Ningxia and Guangxi, which are part of the National Continuing Management and Intervention Program for Psychoses (Wu et al., Reference Wu, Ma, Wang, Zhang, Guan, Ma and Lu2019), which aims to register and treat all persons with severe mental disorders throughout China. HC were identified from individuals registered in local health clinics (which register all permanent residents) in Ningxia.
Preliminary screening for eligibility and willingness to participate was checked by phone for all three groups (UT, TC, HC), followed by a home or local clinic visit to confirm study eligibility. During the face-to-face visit and after receiving written consent from the participant (and an adult family member for UT and TC), the adapted Chinese version of the Structured Clinical Interview for DSM-IV (SCID-IV) (Phillips & Liu, Reference Phillips and Liu2011) was administered by a trained psychiatrist, a detailed history of medication use was obtained, and the inclusion and exclusion criteria for the study were assessed. Enrollment criteria for UT included: (1) meets DSM-IV diagnostic criteria for schizophrenia, and (2) completely untreated (had never received any antipsychotic treatment) or virtually untreated (i.e. less than 15 days of lifetime antipsychotic treatment, no antipsychotic treatment in the last 5 years, and no history of hospitalization in a psychiatric ward). Criteria for TC included: (1) meets DSM-IV diagnostic criteria for schizophrenia, (2) received antipsychotic medications regularly (i.e. for more days than not) for at least 30 days at some point during the first 2 years after the initial onset of psychotic symptoms, (3) received antipsychotic medications regularly over the 90 days before assessment, and (4) had similar duration of illness and demographic factors (i.e. gender, age, years of schooling, urban v. rural residence, ethnicity) to UT. Criteria for HC included: (1) never had psychotic symptoms, (2) never received antipsychotic treatment, (3) not receiving treatment for any mental disorder at the time of assessment, and (4) had similar demographic characteristics to UT.
Exclusion criteria for all three groups included: (1) less than 18 years of age; (2) history of intellectual disability starting in childhood, epilepsy, severe brain injury, or other organic mental disorder; (3) current substance use disorder; (4) currently suicidal or violent; and (5) (for UT and TC) severe psychotic symptoms that precluded completion of the cognitive assessment [i.e. score of ‘7’ on the Positive and Negative Symptom Scale (PANSS; Kay, Fiszbein, & Opler, Reference Kay, Fiszbein and Opler1987) items assessing delusions, hallucinations, or conceptual disorganization].
Assessments
Demographic information
Demographic variables collected included age, years of schooling, gender, ethnicity [i.e. Han (the majority ethnic group in China) v. any minority ethnic group], and location of residence (urban v. rural).
Diagnosis and duration of illness
Participants were diagnosed by trained psychiatrists using the research version of SCID-IV. The DSM-IV diagnoses were converted to DSM-5 diagnoses by listening to the audiotapes of the diagnostic interviews; all individuals meeting DSM-IV criteria for schizophrenia also met DSM-5 criteria. Duration of illness was the time interval between the first onset of hallucinations, delusions, or disorganized thinking and the interview.
Social cognition
The 70-item RMET-CV-R used to assess social cognition employed the same black-and-white stimulus pictures (15 cm × 6 cm) as the 70-item RMET-CV, 36 of which were identical to those used in the original English version of RMET. Pictures are presented on a computer screen, and participants first select one of four adjectives (shown with the picture) that best describes the emotion depicted and then judge the gender of the depicted person. There is no time limit for each selection. When participants find it hard to decide, they are asked to make their best guess. Before starting the formal test, there is a training session using two pictures of Asian eyes.
In this study, 59.4% of the sample (n = 384) were over 60 years of age or had less than 5 years of schooling; that is, they did not meet the inclusion criteria used in China to develop norms for the MCCB [limited to individuals <60 years of age who had ⩾5 years of full-time schooling (Shi et al., Reference Shi, Kang, Yao, Ma, Li, Liang and Yu2015)]. Moreover, 88% of respondents had never used a computer. To conduct the test with these respondents, it was necessary to make several changes in the administration of the test (without changing the presented items or optional descriptors provided in the original versions of the test). We trained respondents to use the computer mouse, provided more extensive training about the task's requirements, and had interviewers read test items to illiterate or semi-literate respondents. Details of these changes are provided in the Supplementary Materials.
Other instruments
In addition to the RMET-CV-R, the Mini-Mental State Examination (MMSE; Folstein, Folstein, & McHugh, Reference Folstein, Folstein and McHugh1975) was administered to all respondents, and PANSS was administered to respondents with schizophrenia.
Outcome measures
RMET-CV-R completion status
Given the possibility that some older or uneducated respondents could not successfully complete RMET-CV-R, we classified the completion status of each test administration as ‘successfully completed’ or ‘incomplete’ (subclassified as incomplete due to ‘refusal to do the test’, ‘inability to complete the test because of difficulty understanding the provided emotional descriptors’, or ‘inability to understand what is expected in the test’). Operational criteria for these classifications are provided in the Supplementary Materials.
RMET-CV-R test scores
The RMET-CV-R test score recorded for all successfully completed tests is the percentage of correct judgments about the emotion exhibited in the presented slides (i.e. number of correct responses divided by 70).
Statistical analysis
All comparisons between UT, TC, and HC were conducted on the full sample and separately on four subsamples. To facilitate comparison of results between respondents who could complete the computer-based test on their own with those who had the test read by the interviewer (a new method of administering the test), we stratified the sample into ‘self-completed’ and ‘interviewer-completed’ subsamples. To facilitate comparison of results between respondents typically included in previous studies with RMET with those of older, less educated respondents (typically excluded from such studies), we used the inclusion criteria for the Chinese MCCB normalization sample for RMET (Shi et al., Reference Shi, Kang, Yao, Ma, Li, Liang and Yu2015) to stratify the sample into an ‘educated-younger’ subsample (<60 years of age with ⩾5 years of schooling) and an ‘undereducated-older’ subsample (⩾60 years of age or <5 years of schooling). The numbers of respondents in the three groups in the full sample and the four subsamples are shown in Fig. 1.
Enrollment, stratification, and completion status of participants. UT, untreated case; TC, treated control; HC, healthy control. *Respondents with ⩾5 years of schooling and <60 years of age are classified as ‘educated-younger’ and those with <5 years of schooling or ⩾60 years of age as ‘undereducated-older’.

We use Stata version 15 SE for all analyses. Bivariate comparisons of the means of continuous variables used t tests (two groups) or ANOVA (three groups) with Tukey tests for pairwise comparisons. Bivariate comparisons of the mean ranks of ordinal variables used Mann–Whitney tests (two groups) or Kruskal–Wallis tests (three groups), and bivariate comparisons of categorical variables used χ2 tests; a Tukey-type multiple comparison test was used for pairwise comparisons when three groups were assessed (Zar, Reference Zar1999).
In the multivariate analyses, years of schooling were stratified into five levels (1 = 0 years, 2 = 1–4 years, 3 = 5–7 years, 4 = 8–10 years, and 5 = 11 years or more), and duration of illness was stratified into four levels (1 = under 10 years, 2 = 10–19 years, 3 = 20–29 years, and 4 = 30 years or longer). Multiple logistic binary regression compared RMET-CV-R completion status between groups while adjusting for demographic covariates (i.e. age, gender, schooling, residence, ethnicity). General linear regression compared RMET-CV-R scores between groups while adjusting for demographic covariates and heteroscedasticity; confidence intervals of coefficients were calculated using the robust standard error. The adjusted probability of successfully completing the test, the adjusted mean score of each group, and the corresponding confidence intervals were calculated using mean values of continuous covariates and proportions of categorical covariates in the full sample and separately in the two subsamples.
We also compared completion status and RMET-CV-R scores between UT and TC (excluding HC), adding the duration of illness as a covariate and, in separate analyses, both the duration of illness and total PANSS score as covariates (shown in Supplementary tables).
All tests were two-tailed, and the level of significance was set at 0.05.
Results
Characteristics of participants
Participants had a mean (s.d.) age of 51.1 (11.7) years, a median (IQR) duration of formal schooling of 4 (0–7) years [195 (30.2%) had never attended school], 55.7% were female, 90.9% were living in rural communities, 40.7% were members of a minority ethnic group, and their mean MMSE total score was 22.0 (10.7). The full sample was stratified into self-completed (n = 237, 36.7%) and interviewer-completed (n = 409, 63.3%) subsamples, and into educated-younger (n = 262, 40.6%) and undereducated-older (n = 384, 59.4%) subsamples.
TC were younger than UT and HC in the full sample and all four subsamples (Table 1), though the differences were not statistically significant in all cases. With the single exception of a higher proportion of female TC in the undereducated-older subsample, gender, years of schooling, residence, and ethnicity were not significantly different between UT, TC, and HC in the full sample or any of the subsamples. In the full sample and all subsamples, the MMSE total score was significantly greater in HC than in TC and significantly greater in TC than in UT, even after adjusting for demographic factors.
Demographic characteristics of the full sample and different subsamples

RMET-CV-R, Revised Chinese Version of the Reading the Mind in the Eyes; UT, untreated group; TC, treated controls; HC, healthy controls; ns, not significant; MMSE, Mini Mental Status Exam; PANSS, Positive and Negative Syndrome Scale.
Statistically significant results are bolded.
a ANOVA is used to compare means across groups and Tukey test is used for pairwise comparisons.
b Kruskal–Wallis test is used to compare non-normal continuous variables in three groups and Mann–Whitney test is used to compare non-normal continuous variables in two groups.
c If the overall χ2 value is statistically significant, pairwise comparisons between groups are made using a Tukey-type test for proportions (Zar, Reference Zar1999).
d Thirteen UT (three in the educated-younger subsample and 10 in the undereducated-older subsamples) and one TC in the undereducated-older subsample did not complete MMSE.
e Student's t test is used to compare the mean of continuous variables between untreated patients and treated controls.
Among the 387 participants with schizophrenia, mean duration of illness was 22.5 (11.6) years and mean PANSS total score was 71.7 (22.1). Duration of illness was significantly greater in UT than in TC in the full sample and in the interviewer-completed and undereducated-older subsamples. In the full sample and all four subsamples, PANSS total score was significantly greater in UT than in TC (Table 1), even after adjusting for demographic factors. In the TC group, patients used antipsychotic medications for a mean of 77.2% (28.6%) of the total duration of illness.
Completion status of RMET-CV-R
Among the 646 participants, 472 (73.1%) successfully completed RMET-CV-R. The 174 (26.9%) who did not successfully complete the test included 37 (5.7%) who refused, 78 (12.1%) who understood what was required but were unable to complete the test (primarily due to limited vocabulary), and 59 (9.1%) who were unable to understand test instructions despite several attempts to explain the requirements.
In the full sample and all subsamples, HC had the highest successful completion rates, TC had intermediate successful completion rates, and UT had the lowest successful completion rates (Table 2). Differences between HC and the two patient groups were statistically significant in the full sample and all subsamples, but the difference between TC and UT was only statistically significant in the full sample and in the interviewer-completed and undereducated-older subsamples.
RMET-CV-R completion status in the full sample and different subsamples

RMET-CV-R, Revised Chinese Version of the Reading the Mind in the Eyes; UT, untreated group; TC, treated controls; HC, healthy controls; ns, not significant.
Statistically significant results are bolded.
a χ2 compares proportion of completed tests across three groups (df = 1), if statistically significant, pairwise comparisons between groups are made using a Tukey-type test for proportions (Zar, Reference Zar1999).
Results of multivariate binary logistic regression analysis (Table 3) of the full sample show that group status (HC>TC>UT), younger age, male gender, and higher levels of education are all significantly associated with successful completion of RMET-CV-R, but residence and ethnicity are not. The same pattern is evident in the interviewer-completed and undereducated-older subsamples. However, in the self-completed and educated-younger subsamples, while successful completion rates remain significantly higher in HC than in UT and TC, the higher successful completion rates in TC than in UT are not statistically significant, and successful completion is not significantly different by age, gender, or years of schooling.
Multivariate logistic regression comparing rates of successful completion of RMET-CV-R between UT, TC, and HC in the full sample and different subsamples

RMET-CV-R, Revised Chinese Version of the Reading the Mind in the Eyes; TC, treated control; UT, untreated case; HC, healthy control.
Statistically significant results are bolded.
a One case (in HC group) was excluded from the analysis as an outliner because there is only one case in the education group ‘1–4 years’.
b Two cases (one in UT group and one in TC group) were excluded from the analysis as outliers because there were only two cases in the education group ‘11 years or above’.
c Denotes the reference group.
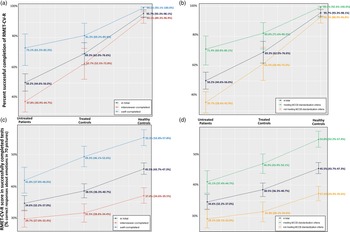
As shown in Fig. 2a and 2b, in the full sample and all subsamples after adjusting for inter-group differences in age, gender, education, ethnicity, and residence, the percent successful completion is highest in HC, intermediate in TC, and least in UT. However, the magnitude of the difference in successful completion rates between the self-completed v. interviewer-completed subsamples and between educated-younger v. undereducated-older subsamples is smallest in HC, intermediate in TC, and largest in UT.
Adjusted percent (and 95% CI) of untreated cases, treated controls, and healthy controls who successfully complete RMET-CV-R in the self-completed and interview-completed subgroups (a) and in respondents who do or do not meet MCCB standardization criteria (b); and among untreated cases, treated controls, and healthy controls who successfully complete RMET-CV-R, adjusted mean RMET-CV-R scores (percent correct responses about emotions in 70 pictures, with 95% CI) in the self-completed and interview-completed subgroups (c) and in respondents who do or do not meet MCCB standardization criteria (d).

As shown in online Supplementary Table 1A and 1B, when limiting analyses to the two patient groups and controlling for duration of illness, adjusted percent successful completion in TC is significantly higher than that in UT (69.0% v. 50.8%, OR = 2.61, 95% CI 1.58–4.29); however, when controlling for both duration of illness and PANSS total score, this difference is no longer statistically significant (62.1% v. 55.4%, OR = 1.47, 95% CI 0.85–2.56).
RMET-CV-R test scores
Among the 472 successfully completed tests, the mean (s.d.) completion time was 14.4 (6.1) minutes, and the mean RMET-CV-R score was 42.1% (16.1%) for the recognition of the emotion expressed in the 70 presented pictures. Respondents correctly identified gender in 81.3% (13.1%) of the pictures, which indicates that they were attending to the task.
In the full sample and all subsamples, the recognition of emotion was greatest in HC, intermediate in TC, and lowest in UT (Table 4); however, these differences were not statistically significant in all cases. For all three groups (UT, TC, and HC), emotion recognition was significantly greater in self-completed v. interviewer-completed subsamples and significantly greater in educated-younger v. undereducated-older subsamples. Moreover, the magnitude of the difference in emotion recognition scores between HC and UT was greater in the self-completed subsample (12.7%) than in the interviewer-completed subsample (4.8%) and greater in the educated-younger subsample (13.4%) than in the undereducated-older subsample (5.9%).
Unadjusted RMET-CV-R mean (s.d.) scores (percent correct responses in 70 pictures) for UT, TC, and HC in all respondents who successfully completed RMET-CV-R and in different subsamples of respondents who successfully completed RMET-CV-Ra

RMET-CV-R, Revised Chinese Version of the Reading the Mind in the Eyes; TC, treated control; UT, untreated case; HC, healthy control; ns, not statistically significant.
Statistically significant results are bolded.
a Comparisons between the three groups use ANOVA; if statistically significant pairwise comparisons are made using the Tukey test.
Results of the multivariate linear regression (Table 5) show that after adjusting for demographic covariates, HC had significantly higher RMET-CV-R scores than TC and UT both in the full sample and in all four subsamples. TC also had higher scores than UT in the full sample and in all four subsamples, but the difference was not statistically significant in the interviewer-completed and undereducated-older subsamples.
Multivariate linear regression comparing RMET-CV-R scores (percent correct responses about emotions in 70 pictures) between untreated cases (UT), treated controls (TC), and healthy controls in the full sample and four subsamples

RMET-CV-R, Revised Chinese Version of the Reading the Mind in the Eyes; TC, treated control; UT, untreated case; HC, healthy control.
Statistically significant results are bolded.
a One case (in healthy control group) was excluded from the analysis as an outliner because it is the only case in the education group ‘1–4 years’.
b One case (in treated control group) was excluded from the analysis as an outlier because it is the only case in the education group ‘11 years or above’.
c Denotes the reference group.
As shown in Fig. 2c and 2d, the adjusted mean RMET-CV-R scores in the full sample and all four subsamples are highest in HC, intermediate in TC, and lowest in UT. However, differences in the adjusted mean scores between UT and TC are greater in the self-completed (7.4%) v. interviewer-completed (1.8%) subsample and greater in the educated-younger (5.9%) v. undereducated-older (2.3%) subsample.
As shown in online Supplementary Table 2A and 2B, when limiting analyses to the two patient groups, after adjusting for demographic variables, duration of illness and PANSS total score were not significantly associated with patients' RMET-CV-R scores.
Discussion
Despite their low level of education (median of 3 years of schooling) and relatively high age (mean age = 53 years), 95% of HC successfully completed RMET-CV-R, indicating the feasibility of administering RMET-CV-R to elderly, undereducated adults who are commonly excluded from studies of social cognition. After adjustment for differences in age and education in the three groups, successful completion rates in HC, TC, and UT were 96, 69, and 50%, respectively. The much lower successful completion rates in the patient groups suggest that failure to complete the scale successfully was not primarily due to low education or older age but, rather, to some aspect of the illness (or an interaction between illness factors, education, and age). In all three groups of participants, the MMSE score – a global measure of cognition – was significantly lower in those who did not successfully complete RMET-CV-R, even after adjusting for age, education, and other covariates (results provided on request). Thus, even though group differences in successful completion rates of the RMET-CV-R may not directly assess differences in social cognition, they could be considered proxies for differences in global cognitive functioning.
Given the higher proportions of UT and TC unable to successfully complete RMET-CV-R than HC, RMET-CV-R scores (based on successfully completed tests) in the patient groups exclude results for patients with the lowest levels of functioning, attenuating the difference in RMET-CV-R scores between patients and HC. Nevertheless, patients who successfully complete RMET-CV-R have significantly lower scores than HC, confirming the findings of previous reports with RMET (Balogh et al., Reference Balogh, Égerházi, Berecz and Csukly2014; Caletti et al., Reference Caletti, Paoli, Fiorentini, Cigliobianco, Zugno, Serati and Altamura2013; Couture et al., Reference Couture, Penn, Addington, Woods and Perkins2008; Donohoe et al., Reference Donohoe, Duignan, Hargreaves, Morris, Rose, Robertson and Corvin2012; Kettle et al., Reference Kettle, O'Brien-Simpson and Allen2008; Mazza et al., Reference Mazza, Catalucci, Pino, Giusti, Nigri, Pollice and Gallucci2013; Stanford et al., Reference Stanford, Messinger, Malaspina and Corcoran2011; Thaler et al., Reference Thaler, Allen, Sutton, Vertinski and Ringdahl2013; Wang et al., Reference Wang, Wang, Zhu and Wang2006) and RMET-CV (Zhang et al., Reference Zhang, Tang, Cui, Lu, Hu, Liu and Wang2016, Reference Zhang, Cui, Wei, Tang, Xu, Tang and Wang2018). This result confirms the discriminant validity of our revised version of the RMET.
In all three groups (UT, TC, and HC), the successful completion rate and the RMET-CV-R score were significantly higher among respondents who self-completed the scale than among those who had to have the interviewer read the items, and significantly higher among educated-younger respondents than among undereducated-older respondents. These differences between the subsamples in the expected direction in all three groups provide further support for our revised scale's discriminant validity.
In both the bivariate and multivariate analyses, the rate of successful completion of RMET-CV-R and the mean RMET-CV-R score were highest in HC, intermediate in TC, and lowest in UT in the full sample and all four subsamples. The similarity in the pattern of results between the interviewer-completed and self-completed subsamples and between the undereducated-older and educated-younger subsamples confirms the feasibility of having interviewers read RMET items to the respondent (which has not previously been attempted) and of administering the revised instrument to less-educated, older respondents (who have not previously been included in studies of RMET).
Adjusted rates of successful completion and adjusted mean RMET-CV-R scores were significantly higher in TC than in UT in the full sample (including all three groups) and in the analysis limited to the two patient groups with additional adjustment for duration of illness, but not significantly different when adjusting the two patient groups for both duration of illness and PANSS total score, possibly because the inclusion of some cognitive-associated symptoms in PANSS attenuates the difference in RMET-CV-R scores between UT and TC. In the subsamples, for all three analyses (i.e. the three-group analysis and two two-group analyses with additional covariates), the adjusted rate of successful completion is significantly higher in TC than in UT in the subsamples with less education (i.e. interviewer-completed and undereducated-older subsamples), while the adjusted RMET-CV-R score is significantly higher in TC than in UT in the subsamples with more education (i.e. self-completion and educated-younger subsamples). That is, among all patient respondents, prolonged antipsychotic treatment has a greater effect on the ability to successfully complete the test in patients with lower levels of education; while among patients able to complete the test successfully, antipsychotic treatment has a greater positive effect on test scores in patients with higher levels of education. These cross-sectional findings suggest that prolonged treatment with antipsychotic medications (over 70% of the total duration of illness in this sample) could potentially mitigate deficits in social cognition in chronic schizophrenia, a possibility that needs to be confirmed in long-term prospective studies.
Several authors have discussed concerns about the relatively strong correlation of RMET scores with vocabulary level or reading level (Eddy, Reference Eddy2019; Olderbak et al., Reference Olderbak, Wilhelm, Olaru, Geiger, Brenneman and Roberts2015; Pinkham, Harvey, & Penn, Reference Pinkham, Harvey and Penn2018). In this study, we read the items to those unable to read, exclude results of respondents unable to understand the descriptive terms in the slides, and adjust all results for respondents' educational level. To the extent that educational level reflects pre-illness vocabulary level, our results are also adjusted for vocabulary. The much higher proportions of UT and TC than HC unable to successfully complete RMET-CV-R due to limited vocabulary (20, 17, and 3%, respectively) suggests – but does not prove – that patients' vocabulary level declined over the course of their illness; that is, their current impoverished vocabulary (compared to healthy controls with similar levels of education) was not part of their pre-illness status. If one supposes that lack of related vocabulary is a marker of inability to name emotions (and, thus, to attribute the mental state of another), making further adjustments of RMET-CV-R scores for vocabulary level could result in over-control, obscuring real differences in social cognition between groups.
Another intriguing finding is the role of education and age. As shown in Tables 3 and 5, in the full sample, education and age are significantly associated with successful completion of RMET-CV-R and RMET-CV-R scores; however, the pattern changes when considering the subsamples. Age and level of education were more closely associated with successful completion and RMET-CV-R scores in the interviewer-completed and undereducated-older subsamples than in the self-completed and educated-younger subsamples. This suggests that among subjects typically included in previous studies (i.e. respondents <60 years of age with ⩾5 years of schooling who can self-complete the instrument), older age and lower levels of education have a relatively little independent effect on the rates of successful completion and RMET-CV-R scores. However, when considering older, less-educated respondents and those unable to self-complete the instrument, increasing age and lower levels of schooling are independently associated with greater deficits in cognitive functioning (i.e. lower rates of successful completion and lower RMET-CV-R scores) even after adjusting for group (UT, TC, and HC) and other covariates (Staekenborg et al., Reference Staekenborg, Kelly, Schuur, Koster, Scherder, Tielkes and Claus2020).
Limitations
There are several potential limitations. (1) We have not yet assessed the test-retest reliability or other psychometric characteristics of RMET-CV-R. (2) The enrolled UT and TC may not be representative of UT and TC in other locations. (3) Our relatively large sample made it feasible to adjust results for intergroup differences in demographic and clinical characteristics, but there may still be unassessed differences between the groups. (4) This is a cross-sectional study so no definitive causal conclusions can be made about the factors associated with successful completion of RMET-CV-R or RMET-CV-R scores in the multivariate analyses.
Conclusion
Social cognition is an important target for therapeutic interventions such as social skills training and cognitive remediation. Assessing these interventions' effectiveness requires instruments that can validly assess social cognition in all patients with schizophrenia, particularly less-educated, older patients who tend to have more severe deficits in social cognition. Despite the limitations of the current study, we conclude that with appropriate changes in the method of test administration and careful assessment of respondents' understanding and ability to complete the task required, it is possible to administer RMET to many individuals with schizophrenia who were previously considered ineligible. This revised method of administering and evaluating RMET can potentially be used to assess the effectiveness of cognitive remediation interventions among less-educated, older patients.
This result has important implications for all research about schizophrenia. Given the increasing proportion of individuals with schizophrenia in high-income countries who are older (approaching the age where the onset of dementia needs to be considered) and the large proportion of individuals with schizophrenia in LMIC with low levels of education, it is no longer appropriate to automatically exclude them from research studies about schizophrenia due to their age or level of education. The symptomatology, course, and treatment responsiveness of older, undereducated patients – particularly those from rural communities – may differ from those of younger, educated patients (Yang et al., Reference Yang, Ruiz, Mandavia, Grivel, Wong, Phillips and Stone2020). To ensure that the needs of these marginalized patients are addressed, researchers need to make the added effort to include them in their studies. A critical part of this effort is to adapt assessment instruments to make them suitable for use with undereducated, older patients. We believe that this study represents an important step toward this goal.
Supplementary material
The supplementary material for this article can be found at https://doi.org/10.1017/S003329172100043X.
Acknowledgements
The authors thank the psychiatric clinicians who assessed and verified the DSM-IV diagnoses using SCID-IV for this study, including Dr Jizu Wei and Dr Guoqiang Lü from Ningxia Guyuan City Yuanzhou District Psychiatric Rehabilitation Hospital; Dr Xingbin Duan, Dr Yanhua Chen, Dr Yujian Wu, and Dr Lijuan Xi from Ningxia Minkang Hospital; Dr Weiguo Xu, Dr Xuelan Liu, Dr Huanqiu Wang from Ningxia Ningan Hospital; and Dr Zhaokui Yang from Guangxi Brain Hospital. We thank staff members at the local Centers of Disease Control and other health workers around Ningxia and Guangxi who helped coordinate the fieldwork. We thank the patients, patients' guardians, and healthy control subjects who agreed to participate in the study. Finally, we gratefully acknowledge Dr Sarah Morris at the National Institutes of Mental Health for her support. The two senior authors for the paper, Dr Yang (New York University and Columbia University) and Dr Phillips (Shanghai Mental Health Center and Columbia University), had full access to all the data in the study and take responsibility for the integrity of the data and the accuracy of the data analysis.
Financial support
This study was supported by the National Institute of Mental Health grant MH108385 R01 (PI's: Yang, Phillips, Keshavan) for the project ‘Characterizing Cognition Across the Lifespan in Untreated Psychosis in China’. The NIMH had no other role in the design and conduct of the study; collection, management, analysis, and interpretation of the data; preparation, review, or approval of the manuscript; and decision to submit the manuscript for publication.
Conflict of interest
None.
Ethical standards
This study was approved by the institutional review boards of the Shanghai Mental Health Center (FWA 00003065, IOGA 0002202) and New York University (IRB-FY2016-1157). All participants provided written informed consent; in the two patient groups, guardians also signed written informed consent forms.