

Underrepresentation of women in national legislatures has been at the forefront of gender studies. Socioeconomic factors have been proposed to account for this phenomenon, including a country's political culture (Inglehart and Norris Reference Inglehart and Norris2003) and women's labor force participation (Matland Reference Matland1998; Rosenbluth, Salmond, and Thies Reference Rosenbluth, Salmond and Thies2006). Researchers have also investigated institutional factors; for instance, it is widely accepted that proportionality in an electoral system is positively associated with women's representation (Fréchette, Maniquet, and Morelli Reference Fréchette, Maniquet and Morelli2008; Kittilson Reference Kittilson2006; Matland Reference Matland1993, Reference Matland1998; Norris Reference Norris2004; Roberts, Seawright, and Cyr Reference Roberts, Seawright and Cyr2012; Salmond Reference Salmond2006). In electoral systems with higher proportionality, party gatekeepers are more willing to nominate women because internal party competition is lower, while at the same time, cross-party competition for the support of different social groups is higher (Kittilson Reference Kittilson2006; Krook Reference Krook2009; Matland and Studlar Reference Matland and Studlar1996).
In addition, when comparing different types of proportional representation (PR) systems, researchers have generally concluded that party-centered closed-list PR systems favor women more so than candidate-centered systems, including open-list PR systems (Krook Reference Krook2009; Lühiste Reference Lühiste2015; Thames and Williams Reference Thames and Williams2010; Valdini Reference Valdini2013). While closed-list systems may reinforce internal party discipline, open-list systems encourage internal competition, which, in turn, increases the importance of name recognition and endangers traditional interests (Górecki and Kukołowicz Reference Górecki and Kukołowicz2014; Schmidt Reference Schmidt2008). For voters, open lists provide an opportunity to discriminate against certain candidates. A candidate's gender might serve as a cue that nudges voters to re-order party ballots in a way that discriminates against female candidates (McElroy and Marsh Reference McElroy and Marsh2010; Thames and Williams Reference Thames and Williams2010).
A recent stream of research suggests that a candidate's success can serve as a signal to parties’ about the popularity and electability of that candidate. Scholars have shown that in PR systems with some modification of preferential voting, the odds of future electoral success and political promotion are improved by personal performance. For example, Crisp et al. (Reference Crisp, Olivella, Malecki and Sher2013) and André et al. (Reference André, Depauw, Shugart and Chytilek2017) conclude that parties reward preference-vote-earning candidates with better preelection list positions in the future. Similarly, Folke, Persson, and Rickne (Reference Folke, Persson and Rickne2016) and Meriläinen and Tukiainen (Reference Meriläinen and Tukiainen2018) demonstrate that the distribution of votes within party lists guides internal party decisions on political promotions and appointments. In this context, the effect of gender bias stretches beyond its election-specific impact on descriptive representation.
The question then becomes, given the opportunity, do voters actually discriminate against female candidates at the ballot box? Large-N studies—those employing election data to investigate gender bias in Western democracies that use some variant of the open-list PR system—have come to conflicting conclusions (McElroy and Marsh Reference McElroy and Marsh2010; Roberts, Seawright, and Cyr Reference Roberts, Seawright and Cyr2012; Rosen Reference Rosen2011; Schwindt-Bayer, Malecki, and Crisp Reference Schwindt-Bayer, Malecki and Crisp2010; Valdini Reference Valdini2013; Wauters, Weekers, and Maddens Reference Wauters, Weekers and Maddens2010). The most systematic multicounty studies suggest that the effects of electoral laws are conditioned by national context and time (Roberts, Seawright, and Cyr Reference Roberts, Seawright and Cyr2012), voter's attitudes toward women as political leaders (Valdini Reference Valdini2013), and levels of socioeconomic development (Rosen Reference Rosen2011).
In this context, postcommunist states make for interesting cases because they share a similar historical experience and are at a comparable stage of development. When discussing the issue of women in politics in Central and Eastern European (CEE) countries, scholars often point to a “striking” feature of postcommunist parliaments immediately after independence: there was a rapid decline in the number of women deputies (Chiva Reference Chiva2005, Reference Chiva2017; Millard Reference Millard2004; Wilcox, Stark, and Thomas Reference Wilcox, Stark, Thomas, Matland and Montgomery2003). Others, however, have argued that this should not be particularly surprising given that female representation in the Soviet Union was typically a “Potemkin village”—that is, a sham that only thinly disguised a patriarchal political culture in which men held prestigious political positions and determined political life (Krupavičius and Matonytė Reference Krupavičius, Matonytė, Matland and Montgomery2003; Matonytė and Mejerė Reference Matonytė and Mejerė2011; Nechemias Reference Nechemias2008).
In this article, I analyze three parliamentary elections (2008, 2012, 2016) to shed light on (1) whether Lithuanian voters, on average, discriminate against female candidates; (2) whether gender has a different effect depending on a candidate's viability on the party list; and (3) whether the average level of discrimination depends on the political party that a candidate represents. I use the most direct way to evaluate voter preferences and possible bias: the number of preferential votes given to each candidate in the party lists.
This article contributes to the growing literature on gender bias in CEE countries that use open-list PR systems. Some form of preference voting is currently used in around 25 countries; several of them belong to the bloc of CEE countries. Thus far, the most extensive analyses have been conducted on Latvia (Matland and Lilliefeldt Reference Matland, Lilliefeldt, Escobar-Lemmon and Taylor-Robinson2014), Estonia (Allik Reference Allik2015), Poland (Górecki and Kukołowicz Reference Górecki and Kukołowicz2014; Kunovich Reference Kunovich2012; Marcinkiewicz and Stegmaier Reference Marcinkiewicz and Stegmaier2015), and the Czech Republic (Marcinkiewicz and Stegmaier Reference Marcinkiewicz and Stegmaier2015; Millard Reference Millard2004; Stegmaier, Tosun, and Vlachova Reference Stegmaier, Tosun and Vlachova2014). There has not yet been any systematic attempt to analyze voter bias against female candidates using candidate-level data in Lithuania.
The most important contribution comes from the systemic analysis of the effects of gender bias on a candidate's viability on the party list. Considering this understudied aspect broadens our knowledge about both the behavior of the electorate and its consequences for the descriptive representation of women candidates. It also allows the size of bias to be isolated where it matters most: if discriminatory inclinations against female candidates overcome party cues—a candidate's rank on the list—then women candidates who are well placed to enter parliament are at higher risk of being replaced by male politicians after the vote. Gender bias can also affect the long-term political career prospects of female candidates (André et al. Reference André, Depauw, Shugart and Chytilek2017; Crisp et al. Reference Crisp, Olivella, Malecki and Sher2013; Folke, Persson, and Rickne Reference Folke, Persson and Rickne2016; Meriläinen and Tukiainen Reference Meriläinen and Tukiainen2018).
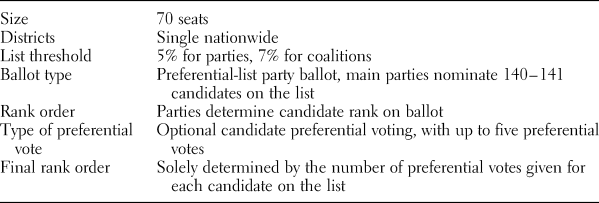
Since Lithuanian parliamentary elections are held under a mixed electoral system, attention is focused on the PR tier, which has a single nationwide constituency, and optional candidate preferential voting. This electoral system allows, but does not require, each voter to give up to five preferential votes to candidates on the party list. Parties determine the original positions on the list, but who ultimately gets elected depends solely on the number of preferential votes that each candidate receives. This type of system is similar to the PR systems used in the Czech Republic and Slovakia.
I first establish that, with a few exceptions—primarily Social Democrats, who are predicted to positively discriminate in favor of women candidates when compiling the party list—there is no strong evidence of elite bias in favor of or against women candidates in Lithuania. The following analysis provides empirical evidence that Lithuanian voters tend to discriminate on the basis of gender. Controlling for other factors, on average, female politicians can expect to receive around 7 percentage points fewer preferential votes than their male counterparts. Furthermore, the analysis advances our understanding of the conditionality of discriminatory behavior: the models predict that the gender gap in votes for candidates widens as the prestige of their position on the list increases. Gender bias against female candidates is most pronounced when they are well placed to enter parliament. This tendency has a conspicuous effect: women who are originally placed in safe seats on party lists are more likely to be ranked lower and replaced by male candidates.
Finally, a disaggregation of gender effects by party demonstrates that, in contrast to the norm in Western Europe, Social Democratic voters are particularly inclined to discriminate against female candidates, while conservative voters tend to prefer female candidates. I suggest that elite bias “correction” is the most likely explanation for the gender gap among Social Democratic voters. As a result of gender quotas, Social Democrats tend to nominate women candidates who are relatively less experienced than their male counterparts to PR lists; despite party ques (viability on the list), voters award these female candidates fewer preferential votes.
WOMEN IN POLITICS: LITHUANIA IN THE CENTRAL AND EASTERN EUROPEAN CONTEXT
While women were traditionally more prevalent in communist legislatures than in Western European countries, this trend was reversed after the dissolution of the Soviet Union. In the young democracies of CEE, women's representation, as well as attitudes toward women's political leadership and socioeconomic roles in general, stood in stark contrast to more egalitarian Western societies (Wilcox, Stark, and Thomas Reference Wilcox, Stark, Thomas, Matland and Montgomery2003). Despite the increasing gender gap, political elites in CEE countries were reluctant to act because policies to ensure better representation of women were seen to be too similar to those of the previous communist regime, and therefore they were deemed politically unpalatable (Allik Reference Allik2015; Chiva Reference Chiva2017).
In line with this general trend in CEE countries, Lithuania's early attempts to encourage gender equality—for example, by introducing gender quotas—were greeted with suspicion and associated with Soviet policies (Krupavičius and Matonytė Reference Krupavičius, Matonytė, Matland and Montgomery2003; Matonytė and Mejerė Reference Matonytė and Mejerė2011). At the same time, most women's movements formed during a later period of macroeconomic stabilization (between 1994 and 1997) and had little political influence (Krupavičius and Matonytė Reference Krupavičius, Matonytė, Matland and Montgomery2003). It is not surprising, then, that only the Lithuanian Social Democratic Party (LSDP), whose core was originally formed of former cadres of the Communist Party, introduced a party gender quota in 1996. Even now, although negative attitudes toward more equal gender representation is waning (Matonytė and Mejerė Reference Matonytė and Mejerė2011), no other party has passed any formal regulation on female representation.
Another characteristic of newly independent Lithuania, as in other CEE countries, was a strong association of women with private roles and unpaid labor. As demonstrated by Wilcox, Stark, and Thomas (Reference Wilcox, Stark, Thomas, Matland and Montgomery2003), the salience of this tendency decreased over the following decade. That certainly does not mean, however, that there is no room for improvement: in 2015, Lithuania scored 56.8 on the European Union's Gender Equality Index (EIGE 2018), which combines several groups of economic, social, and political indicators (the EU average was 66.2). Notably, it appears that during the last decade there was no progress in Lithuania's gender relations: in 2005, its Gender Equality Index score was 55.8; in 2010, 54.9; and in 2012, 54.2.
Concerning women's representation specifically, after Lithuania became independent, the proportion of women in parliament dropped dramatically: in 1992—the first election held under the current electoral system—only 10 female candidates (7% of all parliamentarians) were elected. After 2004, the proportion of women politicians stabilized at just over 20%, very much in line with representation in most countries of the CEE region but well below the EU average, which currently stands at around 30% (EIGE 2018). In short, the Lithuanian parliament firmly remains a male-dominated institution (Matonytė Reference Matonytė and Galligan2015).Footnote 1
GENDER BIAS IN CENTRAL AND EASTERN EUROPE
While no in-depth studies on voter bias against female candidates in Lithuania have been conducted using candidate-level data, a handful of important articles have investigated this phenomenon in other postcommunist countries that use open-list PR systems. In Latvia, the effect of preferential voting on women's representation is largely negative, although the size of the effect varies across political parties (Matland and Lilliefeldt Reference Matland, Lilliefeldt, Escobar-Lemmon and Taylor-Robinson2014). In Estonia, unknown and nonincumbent women candidates fare significantly worse than comparable men, while among competitive candidates, women do not appear to receive fewer votes (Allik Reference Allik2015).
Górecki and Kukołowicz (Reference Górecki and Kukołowicz2014) reach a similar conclusion regarding gender bias in Poland. Pre-quota elections in 2007 were compared with the first election after a gender quota was introduced in 2011; the researchers found that more female candidates participated in the latter election, but the gender gap nevertheless increased. This phenomenon is attributable to the fact that as more women—including candidates who are considered to be “weak” because of their lack of political experience—were contesting in elections, a relatively small group of voters distributed their votes among more female candidates. Other studies on Poland have come to different conclusions: Marcinkiewicz and Stegmaier (Reference Marcinkiewicz and Stegmaier2015) conclude that there is an overall negative bias toward women candidates, while Kunovich (Reference Kunovich2012) concludes that in pre-quota elections (2001, 2005 and 2007), voters shifted women's original list placements positively.
The Czech Republic has been thoroughly researched and is particularly interesting in comparison with Lithuania. Despite a few differences, the Czech Republic's open-list PR system is very similar to the PR tier of Lithuania's mixed electoral system.Footnote 2 The electoral system of the Czech Republic appears to favor women candidates (Marcinkiewicz and Stegmaier Reference Marcinkiewicz and Stegmaier2015, Millard Reference Millard2004, Stegmaier et al. Reference Stegmaier, Tosun and Vlachova2014). One notable exception that somewhat contradicts the findings of Allik (Reference Allik2015), who argues that Estonian voters do not discriminate among competitive candidates, is that women occupying the first position on the ballot attracted fewer votes than equally viable male candidates (Marcinkiewicz and Stegmaier Reference Marcinkiewicz and Stegmaier2015). Finally, Millard (Reference Meriläinen and Tukiainen2004) concludes that in Slovakia—which has a similar electoral system to both the Czech Republic and Lithuania—preferential voting made little difference to the descriptive representation of women (Millard Reference Meriläinen and Tukiainen2004).
Overall, then, several studies have examined voter bias against female candidates in new CEE democracies, yet in sum, the findings are somewhat discordant. Using individual-level data from three Lithuanian legislative elections (2008, 2012, 2016), this article makes a contribution to the literature by investigating voter bias in an open-list PR system, in which parties rank candidates but voters are able to fully influence the rank order through preferential voting. Moreover, the article explores whether variation in voter bias is associated with the viability of the candidate and his or her party affiliation.
RESEARCH QUESTIONS
Lithuania introduced its current mixed electoral system in 1992. Table 1 depicts the current PR-tier election procedure. Based on existing rules, 70 out of 141 members of the Lithuanian parliament (the Seimas) are elected in one multimember nationwide district with optional preference voting.Footnote 3 Voting in the Lithuanian PR tier is a two-step process. First, the number of votes given to the party list determines whether the party gets into parliament (there is a 5% election threshold for parties and a 7% threshold for coalitions), and if it does, how many seats it holds. Second, the number of preferential votes given to each candidate on the party list determines who gets a legislative seat. Voters have the ability—but are not obligated—to cast up to five preferential votes to individual candidates from the party list that they vote for. That is, each voter can give at most five preference votes to five candidates from the same party. Each candidate, then, can receive only one preference vote from a single voter, and each preferential vote is of equal weight. Regardless of a candidate's initial position on the party list—a ranking that is determined by the party leadership—the candidate who receives the most preferential votes ends up at the top of his or her party list after the election.Footnote 4
Lithuanian PR tier

The Lithuanian PR tier electoral system is very similar to the systems in the Czech Republic and Slovakia. Crucially, the Lithuanian system permits voters to discriminate against candidates based on their gender, effectively allowing voters to express a bias-based preference for male candidates over females. As previously discussed, debates over whether, given the opportunity, voters discriminate against female candidates in Western and CEE democracies are still ongoing. The case of Lithuania makes an important contribution to this debate.
Accordingly, the first research questions is, on average, do Lithuanian voters discriminate against female candidates?
Open-list PR systems are interesting not only because they provide opportunities to re-order the party lists but also because they place “extraordinary information demands” on voters, who are given the opportunity to single out particular candidates that they prefer (Matland and Lilliefeldt Reference Matland, Lilliefeldt, Escobar-Lemmon and Taylor-Robinson2014; Marcinkiewicz and Stegmaier Reference Marcinkiewicz and Stegmaier2015). On the other hand, the party leadership determines the specific order of candidates on the list, which sends a signal about each candidate's quality (Ceyhan Reference Ceyhan2018; Gherghina and Chiru Reference Gherghina and Chiru2010) and the party's preferences. These cues may be particularly important in many CEE countries, including Lithuania, where there is a low level of public familiarity with candidates because of the fluidity of their political systems (Marcinkiewicz and Stegmaier Reference Marcinkiewicz and Stegmaier2015).
Another such cue may be the gender of candidates. On the one hand, party cues may override gender cues if voters are solely or even primarily swayed by the party's ranking of candidates. On the other hand, if voters do significantly discriminate on the basis of gender, we would expect to see that female candidates who are higher on the list, and who therefore have been favored by their party and are better placed to reach parliament, are ranked lower by gender-biased voters who prevent female candidates from reaching parliament. To test this, the second research question is postulated as follows: do voters discriminate equally against all female candidates, or does discrimination vary by the candidate's party-determined viability?
Finally, a number of studies, including those looking at CEE countries (Kunovich Reference Kunovich2012; Marcinkiewicz and Stegmaier Reference Marcinkiewicz and Stegmaier2015; Matland and Lilliefeldt Reference Matland, Lilliefeldt, Escobar-Lemmon and Taylor-Robinson2014), have noticed that the effects of gender bias may vary according to the party a candidate belongs to. In Western democracies that have strong left-wing parties, women's representation in parliaments tends to be higher (Kittilson Reference Kittilson2006; Lühiste Reference Lühiste2015; Rosenbluth, Salmond, and Thies Reference Rosenbluth, Salmond and Thies2006; Schmidt Reference Schmidt2008). Much less is known about whether, in CEE countries, gender bias among voters differs according to where on the political spectrum the party for which they vote is positioned. Therefore, the final question addressed in this paper is: on average, does discrimination vary depending on the party that a candidate represents?
One unique feature of CEE politics is that many of the left-wing parties were formed by former communists (Millard Reference Millard2004). In Lithuania, the party system evolved from a sharp cleavage between former communist and anticommunist politicians (Ramonaitė Reference Ramonaitė2007, Reference Ramonaitė2013, Reference Ramonaitė and Ramonaitė2014). Since Lithuanian independence, most of its ruling coalitions have been led either by Social Democrats, whose core consisted of former communists, or by conservatives, many of whom had ties to the original independence movement. This sharp divide became entrenched into the left-right political spectrum and is still significant today. As in several other postcommunist countries, Lithuania's transitional experience, then, upsets the conventional definition of left and right parties (Tavits and Letki Reference Tavits and Letki2009). Special attention will be paid to Lithuania's leading political forces: the LSDP and the Homeland Union (conservatives).
To analyze voting patterns, I first run models to establish whether there is a negative or positive discrimination toward female candidates on the supply side. If party elites positively discriminate toward women candidates by listing them in relatively high list positions, despite their lack of experience, then a lower ability to collect preferential votes by female candidates can be seen more as a “correction” by voters than as discrimination.
RESEARCH DESIGN
This study uses candidate-level data from three Lithuanian parliamentary elections: 2008, 2012, and 2016. The selection of 2008 as the starting point is based on changes to the electoral system that took place before that year. According to Schmidt's (2008) classification scheme, before 2008, Lithuania had a mixed electoral system with a flexible-list PR tier. Elections determined the final ranking of party members by combining two factors: the number of preferential votes received and the party rating for each candidate. In 2008 this system was simplified by making preferential votes the single determinant. After 2008, then, the Lithuanian electoral system can be considered a mixed system with an open-list PR tier.
Candidate-level data were obtained from the website of the Central Electoral Commission of the Republic of Lithuanian (CEC) and from the CEC's “voter's webpage.” To address the question of voter bias, I use negative binomial regression, which is suited to modeling overdispersed count data. Using election-year controls permits potentially influential unobserved effects to be taken into account—that is, effects that influence the number of preferential votes received—across elections. Party controls have also been added to account for unobserved party-specific effects. The average number of preferential votes per voter varies across parties and across elections (variation is depicted in Table A1 in the appendix in the supplementary material for this article), creating the need to take into account these differences. To demonstrate the robustness of the results, I report the results of multilevel negative binomial models with party-level random intercepts in the appendix (Table A3). The results are mostly identical. (The author's data set and STATA code are available in the supplementary material.)
The key dependent variable is the number of preferential votes given to each candidate. This measurement is the best way to assess the biases of the electorate, as it concerns direct action of the voter in the election environment. Unsurprisingly, the candidate-level data used in this study are highly skewed to the right. The key explanatory variable is the gender of the candidate; the value of 1 is assigned to female candidates and 0 to males.
The study also controls for other important predictors of election success. To begin with, I include a set of variables that account for candidate experience. Incumbency is a dummy variable that takes the value of 1 if a candidate served in the previous parliament. Previous tenures in parliament is a continuous variable that counts the number of times a candidate was previously elected; it does not include preelection incumbency so as not to overlap with the incumbency variable. Incumbent minister takes value of 1 if a candidate served as a minister in the previous government. Previous tenures as minister is a continuous variable that counts the number of times a candidate previously served as a minister; it does not include preelection incumbency so as not to overlap with the incumbent minister variable.
In addition, the study controls for a candidate's rank on the list. It is a continuous variable that shows a candidate's rank on the list before the election (to simplify, the interpretation values of the variable are reversed). This is a powerful variable that makes this study well controlled. A number of studies have demonstrated that the viability of a listed candidate is largely determined by the candidate's political background, including incumbency status, number of prior candidacies, district nominations, and so on (Ceyhan Reference Ceyhan2018; Gherghina and Chiru Reference Gherghina and Chiru2010; Górecki and Kukołowicz Reference Górecki and Kukołowicz2014; Kunovich Reference Kunovich2003; Shugart, Valdini, and Suominen Reference Shugart, Valdini and Suominen2005). Therefore, the rank on the list variable further improves control for the political biographies of candidates.
Finally, single constituency is used to take into account spillover effects between electoral tiers when a candidate is double listed. The variable takes the value of 0 if the candidate was only nominated on the list and 1 if he or she also ran in a single district. Past research has demonstrated the existence of contamination effects between electoral tiers (Ferrara and Herron Reference Ferrara and Herron2005; Ferrara, Herron, and Nishikawa Reference Ferrara, Herron and Nishikawa2005; Herron and Nishikawa Reference Herron and Nishikawa2001). In this case, running on both—list and single-member district (SMD)—can be expected to increase the number of preferential votes a candidate receives. Running in an SMD tier also results in additional resources being allocated to that candidates (CEC 2016). Most importantly, these candidates run campaigns and are more visible in their regions, and therefore they often have a distinct advantage over their opponents. Double-listed candidates have constituents who may vote for them in both the SMD tier and give a preferential vote in the PR tier (Ragauskas and Thames Reference Ragauskas and Thames2019).
SUPPLY OF FEMALE CANDIDATES
To start, it is worth looking at the supply of female candidates. This is especially relevant keeping in mind recent literature, which demonstrates interactive patterns between nomination strategies and voting behavior (Gendźwiłł and Żółtak Reference Gendźwiłł and Żółtak2019; Kjaer and Krook Reference Kjaer and Krook2019). While a key focus of this article is voting behavior, we first need to establish whether there is elite bias in nominating women candidates. For example, if party elites favor women candidates by listing them in relatively high list positions despite their lack of experience, then the lower ability to collect preferential votes by female candidates can be seen more as a correction by electorate than as gender bias. Assuming that voters reward merit and that female politicians lack experience, voters reward women candidates with fewer preferential votes because they lack “political capital.”
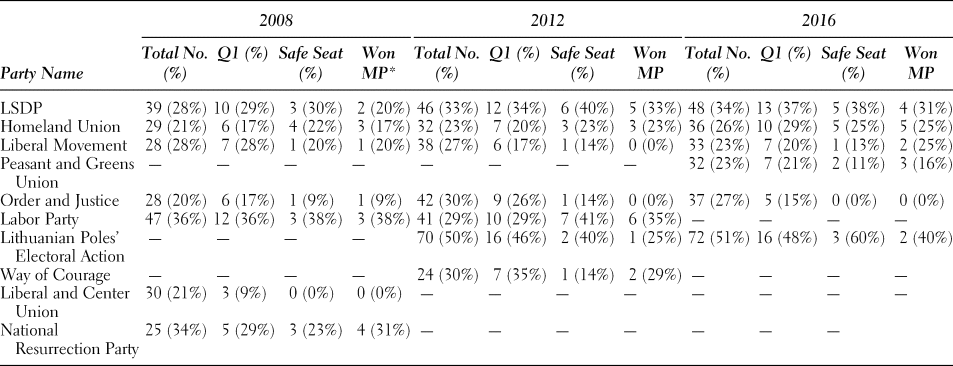
Table 2 includes only information about the parties that crossed the PR tier election threshold (5%) in a given election. The descriptive statistics in Table 2 show that, with the exception of the minority party Lithuanian Poles’ Electoral Action, none of the other parties balanced their party lists. On the other hand, overall, an increasing number of nominated women can be observed in the last three elections. In Table 2, the “Q1” column shows the number of women listed in the first quartile of the party list, and “safe seat” denotes the position that would guarantee the seat, based on the original listing if it were not the case that preferential votes could change it.Footnote 5 While in general, the LSDP nominates more women than the Homeland Union, for both parties, the proportions of listed men and women remain relatively similar as the prestige of their position on the list increases. For example, in 2016, 34% of all LSDP candidates on the list were women, and 37% of all candidates listed in the first quartile of the list were also women. For the Homeland Union, 26% of the party list consisted of women candidates, and 25% of all candidates listed on the first quartile of the list were also women.
Women nominated to party lists

Notes: Data in parentheses show the percentage of women among all candidates. The length of the lists can vary by party and elections year. Only data for parties that passed the electoral threshold in a given election is provided. In the Lithuanian mixed electoral system, almost all candidates who run in SMDs are also nominated in the party lists. By law, if a candidate is elected in both tiers, he or she takes the SMD seat. In this table, “Win MP” denotes only those candidates who entered parliament based on the number of preferential votes. For example, in 2008, the LSDP won 10 seats in parliament in the PR tier; out of the 10 top-ranked candidates, two were women. However, because some of top candidates also won single constituencies, two more women were elected to parliament. However, I report only the original ranking based on list placement after ranking.
Out of the four parties that crossed the election threshold during all three elections in the sample, two liberal parties and the populist Order and Justice Party tend to rank proportionally more women lower on the list, reducing their chances of being elected. Interestingly, the same tendency is observed for the Peasant and Greens Union, which won the 2016 election. Commonly, green parties and their voters are expected to have more favorable attitudes toward women (Holli and Wass Reference Holli and Wass2010). However, Lithuania's Peasant and Greens Union cannot be classified as a conventional “green” party; rather, it is more of a catchall party with an all-encompassing program.
In addition, the final column in Table 2 shows how many women candidates in the open-list PR tier entered parliament based on the original ranking of the list. In some instances, women candidates were replaced by male candidates because of preferential voting. This was the case for the LSDP in all three elections, when fewer women, compared with those listed in the safe seats, were originally elected. The same observation can be made for the Homeland Union in 2008, the Liberal Movement and Order and Justice in 2012, the Labor Party in 2012, and the Lithuanian Poles in 2012 and 2016. The opposite tendency, when more women than were originally placed in the safe seats on the list received enough preferential votes to enter parliament, is observed three times: in 2016 for the Liberal Movement and the Peasant and Greens Union and in 2008 for the National Resurrection Party. Table A2 in the appendix provides more detailed information about voters’ tendency to re-order the party lists. It offers the same conclusion: while voters re-order the party lists by ranking both male and female candidates out of their safe seats, women are much more often replaced by male candidates.
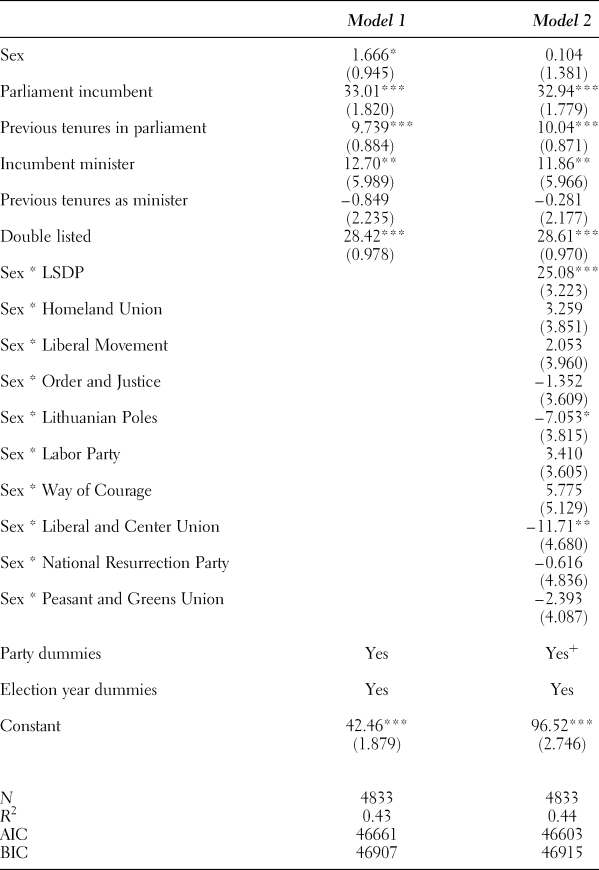
Table 3 provides a formal test to assess nomination patterns. It should provide a better understanding of the role that candidate gender plays in list placement. I use ordinary least squares models in which I regress the political experience variables and the variables sex and double listed on rank on the list (reversed) to assess whether a candidate's gender plays a role in the compilation of the party lists. To control for unobserved confounders, I also include dichotomous variables for parties and election years. Finally, I run a number of interactions between sex and electoral parties to distill party-specific effects.
Impact on the rank on the list reversed (robust standard errors)
Dependent variable: Number of preferential votes

*** p < .01; ** p < .05; * p < .1.
+ The base coefficients of party variables for Model 2 are also included in this category.
Model 1 demonstrates that gender has a positive and somewhat significant (p < .1) effect on list placement. However, the substantive effect is relatively small, as it is predicted that being female increases list placement, on average, by 1.67 positions. Furthermore, these results are driven by the LSDP, which is the only party that has a quota for women candidates.Footnote 6 Model 2 shows that, controlling for other factors, being female is predicted to give a 25-position list placement premium to female LSDP candidates. Meanwhile, the Lithuanian Poles and the Liberal and Center Union are the only two parties that tend to discriminate against women in their list placements. For other parties, gender is not a significant factor when it comes to nominating candidates.
Overall, with the exception of the aforementioned cases, parties appear to rank their candidates mostly based on merit. As expected, factors such as incumbency and previous political experience (with the exception of previous tenures as minister) have large positive effects on list placement. Interestingly, there is also a correlation between list placement and running in a SMD district (double listed): candidates who contest both tiers are predicted to be ranked around 28 positions higher than otherwise similar colleagues who contest only the PR tier.Footnote 7 In sum, in most cases, I do not observe elite bias in favor of or against female candidates when it comes to their placement on party lists. The LSDP, which has implemented a quota for women candidates, is a clear exception: there is a very strong positive bias toward women candidates in the list placements.
RESULTS
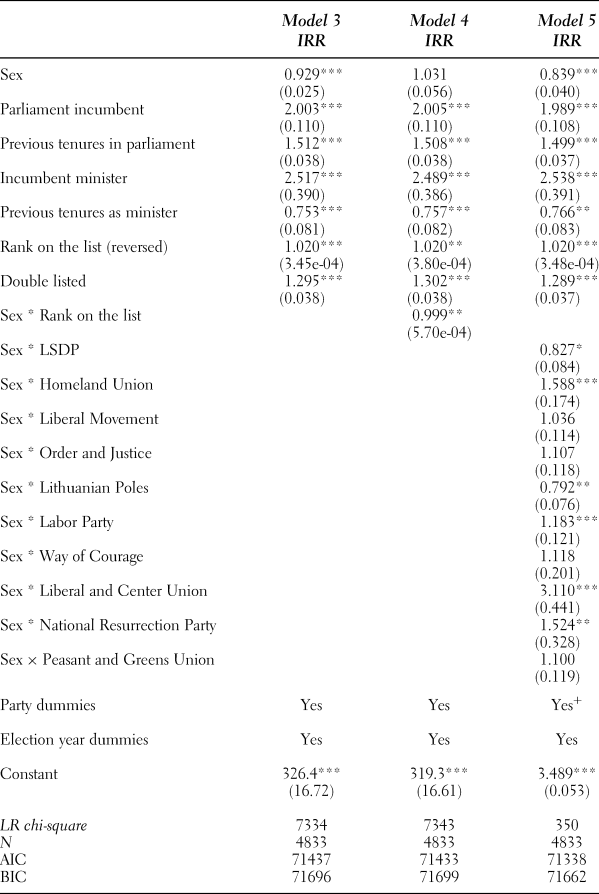
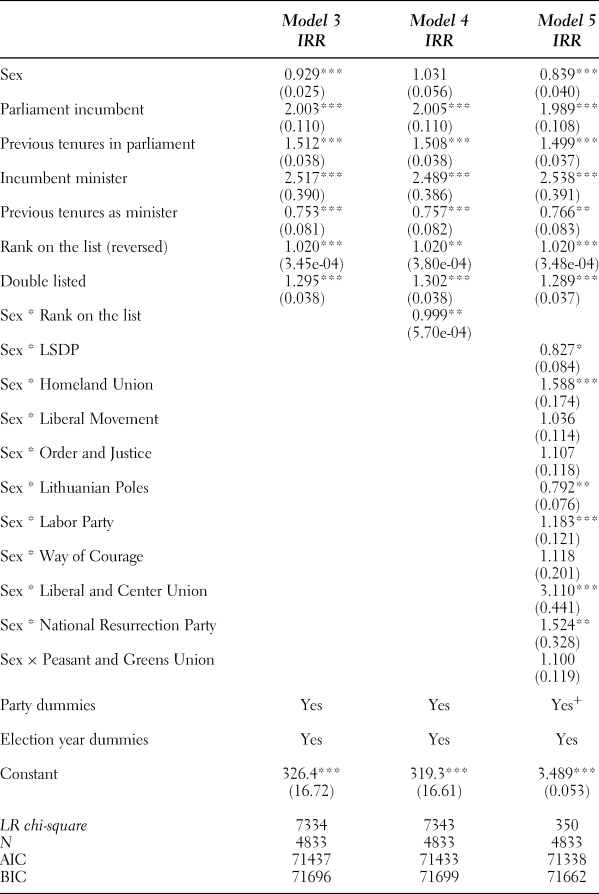
Table 4 presents the results of the main analysis. For convenience of interpretation, results obtained from negative binomial models are presented in the incidence rate ratios. The baseline model (Model 3) shows that, controlling for other factors, the incidence rate ratio is 7 percentage points lower for women candidates. This finding points out that, on average, Lithuanian voters tend to discriminate against female candidates. For the robustness check, Table A3 (Model 6) in the appendix provides an additional model, which shows that discriminatory tendencies are exercised by voters of electoral parties and by those who vote for more marginal subthreshold political groups.
Impact on the number of preferential votes
Dependent variable: Number of preferential votes
*** p < .01; ** p < .05; * p < .1.
+ The base coefficients of party variables for Model 3 are also included in this category.
The control variables deserve a few short remarks. In line with expectations, incumbency, previous tenures, and holding a ministerial portfolio before the election are all important factors that are expected to increase the preferential vote count by around 100 percentage points, 50 percentage points, and 150 percentage points, respectively. Double listing and list ranking also have large effects on the number of preferential votes. On average, double-listed candidates—those running on both the PR list and as candidates in a single constituency—are predicted to collect around 30 percentage points more preferential votes. Not surprisingly, one's viability on the list also gives a large advantage: each position adds around two percentage points more preference votes. For comparison purposes, most electoral parties have 140-141 candidates on their lists.
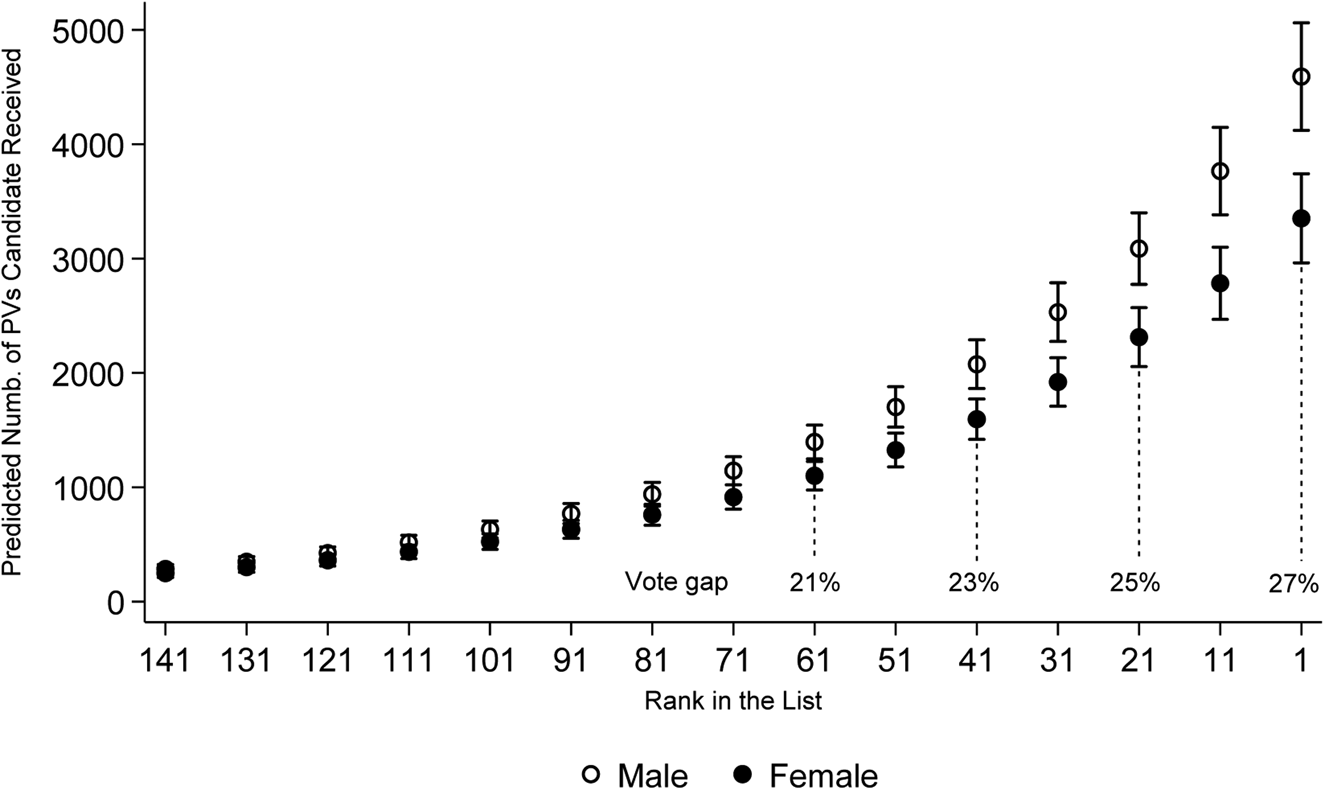
Model 4 answers the second question of this study: do voters discriminate against all female candidates equally, or does discrimination vary according to a female candidate's party-determined viability? The interaction coefficient between sex and rank on the list (reversed) is significant and relatively large. Figure 1 provides the predicted preferential vote count depending on the sex of the candidate and his or her viability on the list. The general trend shows that, keeping other factors constant, as the prestige of the position on the list increases, the vote share gap widens.Footnote 8 The difference between received preferential vote shares becomes significant only when a candidate's viability passes the midpoint of the list. However, for those female candidates who enter the top quartile of the list, the predicted difference in the preferential votes received by them and their male counterparts is close to 24 percentage points, and those women who are among the top 10 candidates on the list can be expected to collect around 26 percentage points fewer preference votes on average.
Predicted Preferential Votes Count Depending on Rank in the List

A few observations can be made about the tendency of the gender gap to increase as female candidates rise up the list. First, the fact that there are no statistically meaningful differences for the lowest-placed candidates is not surprising, since the bottom of the list hardly matters. In fact, during the three elections, only three candidates who were listed on the bottom half of the list made it to parliament in the PR tier.Footnote 9 In addition, the mean of the number of preferential votes that candidates in the bottom half of the list received was barely 355 on average. People rarely vote for these candidates, and if they do, their motivations are hard to predict as they can be based on personal sympathies or connections.
Second, the model predicts that discriminatory tendencies will be most salient at the highest levels of prestige. Interestingly, it shows that gender cues influence how voters follow party cues that are inherent in list placement. Overall, the observed tendency is worrisome: as shown in Table 2, in most cases, less than one-third of all candidates listed in first quartile of the lists are women. If we add discriminatory tendencies it becomes even harder for women to compete for political office. This illustrated by both Figure 1 and the already discussed descriptive statistics provided in Table 2 and in Table A2 in the appendix, which demonstrate that women candidates in safe seats tend to get ranked lower and male politicians take their positions in parliament.
Model 5 answers another question: how does voter bias vary across parties? In Model 5, the effect of sex is moderated by interacting it with 10 parties that crossed the election threshold at least one time during the three elections. The base coefficient of sex is significant, predicting a 16 percentage point gap for reference group observations (female candidates from parties that did not pass the election threshold). Significant interactions between sex and party variables shows that there is a difference in the gap between the reference group and the observations that belong to the party that moderates sex variable.
Generally, the effects vary by party: voters of the LSDP and Lithuanian Poles appear to be particularly inclined to discriminate against women candidates, although, interestingly, both parties surpass their rivals in the number of women candidates they nominate. For the LSDP, the average predicted gap is almost 30 percentage points, and for the Lithuanian Poles, it is around 33 percentage points. On the other hand, voters who support the Homeland Union (conservatives) appear to prefer women candidates. In fact, controlling for other factors, women running as Homeland Union candidates are predicted to receive almost 33 percentage points more preferential votes on average than their male counterparts. Several other parties—the Labor Party, Liberal and Center Union, and National Resurrection Party—are also predicted to have lower gender gaps compared with the reference group.
It is generally assumed and broadly observed that there is a positive association between left parties and women's representation (Kittilson Reference Kittilson2006; Lühiste Reference Lühiste2015; Salmond Reference Salmond2006; Schmidt Reference Schmidt2008). Lithuania, however, appears to be an exception. In fact, the predicted and frankly astonishing gap for the LSDP—as well as the Lithuanian PolesFootnote 10—is in line with the descriptive statistics provided in Table A1 in the appendix. It shows that throughout the three elections, the median number of votes was consistently lower for women candidates of these two parties. Similarly, the descriptive statistics also support the statistical analysis results when it comes to conservative candidates—in all three elections, the median number of preferential votes was higher for women candidates.
While further research is needed to explain the exact reasons for this phenomenon, a few explanations can be proposed. First, as demonstrated in Table 2, the LSDP and the Lithuanian Poles’ Electoral Action nominate the most women candidates. Following Górecki and Kukołowicz (Reference Górecki and Kukołowicz2014), it can be postulated that because these parties nominate more women, including weak candidates, voters split their votes among them and therefore the gap increases compared with parties that nominate fewer women, including conservatives. As I demonstrated in Table 3 for the LSDP—which has a gender quota—gender is a particularly important factor in compiling party lists: controlling for other factors, there is very strong positive bias (on average, 25 list positions) toward women candidates when making nomination decisions. On the other hand, the Lithuanian Poles’ Electoral Action is one of the parties in which a negative elite bias is present despite the fact that the party nominates the most women, and yet voters discriminate further.
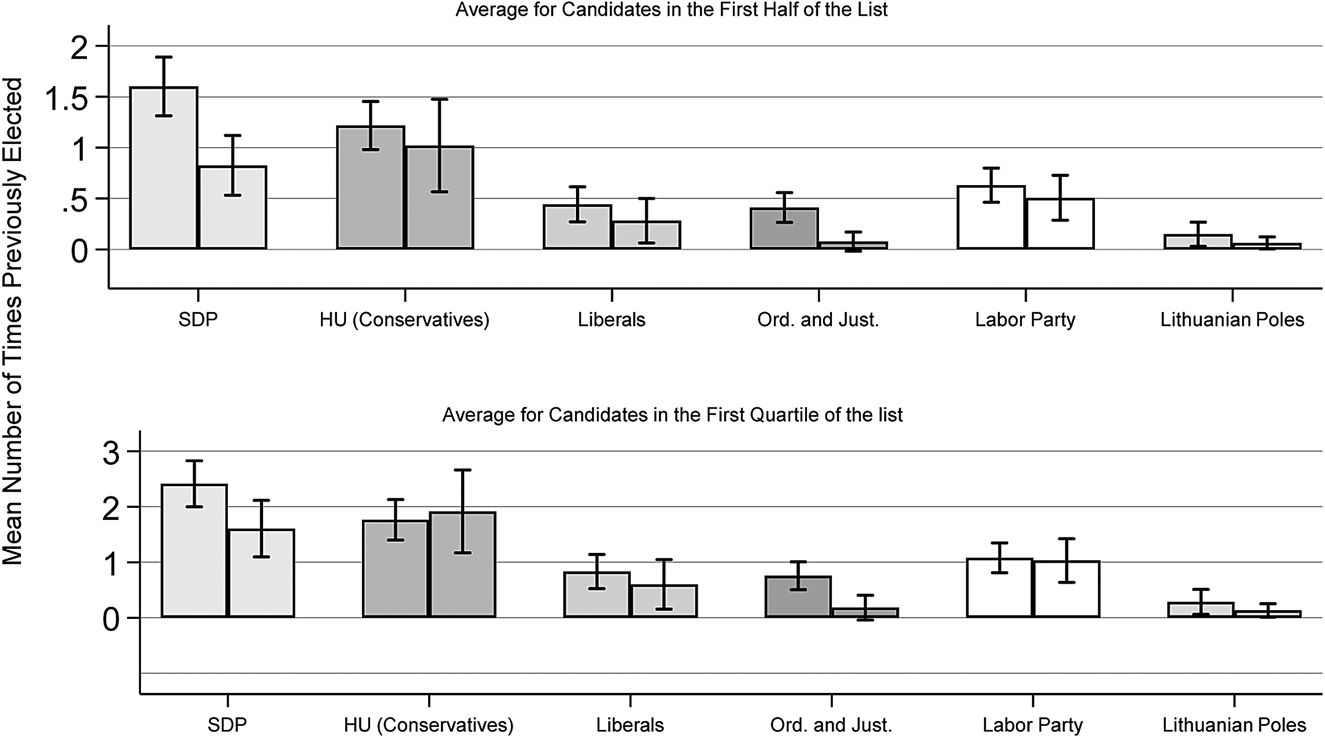
While the models reported in this article already control for political experience, it is worth taking a closer look at the differences in experience among the party candidates. I am particularly interested in the differences between the political heavyweights LSDP and Homeland Union. Figure 2 reports the experience of male and female (columns to the right) candidates by party. I only report results for six parties that crossed the electoral threshold two times in three analyzed elections. The upper bar plot illustrates interesting differences between the two historically most competitive parties. On average, male LSDP candidates listed on the first part of the list have twice the experience of female politicians.Footnote 11 On the other hand, there is no statistically meaningful difference in experience between conservative male and female candidates. It needs to be mentioned that both parties have a similarly long history of existence and nominate an equal number of candidates in their lists. However, as discussed, the LSDP nominates more women.
Mean Number of Times Candidate was Previously Elected to Parliament

The gap in high-level parliamentary experience—an important predictor of electoral odds—could provide an explanation for the vote gap among LSDP candidates: the party nominates more female candidates who are relatively weaker than their men counterparts.Footnote 12 However, the lower bar plot in Figure 2 shows that the average experience of LSDP candidates of different genders becomes statistically indistinguishable for candidates in first quartile of the list. And yet, as demonstrated in the descriptive statistics provided in Table A2 in the appendix, the LSDP electorate still discriminates against top women candidates. Figure 2 also does not explain why Homeland Union women are predicted to receive such a large premium of preferential votes if their relative experience is similar to their male colleagues and gender is not significant factor in nomination strategies (Table 3). Finally, the gender gap in the experience of LSDP candidates should not surprise us: if LSDP voters systemically award women candidates with fewer preferential votes, then of course they lack experience in parliament.
It has not escaped the notice of previous researchers that the Homeland Union has traditionally been quite supportive of putting female candidates forward. In fact, the Lithuanian conservative party was one of the first to include female politicians in the party leadership in as early as 1992 (Krupavičius and Matonytė Reference Krupavičius, Matonytė, Matland and Montgomery2003). In so doing, the party increased women's visibility in the political sphere and may have nudged voters to trust women candidates. In addition, Krupavičius and Matonytė (2003, 98) note that, ideologically, right-wing parties’ openness to women “was a formal sign of being democratic, different from the preceding regime, and a point that could be used in political campaigning.”
CONCLUSION
This article contributes to the academic literature on whether voters in open-list PR systems that allow voters to discriminate against candidates exercise gender bias. Furthermore, it provides insight into the ongoing academic debate about whether, given the opportunity, voters in relatively new CEE democracies discriminate against female candidates. The case of Lithuania was used to address these two themes, and data from three Lithuanian elections (2008, 2012, and 2016) were analyzed using the number of preferential votes given to each candidate as a dependent variable. The results paint a rather grim picture: with the exception of the LSDP, which positively discriminates in favor of women because of quotas, there is no strong evidence of elite bias in favor of or against the women. However, Lithuanian voters on average tend to discriminate on the basis of gender, and quite strongly at that. The effects are both statistically significant and substantively large. Controlling for other factors, on average, female politicians can be expected to receive around 7 percentage points fewer preferential votes than their male counterparts.
Importantly, the study also makes a comprehensive attempt to look at how party-defined viability interacts with the gender of candidates. The models predict that, on average, the gender gap increases with the position on the party's PR list, which serves as a signal to voters about the candidate's prestige. The biggest effects of gender bias are expected to be exercised against female candidates who occupy high positions on the list and therefore are well placed to enter parliament. This leads to women, more often than men, being voted out of “safe seats” and replaced by their male colleagues, thereby negatively affecting descriptive representation of women candidates. In other words, when it comes to women politicians, voters are less likely to follow party cues.
This tendency may have broader implications by insidiously shaping the supply of female candidates. It might nudge party gatekeepers to avoid listing females in the most prestigious positions, especially if the expectation of the party is for the list leaders to boost the popularity of the party as a whole (André et al. Reference André, Depauw, Shugart and Chytilek2017; Crisp et al. Reference Crisp, Olivella, Malecki and Sher2013). It may also deter the placement of women in party leadership positions or prestigious political appointments because of fears that their visibility will become a drag on the party's popularity (Folke, Persson, and Rickne Reference Folke, Persson and Rickne2016; Meriläinen and Tukiainen Reference Meriläinen and Tukiainen2018). All of this could also deter women from seeking office; previous studies have demonstrated that women are more election averse (Kanthak and Woon Reference Kanthak and Woon2015), and these additional obstacles could compound the problem.
Another interesting finding is that Lithuanian voters of the LSDP are particularly inclined to discriminate against female candidates. This finding can be explained to some extent by nomination patterns: because of gender quotas, there is a substantively large positive bias in listing women candidates relatively high on the party list, regardless of their experience. The electorate then corrects for elite bias by ranking women candidates lower (Gendźwiłł and Żółtak Reference Gendźwiłł and Żółtak2019; Górecki and Kukołowicz Reference Górecki and Kukołowicz2014; Kjaer and Krook Reference Kjaer and Krook2019).
In conclusion, this study provides evidence that the responsibility for inadequate representation of women does not rest with party elites. At the very least, as illustrated by Lithuania, voters tend to discriminate against women, and the gap in votes is predicted to increase along with a candidate's position on the party list. The average effects, on the other hand, vary by party. The Lithuanian case should be seen in the broader context of CEE countries, several of which use PR systems that allow their electorates to re-order the list. It calls for future cross-country research that could establish whether the specific findings for Lithuania can be observed in other contexts.