


I. INTRODUCTION
Radio frequency micro-electro-mechanical-systems (RF MEMS) technology has already emerged as an enabling technology for a new generation of high-performance RF components such as RF MEMS switches, tunable capacitors, and inductors. Those RF MEMS components can be fully integrated with monolithic microwave integrated circuits and therefore can potentially lead to systems with small size, lighter weight, low power consumption, and mass production [Reference Rebeiz1]. Among the mentioned RF MEMS devices, the MEMS switch is a key device due to its unique RF performance comparing to the current existing devices. These unique characteristics make MEMS switches ideal candidates for incorporation into passive circuits, such as phase shifters or tunable filters, for implementation in many terrestrial and space applications including portable telecommunication, wireless computer networks, reconfigurable antennas, and others [Reference Rebeiz and Muldavin2, Reference Newman3]. To date, only electrostatically driven MEMS switches have been demonstrated at 0.1–100 GHz with high reliability and/or wafer-scale manufacturing techniques. However, the commercialization of these devices is still hindered by reliability issues, especially the dielectric charging phenomenon [Reference Wibbeler, Pfeifer and Hietschold4, Reference Man, Lawton, Miller, Lin and Ramesham5]. Due to the dielectric charging and charge build up during the lifetime test, high adhesion or stiction occurs between the suspended electrode and the dielectric surface [Reference Wibbeler, Pfeifer and Hietschold4, Reference Rottenberg, Nauwelaers, De Raedt and Tilmans6–Reference Goldsmith, Forehand, Peng, Hwang and Ebel8].
Various characterization techniques have been used in order to investigate the dielectric charging phenomenon [Reference Zaghloul9]. For example, current measurements in metal–insulator–metal (MIM) capacitors have been introduced by Yuan et al. [Reference Yuan, Hwang, Forehand and Goldsmith10], Lamhamdi et al. [Reference Lamhamdi11, Reference Lamhamdi12], Papandreou et al. [Reference Papandreou, Lamhamdi, Skoulikidou, Pons, Papaioannou and Plana13], Daigler et al. [Reference Daigler, Papandreou, Koutsoureli, Papaioannou and Papapolymerou14], and Zaghloul et al. [Reference Zaghloul, Papaioannou, Coccetti, Pons and Plana15] while capacitance and/or voltage measurements in MEMS capacitive switches are reported by Melle et al. [Reference Melle16], Papaioannou et al. [Reference Papaioannou, Exarchos, Theonas, Wang and Papapolymerou17], Herfst et al. [Reference Herfst, Huizing, Steeneken and Schmitz18], and Ruan et al. [Reference Ruan19]. The mentioned methods, although extremely useful, lead to results that depend strongly on the nature of the device under test. Thus, in MIM capacitors the discharge takes place under a short-circuit condition and the injected charges are collected by the injecting electrodes. On the contrary, in MEMS the injected charges are collected only by the bottom electrode while the top electrode, the bridge, is in the ‘Up’ state. Additionally, MEMS failure mechanisms are often related to multiphysics phenomena. For example, fatigue, creep, and other thermally induced failure modes mix up with the dielectric charging failure mode, and yield a shift on the bias parameters of the device. Therefore, the characterization techniques that make use of MEMS switches cannot study accurately the dielectric charging phenomenon since other failure mechanisms contribute to the measurements. Besides, they are quite expensive and time consuming techniques since they require the fabrication of the complete MEMS devices, including many levels of photolithography.
Kelvin probe force microscopy (KPFM) has been employed recently and shows to be a promising method in the dielectric charging assessment for several reasons. First, it efficiently simulates charging and discharging conditions of MEMS capacitive switches providing qualitative information on dielectric free surface charge distribution and decay [Reference Lamhamdi20–Reference Zaghloul, Coccetti, Papaioannou, Pons and Plana26]. Second, the KPFM-based methodology provides a low cost and quite fast solution compared to the currently available assessment methods since the required samples for this approach consist only of thin dielectric films deposited over planar substrates, and no photolithography steps are required during the sample preparation [Reference Zaghloul, Coccetti, Papaioannou, Pons and Plana26]. In addition, the use of such technique allows studying separately the dielectric charging physics, and hence building a comprehensive understanding of the charging phenomenon without interferences with other failure mode physics.
The motivation of this work is to introduce new characterization methodologies to study the dielectric charging phenomenon based on measuring the induced surface potential over charged dielectric films using KPFM. The impact of several parameters on the charging/discharging processes has been studied. This includes the dielectric film thickness, deposition conditions, and substrate. Fourier transform infra-red (FT-IR) spectroscopy and X-ray photoelectron spectroscopy (XPS) have been performed for the investigated samples in order to study the material chemical composition. The article is organized as follows. First the investigated samples as well as the KPFM-based characterization technique are presented. This is followed by a detailed section for the results and discussion. Finally, a conclusion of the study is presented.
II. EXPERIMENTAL DETAILS
In this section the layer structure of different investigated samples is presented. This is followed by presenting the theory of KPFM surface potential measurements as well as the experiment conditions. The physical material characterization techniques used to study the chemical composition of the investigated samples are also discussed.
A) Samples' designation
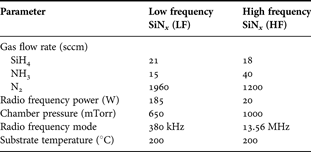
The layer structures of the investigated samples are listed in Table 1. SiNx films with different thicknesses have been deposited over evaporated gold layers and directly over silicon substrates in order to study the effect of the dielectric thickness. In electrostatic capacitive RF MEMS switches the dielectric layer is deposited over metal transmission line and extends directly over the substrate in the coplanar wave guide (CPW) slot as shown in Fig. 1. In order to investigate the difference in charging/discharging processes for these two scenarios, SiNx films have been deposited over evaporated Au and directly over Si substrate. The SiNx films have been deposited using a plasma-enhanced chemical vapor deposition (PECVD) reactor (STS, multiplex Pro-CVD). The impact of the dielectric deposition conditions on the charging/discharging processes through employing two deposition recipes: low frequency (LF) and high frequency (HF). The parameters of these two recipes are listed in Table 2, and more details about the used deposition system and conditions can be found in [Reference Zaghloul, Papaioannou, Coccetti, Pons and Plana27].
A vertical cross section of an electrostatic capacitive MEMS switch.

Description of the samples used in the study.

The samples names are designated as follows: the deposition recipe used (HF or LF) followed by the layer under the dielectric film, ex: HF-Evap Au means HF SiNx deposited over evaporated gold.
PECVD deposition conditions for LF and HF SiNx samples.
B) KPFM procedure
MultiModeTM, a commercial AFM, with NanoScope® IIIa controller and ExtenderTM Electronics Module, and scanning capacitance microscopy-Platinum Iridium Tapping (SCM-PIT) metal coated conductive tips have been used in this study. Charges are injected in single points over the SiNx surface by applying voltage pulses of defined amplitude, U p, and duration, T p, to the AFM tip during scanning the sample surface in tapping mode (Fig. 2a). In this mode the oscillating tip alternately contacts the sample surface and lifts off, generally at the cantilever resonance frequency. After completing the charge injection, KPFM surface potential measurement is performed in the lift mode [Reference Zaghloul, Papaioannou, Coccetti, Pons and Plana27]. In such a mode the topography and the potential signals are subsequently recorded. The surface topography is acquired first in tapping mode along a single line. Then, the tip ascends to a fixed distance from the sample surface, and a second scan is executed along the same line following the same topographic profile recording the surface potential. For all experiments, a fixed pulse duration, T p, has been used (1 s), and the time interval between the end of charge injection step and the beginning of the KPFM measurement has been fixed to 30 s.
Dielectric charging assessment using the KPFM-based methodology: (a) charge injection in tapping mode over the dielectric surface, and (b) the resulting surface potential profile represented by U s and FWHM.

In KPFM measurements three spectral components for the electrostatic force between the AFM tip and the sample surface exist at DC, ω, and 2ω, where ω is the mechanical resonance frequency of the AFM cantilever. Since the cantilever responds only to forces at or very close to its resonance frequency, F ω becomes the dominant one and is given by [Reference Jacobs, Knapp, Müller and Stemmer28–Reference Bhushan and Goldade30]

where C is the capacitance between the tip and the sample surface, z is the tip–sample separation, ΔΦ is the contact potential difference between the tip and the sample material, U DC is the applied DC voltage to the AFM tip from the KPFM feedback loop, and U AC is the amplitude of the sinusoidal signal applied from the oscillator to drive the AFM tip at or very close to its mechanical resonance frequency, ω, during the surface potential measurements. The main goal of the KPFM feedback loop is to adjust the potential of the tip, U DC, until the term ΔΦ-U DC becomes 0, at which point the cantilever oscillation amplitude should be zero (F ω = 0). At this point, the measured tip potential, U DC, which corresponds to the contact potential difference between the tip and the sample, ΔΦ, is equal to the sample surface potential, and is used to generate a potential map for the sample surface. Due to trapped charges in the SiNx film which results from the charge injection step, the contact potential difference between the tip and the dielectric film, ΔΦ, is altered, and is determined by the local measured tip potential, U DC.
It has been reported that the relative humidity has a very high influence on the charging/discharging processes in SiNx thin films [Reference Zaghloul, Papaioannou, Coccetti, Pons, Plana, Bagdahn, Sheppard, Turner and Vengallatore25, Reference Zaghloul, Bhushan, Pons, Papaioannou, Coccetti and Plana31]. Therefore, both the SiNx sample and the AFM tip went through two cycles of heating (150°C) and cooling steps under vacuum. In order to avoid tip crash due to thermal expansion, the AFM tip was fixed close to the hot sample stage without contact and was radiatively heated. In addition, surface potential measurements have been performed under dry air flow (relative humidity ≈ 0.02%). The optimum value of the lift scan height parameter in our experiments, which controls the separation between the tip and sample surface during the surface potential scanning, is found to be 20 nm [Reference Zaghloul, Papaioannou, Coccetti, Pons and Plana27].
The measured surface potential, U DC, has a maximum at the position which was directly under the AFM tip apex during the charge injection step, and it decreases gradually at the edges of injected position [Reference Zaghloul, Papaioannou, Coccetti, Pons and Plana27, Reference Jacobs, Leuchtmann, Homan and Stemmer32]. The analysis of results is based on the induced surface potential profile which is characterized by the potential peak, U s, and the full-width at half-maximum (FWHM) as shown in Fig. 2(b). The integral of the measured potential profile has been used as a direct indication of the injected charge density in the dielectric film. The evolution of U s with time has been also monitored and analyzed.
C) Physical material characterization
Two material characterization techniques have been used; FT-IR and XPS. FT-IR spectroscopy has been performed to provide information about the chemical bonds of the dielectric film and their variations. The infrared spectra were acquired in the 400–4000 cm−1 range with BIORAD FTS60A spectrometer with the samples under nitrogen flow to avoid the effect of humidity and ambient. The reflection and transmission modes were employed for SiNx layers deposited on metal and silicon, respectively. The XPS experiments have been used in order to provide information about the different chemical bonds and valence state in the SiNx bulk through sputtering. A VG ESCALAB 220-iXL spectrometer has been used to perform the XPS measurements. The deposited SiNx layers were excited by MgKα (1253.6 eV), and the kinetic energies of the electrons emitted were collected at a constant energy resolution of 1 eV. The energy step used to record the spectra was 0.2 eV.
The XPS results for HF and LF SiNx samples are summarized in Table 3. It is obvious from the table that both the surface and the bulk of HF and LF samples with different film thickness are all silicon rich. The N/Si ratio of the bulk is in the range from 0.670 to 0.72 and from 0.77 to 0.85 for HF and LF SiNx, respectively, with almost consistent concentrations for different elements. The natural contamination in the layer surface by carbon and oxygen is present. Here, it should be emphasized that in all investigated films, there are unknown hydrogen concentrations that could play an important role in the film properties and consequently could contribute to the charge trapping behavior. The FT-IR spectra for HF-Evap Au and HF-Si samples with different thicknesses are presented in Fig. 3(a). Also, the wavenumber of each bond for HF-Evap Au and LF-Evap Au is listed in Table 4. It is evident that there is a strong Si–H bond at around 2150 cm−1 and N–H bond at around 3356 cm−1, independent of the SiNx film thickness and substrate. Table 3 highlights also that the film thickness and substrate have a negligible influence on the N/Si ratio. This similarity was expected since those films with different thicknesses were deposited using the same deposition conditions but for different deposition durations. Also, SiNx films with the same thickness have been deposited over evaporated Au and over silicon substrate during the same deposition run.
Physical material characterization for different samples: (a) FT-IR spectra of HF-Evap Au and HF-Si SiNx films with different thicknesses, and (b) the N/Si ratio from XPS and the N-H/Si-H ratio from FT-IR for HF and LF materials.

Bulk quantification by XPS (% atomic) for the HF and LF SiNx samples (source ray Al or Mg monochromator, E p = 20 eV, correction Scofield).

The FT-IR absorptions for HF and LF SiNx films.

The comparison between HF and LF SiNx (Table 3) highlights that both materials have very close FT-IR spectra, and Si–H and N–H bonds exist in both materials. However, a shift to a lower wavenumber in Si–N bond of HF SiNx compared to LF films appears. A similar shift toward a lower wavenumber in Si–H stretching vibrations for HF films (at 2150 cm−1) is observed compared to LF material (at 2179 cm−1). Since the hydrogen content in the film will affect the silicon excess, a particular attention has been drawn on the Si–H and N–H bonds as shown in Fig. 3(b). The N/Si ratio determined by XPS analysis is also plotted in the figure. It is evident from the figure that N–H/Si–H ratio is smaller for HF SiNx compared to LF, indicating more Si–H molecules in the HF material. This is consistent with the corresponding decrease in N/Si ratio for the HF material compared to LF as obtained from XPS, which might be an indication of the presence of a larger concentration of silicon clusters in the HF SiNx films.
III. RESULTS AND DISCUSSION
Figure 4(a) shows an example of the KPFM surface potential maps obtained for a HF-Evap Au sample with 200 nm thickness, for charges that have been injected under different pulse amplitudes, U p. After completing the charge injection step, KPFM potential maps have been recorded continuously with time, and Fig. 4(a) presents some of these maps obtained at different time points. The decay of the induced surface potential with time due to charge collection is clearly observed in the figure. The induced surface potential profile obtained directly after completing the charge injection step (at t = 2 min) for charges that have been injected under different pulse amplitude, U p, is presented in Fig. 4(b). Also, the corresponding surface potential amplitude, U s, and distribution, FWHM, are presented in Fig. 4(c), and the integral of the potential profiles are plotted in Fig. 4(d). It could be seen from these figures that U s, FWHM, and the integral of potential profile increase with the applied pulse amplitude, U p. Since the integral of the potential profile is a direct indication for the injected charge density in the dielectric film, it has been used for the analysis of the obtained results.
An example of the results for HF-Evap Au sample with 200 nm film thickness: (a) KPFM surface potential maps obtained at different time points after the charge injection step showing the charge decay with time; (b) the surface potential profile measured at t = 2 min for charges which have been injected using different pulse amplitude, U p; (c) the corresponding U s and FWHM, and (d) the integral of the potential profile.

A) Impact of charge transfer between the AFM tip and the dielectric
The lift-mode used to perform the KPFM measurements in this study constitutes two consecutive scan passes to image the surface topography and then the surface potential. During the first pass the AFM tip is grounded, while during the second pass the tip potential is updated continuously by the KPFM feedback loop. Therefore, the grounded AFM in the first pass and the biased tip in the second pass are expected to contribute to the charge collection and injection processes, respectively. In order to quantify this contribution, two experiments have been performed; “KPFM decay” and “natural decay”. In both experiments, charges have been injected over the SiNx surface using the same charge injection parameters (E = 140 V/μm, T p = 1 s). In the first experiment (KPFM decay), the discharging process has been monitored by scanning the dielectric surface continuously with time after the charge injection step. In the second experiment (natural decay), the surface potential has been measured only directly after the charge injection step and then at the end of the observation time window (3.5 h). During this period the AFM tip was disengaged far from the sample surface in order to avoid affecting the charge injection or collection.
Figure 5 shows the time evolution of the normalized U s, FWHM, and potential profile integral to their initial values measured at t = 0 for the above-mentioned experiments. It is evident that U s, FWHM, and the integral at the end of observation time window are slightly larger for the “natural decay” experiment compared to the “KPFM decay” experiment. The values of U s, FWHM, and integral at the end of observation time window for the “natural decay” experiment are 58, 149, and 76%, respectively, while the corresponding values for the “KPFM-decay” experiment are 54, 144, and 73%, respectively. This small difference between the values measured in both experiments highlights that the grounded AFM tip used during measuring surface topography in the first pass of KPFM lift-mode and/or the different updated tip potential applied during determining the surface potential in the second pass have a negligible effect on the charge collection and injection, respectively. Hence, the charge transfer between dielectric and AFM tip in both KPFM passes is minimal. Based on that, studying the discharging process in electrostatic MEMS switches by monitoring the evolution of KPFM surface potential with time is proved to be a very efficient methodology. It simulates to a great extent the charge collection scenario in MEMS switches where injected charges are collected by the transmission line when the switch bridge is in the ‘Up’ state.
The influence of the AFM tip on charge injection and collection: (a) normalized evolution of U s and FWHM with time, and (b) corresponding potential profile integral.

B) Effect of SiNx film thickness on the charging/discharging processes
Figure 6 depicts the integral of the measured surface potential profile as a function of the applied electric field intensity, E, for both HF-Evap Au and LF-Evap Au samples with different film thicknesses. It is evident from the figure that for each film thickness, the higher the applied E is, the higher the integral of the measured potential profile, and hence the more trapped charge in the dielectric film will be. It is also clear that the integral of the measured potential profile is larger for thicker dielectric films when the same electric field is applied during the charge injection step. This further indicates that thicker dielectric films have larger injected charge density compared to thinner ones when the same electric field is applied. This has been found to apply for both HF and LF SiNx films, deposited over Au layers or directly over silicon.
Effect of electric field intensity, E, applied during the charge injection on the injected charge density for (a) HF-Evap Au and (b) LF-Evap Au samples, with different film thicknesses.
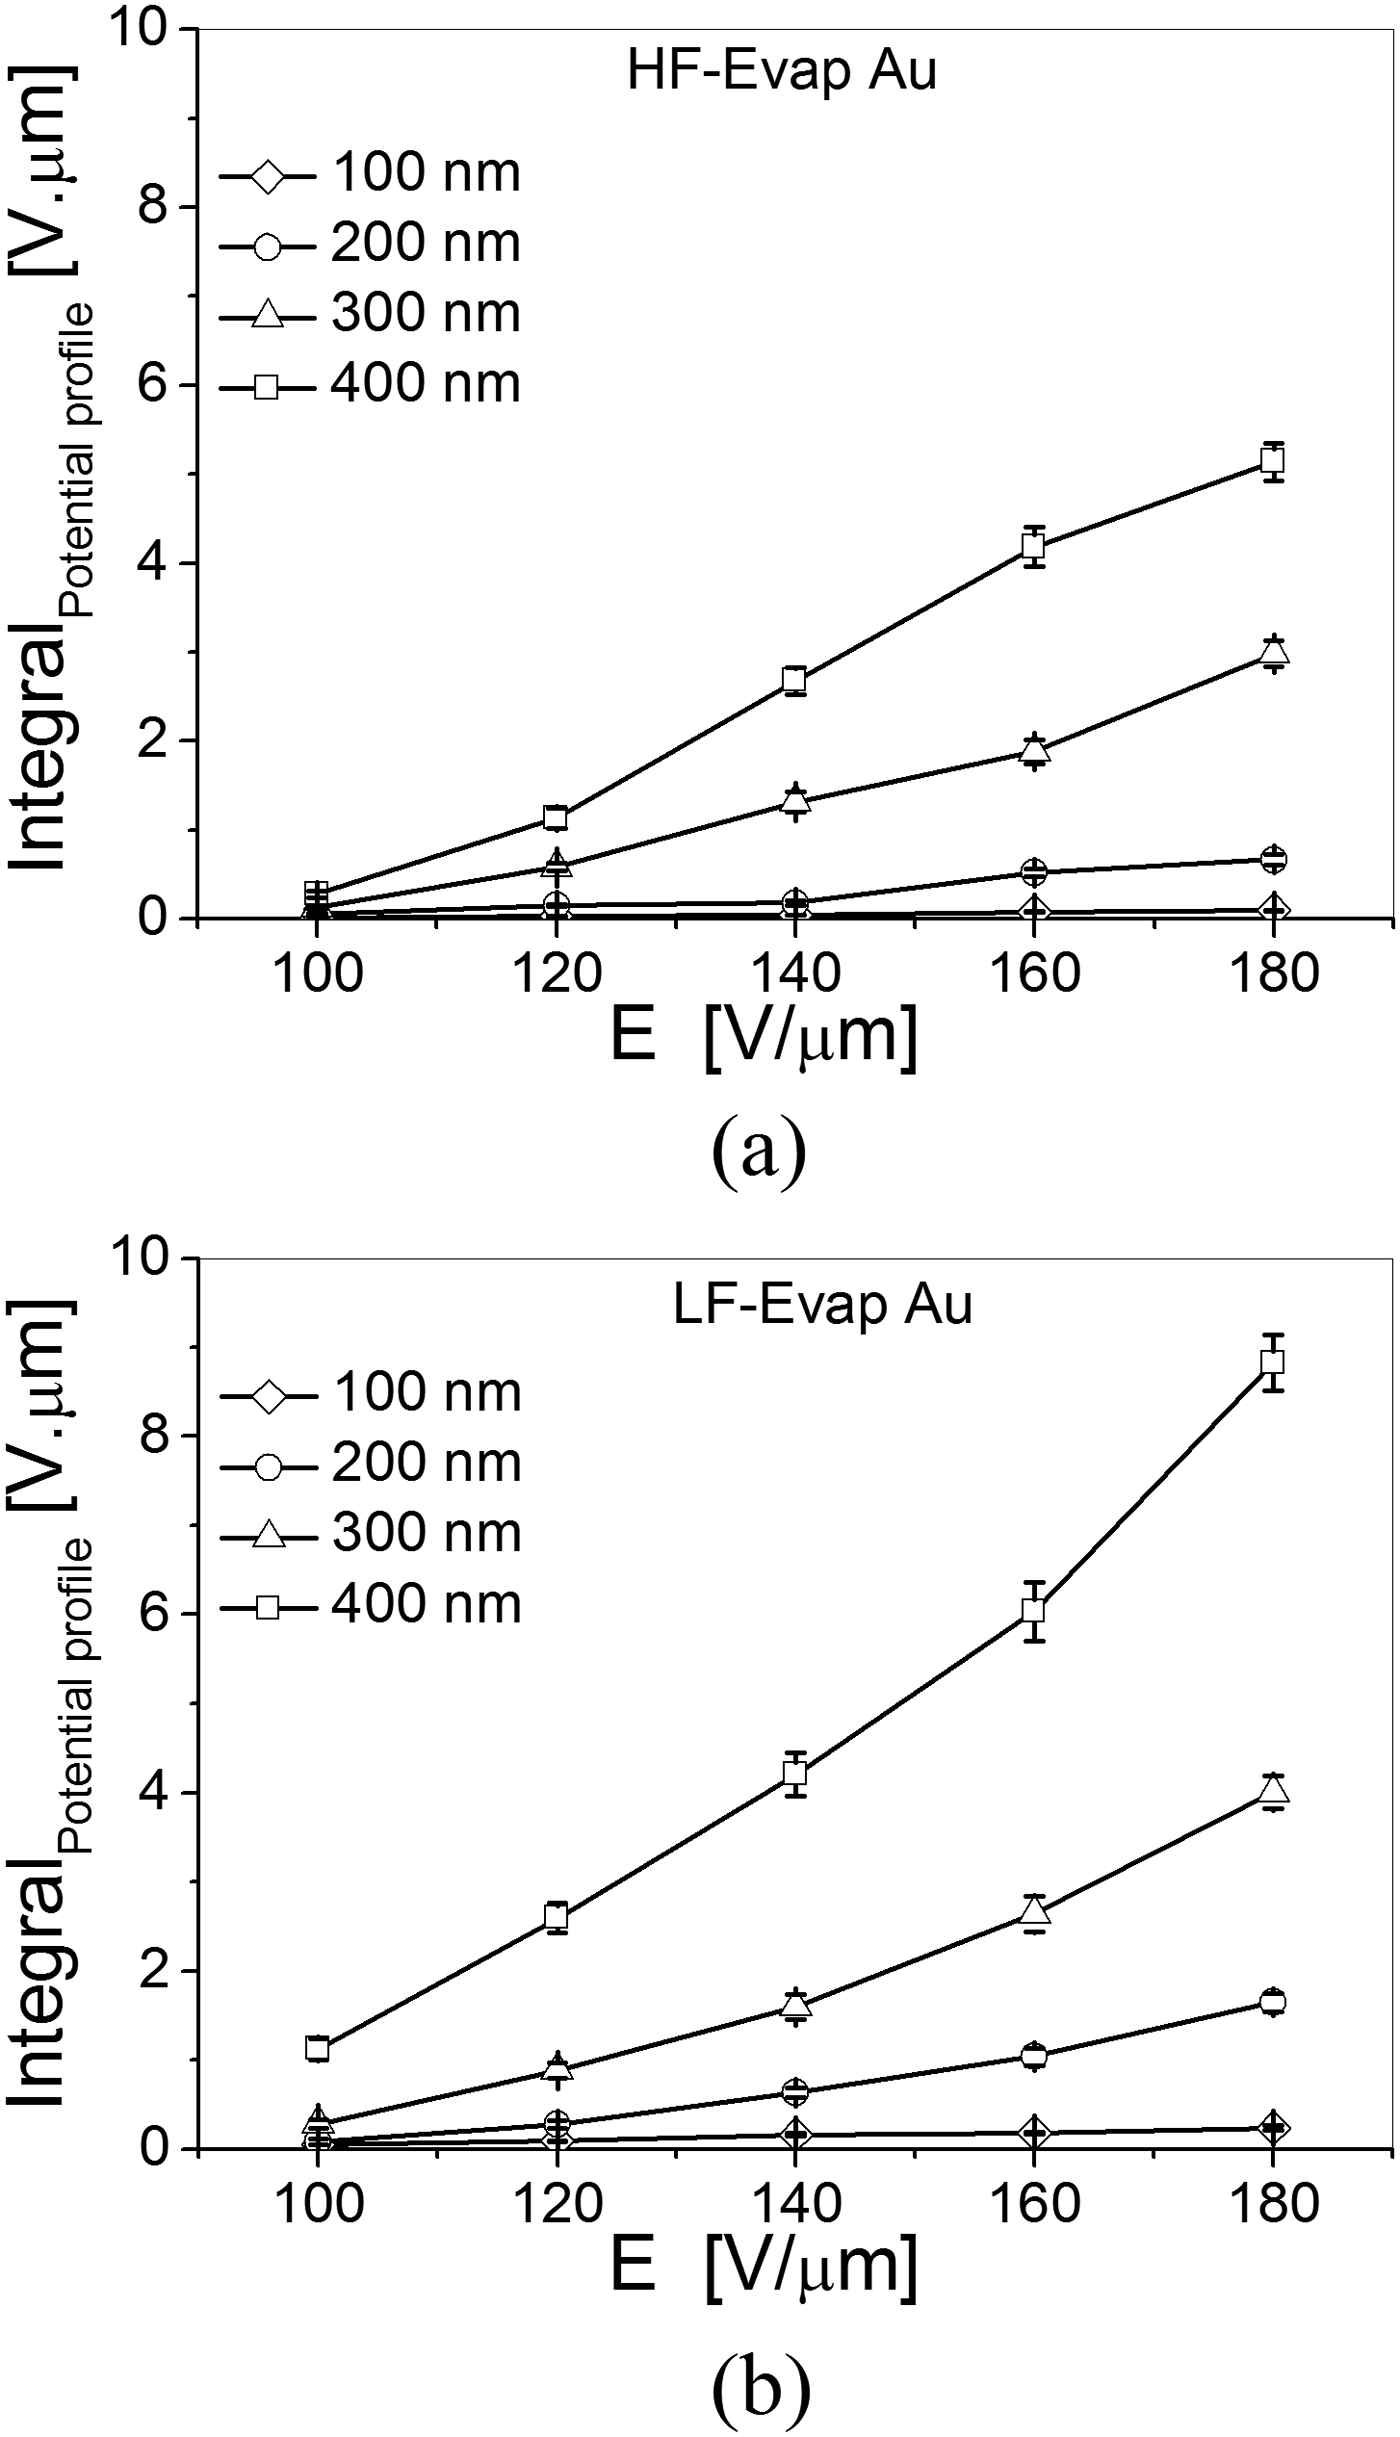
The increase of the potential profile integral with the applied electric field intensity, E, for each film thickness can be attributed to the fact that the injected charge density increases with the applied electric field intensity [Reference Ramprasad33]. For a given pulse duration, T p, there are two main factors that determine the amount of trapped charges in SiNx films with different thicknesses, which are the electric field intensity, E, and the material trap density which is directly determined by stoichiometry. As presented earlier, both FT-IR and XPS measurements lead to the conclusion that the HF-Evap Au samples with different film thicknesses have almost the same material stoichiometry. The same observation has been found for the LF-Evap Au, HF-Si, and LF-Si samples with different film thicknesses. Therefore, the main dominant parameters in determining the injected charge density for SiNx samples with different thickness are the applied electric field intensity, E, and the charge injection duration, T p. The increase in the injected charge density with the dielectric film thickness for a given applied electric field, E, cannot be explained by the contribution of the dipole orientation solely. This is because dipolar polarization will lead to the formation of a bound surface charge which is independent of the dielectric thickness. In contrast, the space charge polarization gives rise to a distribution of charges which leads to a non-neutral bulk, and depending on the material properties will lead to a macroscopic charging that may depend on the film thickness [Reference Daigler, Papandreou, Koutsoureli, Papaioannou and Papapolymerou14]. According to this we are led to the conclusion that in HF and LF SiNx materials the space charge polarization induced by trapped charge constitutes the dominant charging mechanism.
Figures 7(a) and 7(b) present examples of the surface potential, U s, evolution with time. Since a charge trapped near the surface will be monitored by KPFM, the potential decay arises from charge collection or transport to sites far from dielectric surface. The figure highlights the potential decay for HF-Evap Au samples with 300 nm thickness (Fig. 7(a)), for charges that have been injected under different electric field intensities, E. It also shows the surface potential evolution for HF-Evap Au samples with different film thicknesses for the same applied electric field intensity (Fig. 7b). For all surface potential decay experiments charge evolution has been monitored for a fixed time window of 3.5 h. As shown from the figure, the surface potential decays exponentially with time following the stretched exponential law, exp[−(t/τ)β], where τ is the process time constant, and β (0 ≤ β ≤ 1) is the stretch factor. This is observed for charges that have been injected under different electric field intensities, E, and for all investigated SiNx samples. Moreover, the stretch factor, β, has been used in previous studies [Reference Zaghloul, Papaioannou, Coccetti, Pons and Plana15, Reference Papaioannou, Exarchos, Theonas, Wang and Papapolymerou17, Reference Zaghloul34] as an index of charge collection complexity. For many investigated samples, the evolution of both the FWHM and the potential profile integral with time do not fit with the stretched exponential equation. Since the evolution of FWHM with time has been reported to be minimal at low relative humidity level similar to our measurement conditions [Reference Zaghloul, Bhushan, Pons, Papaioannou, Coccetti and Plana31], the evolution of the surface potential amplitude, U s, has been used to study the discharging process.
Discharging process for HF-Evap Au samples: Surface potential decay with time measured for (a) HF-Evap Au sample with 300 nm film thickness under different electric field intensities, E, and (b) HF-Evap Au samples with different film thicknesses under the same applied electric field intensity 140 V/μm; a summary of the calculated (c) decay time constant, τ, and (d) stretch factor, β.

The decay time constant, τ, and stretch factor, β, calculated from surface potential decay measurements for the HF-Evap Au samples are shown in Figs 7(c) and 7(d), respectively. For all film thicknesses, the decay time constant, τ, increases while the stretch factor, β, decreases with increasing the applied electric field intensity, E. The figure also shows that for a given electric field intensity, E, the impact of the dielectric film thickness on the decay time constant, τ, and stretch factor, β, is very small and does not constitute a clear trend. These remarks have been also observed for the LF-Evap Au, HF-Si and LF-Si samples, with different film thicknesses. The longer decay time constant, τ, measured for higher electric field intensities (Fig. 7c) can be attributed to the lowering of potential barrier for charge emission from band gap states due to the Poole–Frenkel effect [Reference Simmons35]. The decrease in the potential barrier is the same for all traps. Therefore, for shallow states the decrease of the potential barrier is expected to be more efficient in terms of the required energy for charge emission from these states compared to deeper ones. Since the surface potential decay is monitored in a predetermined time window (3.5 h), the apparent relaxation time will be determined by the states that exhibit relaxation times comparable to this time window [Reference Zaghloul9]. According to that when the applied electric field intensity increases, charges from shallower states will be more easily released, leaving charges trapped in deeper ones. Since the latter are characterized by larger relaxation times, it becomes clear that the decay time constant, τ, will increase with increasing the electric field intensity, E.
The decrease of the stretch factor, β, with the electric field intensity, E (Fig. 7d) points out that the discharge process deviates from the simple exponential law (where β = 1), and hence the charge collection mechanism becomes more complex. For the charging process the contribution of the Poole–Frenkel effect is expected to lead to a more complex process as the applied electric field intensity increases. In the case of discharge, the induced surface potential will be performed in the presence of internal electric fields generated by charge gradients. Then, the charge collection process is also expected to follow a more complex process since that shallow states have been previously emptied by the charging under high electric field intensities. Based on this analysis, the value of the stretch factor, β, is expected to decrease as the applied electric field intensity increases.
In MEMS capacitive switches, the actuation voltage does not vary a lot with the dielectric film thickness. This further indicates that the employed thinner dielectric films are normally exposed to higher electric field intensities compared to thicker ones. Therefore, the influence of the dielectric film thickness has been assessed using the same applied voltage rather than the same electric field, and the results are presented in Fig. 8. Figures 8(a) and 8(b) depict the integral of the measured potential profile as a function of the dielectric film thickness for the HF-Evap Au and LF-Evap Au samples, and for charges that have been injected using different pulse amplitude, U p. For each film thickness, the integral of the potential profile increases with the applied pulse amplitude, U p, which indicates more trapped charge inside the dielectric film with increasing the applied electric field intensity as explained earlier. For a given pulse amplitude, U p, the potential profile integral is found to be smaller for thicker dielectric films compared to thinner ones. In other words, the injected charge density is higher in thinner dielectric films compared to thicker ones, when the same pulse amplitude, U p, is applied. This is found to apply for both HF and LF SiNx films, deposited over Au layers or directly over silicon.
The integral of the induced surface potential profile for (a) HF-Evap Au and (b) LF-Evap Au samples as a function of the dielectric film thicknesses, for charges which have been injected under different pulse amplitudes, U p, a summary of (c) decay time constant, τ, and (d) stretch factor, β, for HF-Evap Au samples.

The decay of the induced surface potential for SiNx samples with different film thicknesses stressed with the same pulse amplitude, U p, has been also investigated. The calculated decay time constant, τ, and stretch factor, β, as a function of the dielectric film thickness for the HF-Evap Au samples are plotted in Figs 8(c) and 8(d), respectively. It is obvious from the figure that for a given film thickness the decay time constant, τ, increases while the stretch factor, β, decreases with the applied pulse amplitude, U p, due to the Poole–Frenkel effect as explained earlier [Reference Zaghloul, Coccetti, Papaioannou, Pons and Plana26]. For a given pulse amplitude, U p, thinner dielectric films are found to have longer decay time constant, τ, and smaller stretch factor, β, compared to thicker ones. The electric field intensity is larger for thinner dielectric films compared to thicker ones, for a given pulse amplitude, U p. Therefore, the influence of reducing the film thickness is equivalent to increasing the electric field intensity, and in sequence the Poole–Frenkel effect will be more pronounced leading to longer decay time constant, τ, and smaller stretch factor, β. Finally, similar trends for both the decay time constant, τ, and the stretch factor, β, under different applied pulse amplitude, U p, have been observed for the LF-Evap Au samples with different film thicknesses.
In view of the above analysis thicker SiNx films, which have smaller injected charge density (hence smaller trapped charge) and shorter decay time constant (hence faster charge decay), are more robust when compared to thinner films in order to reduce the dielectric charging phenomenon, when charges are injected using the same pulse amplitude, U p. Consequently, MEMS switches employing thicker SiNx dielectric films are expected to have less dielectric charging and therefore longer lifetime compared to switches employing thinner films. Certainly, a very high dielectric thickness cannot be used for electrostatic MEMS devices especially for capacitive RF MEMS switches which operate mainly based on the high capacitance ratio between the “on” and “off” states (C on/C off). As the dielectric thickness increases, C on/C off decreases which results in degradation of the RF performance of the device. Therefore, for capacitive MEMS switches the selection of the dielectric thickness should be a compromise between the dielectric charging phenomenon and the RF performance. Additionally, in order to further minimize the dielectric charging, it is recommended to actuate the switch using a smaller stress voltage. With smaller pulse amplitude, U p, smaller injected charge density and faster charge collection process have been observed. This conclusion agrees with the measurement results of capacitive MEMS switches where increasing the applied stress voltage is reported to accelerate dielectric charging and hence increase the actuation voltage shift [Reference Yuan, Peng, Hwang, Forehand and Goldsmith36, Reference Mardivirin, Bouyge, Crunteanu, Pothier and Blondy37], and finally results in shortening the switch life time [Reference Goldsmith38].
C) SiNx over Au versus SiNx over silicon substrate
Charging related lifetime tests of capacitive RF-MEMS switches showed that substrate charging can highly affect the reliability of these devices [Reference Czarnecki39]. Due to this phenomenon, MEMS switches fabricated on different substrates are found to exhibit different lifetimes, and also the influence of environmental conditions on the lifetime is found to depend on the substrate type. In order to accurately study the impact of the substrate charging in capacitive RF MEMS switches, the charging of the interposer dielectric layer should be completely avoided which is not possible using the characterization techniques of the actual MEMS device. Also, in RF MEMS switches fabricated over silicon substrates (Fig. 1) charge injection has different scenarios: charging of the dielectric material deposited over the metallic transmission line, and charging of dielectric deposited directly over the silicon substrate. In the latter, the formation of space charge region in the silicon substrate is expected to highly influence the charging/discharging processes. Thanks to the unique advantage of the nanoscale characterization based on KPFM, it is possible to study each of the two mentioned scenarios separately, and hence the influence of the substrate charging could be addressed properly.
Figure 9 shows the charging/discharging results for the HF and LF SiNx films deposited over evaporated Au and directly over silicon, with different film thicknesses. For a given film thickness, Fig. 9(a) highlights that the integral of the measured surface potential is larger for the HF-Evap Au samples compared to HF-Si, for charges that have been injected using the same electric field intensity, E. Similar observations exist for the LF SiNx material with different film thickness (Fig. 9b). In other words, the injected charge density in the SiNx films deposited over metal layers is larger compared to the SiNx material deposited over silicon substrates. As presented earlier, both FT-IR and XPS measurements lead to the conclusion that the HF-Evap Au and HF-Si samples have almost the same material stoichiometry. Similar observations have been found for the LF-Evap Au and HF-Si. Based on these results, it is obvious that the charging process in SiNx films deposited over silicon substrates is directly affected by the space charge region at the insulator–semiconductor interface. When SiNx films are deposited directly over silicon, the formation of depletion layer in Si substrates and the higher dielectric constant of Si material result in increasing the effective thickness of the dielectric film. Therefore, the effective electric field intensity, E, will be smaller for SiNx films deposited directly over silicon compared to SiNx deposited over Au. The injected charge density in the dielectric film follows the electric field intensity and distribution which exist during the charge injection step. For this reason the injected charge density is smaller for SiNx films deposited over silicon compared to the ones deposited over Au.
The impact of the under layer over which the SiNx film is deposited: The integral of the measured surface potential profile for SiNx films deposited over evaporated Au and over silicon using (a) HF and (b) LF recipes; (c) the normalized surface potential decay for the HF-Evap Au and HF-Si samples with different film thicknesses and charged using the same electric field intensity, and (d) the decay time constant, τ, for HF-Evap Au, HF-Si, LF-Evap Au, and LF-Si samples.

The surface potential decay with time for the SiNx samples deposited over evaporated Au layers and over silicon substrates have been also studied and an example of the obtained results is shown in Fig. 9(c). The figure presents the normalized surface potential decay for HF-Evap Au and HF-Si samples with different film thicknesses, for charges that have been injected under the same electric field intensity (E = 140 V/μm). For a given electric field intensity, E, it is clear from the figure that the surface potential decay for HF-Evap Au samples is faster compared to the HF-Si samples, and this is observed for all investigated film thicknesses. Similar remarks have been drawn for the LF-Evap Au compared to LF-Si samples. The calculated decay time constant, τ, and stretch factor, β, obtained for HF-Evap Au, HF-Si, LF-Evap Au, and LF-Si are presented in Fig. 9(d). For both HF and LF SiNx samples, it is clear that the decay time constant, τ, is longer for SiNx samples deposited over silicon compared to SiNx samples deposited over Au. This has been observed for all investigated dielectric film thicknesses as being highlighted from the figure. Regarding the values of the stretch factor β, no clear difference exists between the SiNx samples deposited over silicon and over Au, and this remark has been obtained for all film thicknesses and for both HF and LF SiNx samples. The almost similar values of the stretch factor for the SiNx films deposited over silicon and over Au layers indicate that the complexity of discharging mechanisms does not relate to the bottom physical layer over which the dielectric film is deposited.
The longer decay time constant, τ, obtained for the SiNx samples deposited over silicon compared to the ones deposited over Au could be attributed to numerous reasons. First, the charge collection by the semiconductor substrate, in the case of SiNx samples deposited over silicon, is directly affected by the presence and width of the depletion region. No such effect occurs in the case of SiNx films deposited over metal layers. Second, in the SiNx films deposited over silicon substrates the presence of interface states and the more pronounced Maxwell Wagner Sillars (MWS) effect due to discontinuity of dielectric constants and conductivities at the Si/SiNx interface give rise to the generation of an interfacial charge. These will introduce a discontinuity of the electric field intensity which is expected to affect the surface potential decay. In addition during the discharge process in SiNx samples deposited over silicon, the semiconductor surface potential will decrease too, leading to a shift of the Fermi level across the band gap at the semiconductor–insulator interface changing the occupancy of the interface states hence the interface charge. Finally, the effective thickness of the dielectric film is larger and hence the effective electric field is smaller in the case of SiNx samples deposited over silicon due to the presence of the semiconductor space charge region. As explained earlier, the charging under smaller electric field leads to smaller charge gradients and gives rise to longer discharge time constant, τ. In MEMS switches where the SiNx dielectric film is normally deposited over SiO2 layer in the CPW slot, the MWS effect becomes more significant. The charge accumulated at the interface of the two dielectrics is responsible for the “substrate charging” reported by Czarnecki et al. [Reference Czarnecki39].
D) HF versus LF deposition recipes
The influence of the SiNx deposition conditions on the charging/discharging processes is presented in Fig. 10. A comparison between the integral of the measured surface potential for HF and LF SiNx films deposited over Au layers and over silicon substrates is presented in Figs 10(a) and 10(b). For a given film thickness, HF SiNx has smaller potential profile integral compared to LF SiNx, when the same electric field intensity, E, is applied during the charge injection step. This applies for all investigated film thicknesses and for SiNx films deposited over both Au and silicon substrates. The smaller potential profile integral for the HF SiNx samples indicates that the injected charge density in this material is smaller compared to the LF material, for a given film thickness and when the same electric field intensity, E, is applied. The surface potential decay for the SiNx samples deposited with both HF and LF recipes has been also investigated. Figure 10(c) shows an example of these results for a SiNx film with 300 nm thickness deposited over evaporated Au layer. The figure clearly depicts that the surface potential decays faster for the HF SiNx material compared to the LF one, for charges that have been injected using the same electric field. This is confirmed from the calculated values of the decay time constant, τ, for both HF and LF films deposited over Au layers which are presented in Fig. 10(d). Figure 10(b) highlights also that the observed difference in the decay time constant, τ, between the HF and LF SiNx films deposited over Au layers exists for all investigated film thicknesses, and also for the HF and LF SiNx materials deposited over silicon substrates. Comparing the values of the decay time constant, τ, for the HF-Evap Au, LF-Evap Au, HF-Si, and LF-Si samples, it is obvious that the impact of the material deposition conditions (whether HF or LF) on the charge collection process is more effective compared to the influence of the substrate layer (whether Au or silicon). Finally, there is no clear effect of the dielectric deposition conditions on the stretch factor, β, for both dielectric films deposited over Au layers and over silicon substrates.
The influence of the dielectric deposition conditions: the integral of the surface potential profile as a function of the applied electric field intensity, E, for SiNx films deposited using the HF and LF recipes with different film thicknesses over (a) evaporated Au layers and (b) directly over silicon substrates; (c) the surface potential decay for the HF-Evap Au and LF-Evap Au samples with 300 nm film thicknesses, for charges which have been injected under different electric field intensities, E.

The HF SiNx layers are more silicon-rich than the LF ones as explained earlier. As reported by Lamhamdi et al. [Reference Lamhamdi12], more silicon-rich SiNx films have faster charge decay with time. This could partially explain why the HF material exhibits faster charge decay when compared to the LF one. In other words, the small difference in the Ni/Si ratio between both materials cannot alone explain the large difference found with respect to the injected charge density and decay time constant, τ, for both materials. Here it should be mentioned that the hydrogen contents in the investigated films, which could play a major role in the charge trapping process, has not been measured and is currently under investigation. On the other hand, the density of defects is expected to be larger in the case of LF SiNx material compared to the HF one due to the high RF power used during the LF film deposition (see Table 2). This difference in defects density and distribution in both materials will affect the charge injection as well as the charge collection process. In the case of SiNx deposited directly over silicon, the interface states are expected to be much higher in the LF material compared to the HF one. Additionally, the high employed RF power results in a very high deposition rate for the LF material compared to the HF one. Therefore, the LF material is expected to suffer from larger disorder due to higher energy transfer to Si and N atoms during the deposition process and the faster deposition rate. Also the spatial distribution of layers in the nanoscale is different between both materials, and is more random in the LF SiNx films as reported by [Reference Zaghloul34]. For these reasons, the LF SiNx films are expected to trap more charges during the charging injection step and then store these charges for longer time. Also, the resistivity of both materials are different showing that the LF SiNx material has smaller resistivity compared to the HF one, which might affect the charging and discharging processes [Reference Lamhamdi11]. All of these mentioned differences between both materials could explain the larger injected charge density and the longer decay time constant, τ, observed for the LF material compared to the HF one.
E) KPFM applied for charged MEMS and MIM dielectrics
In this section, two KPFM-based assessment methods have been proposed to study the dielectric charging in SiNx films implemented in MEMS switches (KPFM-MEMS) and in MIM capacitors (KPFM-MIM).
1) Non-uniform charge injection in MEMS
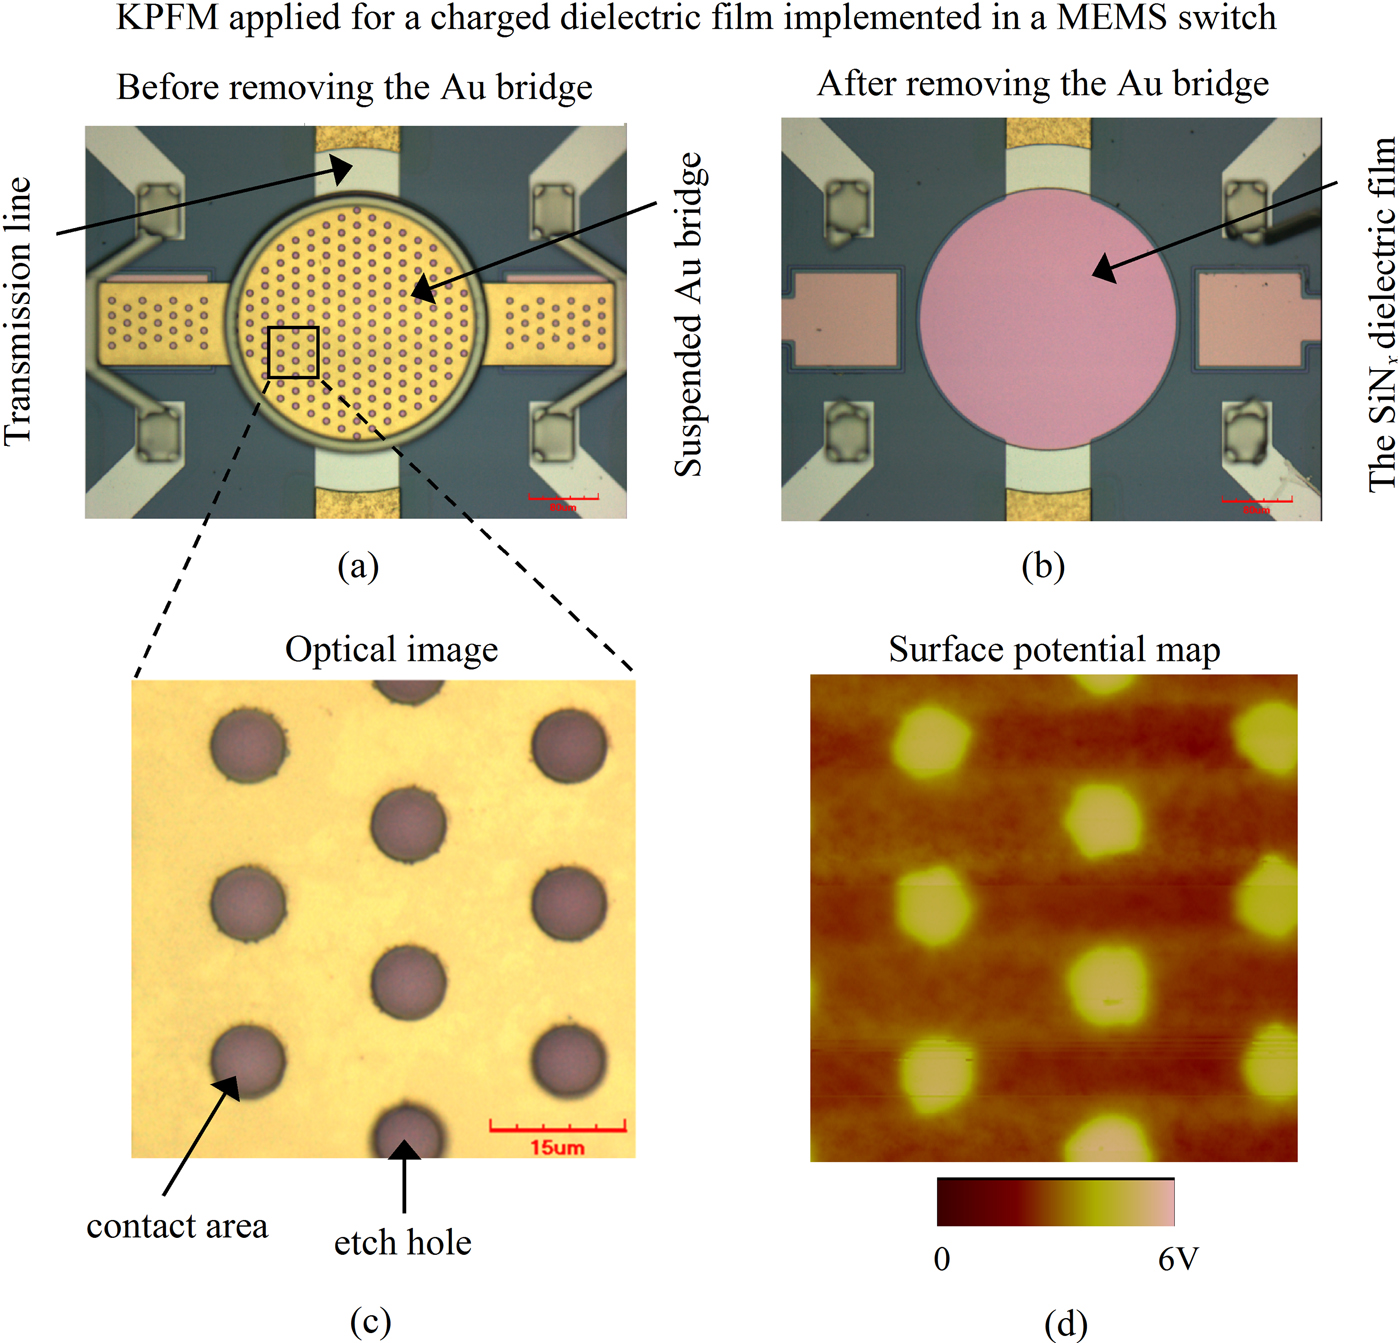
In order to study the charging process on a microscopic scale in MEMS dielectric, KPFM has been used to measure the surface potential over charged SiNx films implemented in electrostatic capacitive MEMS switches using the KPFM-MEMS method. MEMS switches with HF PECVD deposited silicon nitride films of 300 nm thickness have been used for this experiment (Fig. 11(a)). The switch was actuated first for 2 min using 40 V applied to the transmission line while the Au bridge was grounded. After stressing the switch, the suspended Au bridge was removed in order to make the SiNx surface naked for the KPFM experiment (Fig. 11(b)). Both the switch actuation step and the KPFM potential measurement have been performed under ambient conditions (RH ≈ 30–40%). Figure 11(c) shows an optical image for the suspended Au bridge over the scanned area, while Fig. 11(d) presents the corresponding surface potential map of the same area over the charged SiNx surface. The correlation between the etch holes positions both figures is quite clear. Charge injection takes place in contact areas where it does not occur in holes positions, and this leads to larger measured surface potential in contact areas compared to the etch holes positions. The surface potential measured over the SiNx films of unstressed switches was around −50 mV, which resembles the contact potential difference between the AFM tip and the SiNx materials. Although no charge was injected at the holes positions during the switch actuation, a higher surface potential than for an unstressed device is measured in these positions. The non-uniform charge injection due to roughness and topography of both the switch bridge and the dielectric film can be observed in Fig. 11(d). The KPFM-MEMS method has been applied also to monitor the charge relaxation process as will be presented in the following section.
KPFM applied for a charged dielectric film implemented in a MEMS switch: The MEMS switch used for the experiments [40] (a) before removing the suspended Au bridge, and (b) after removing the bridge; (c) an optical image for the suspended Au bridge over the scanned SiNx area, and (d) the corresponding surface potential map for the same area over the charged SiNx surface.
2) Discharging process in MEMS versus MIM
MIM capacitors have been widely used as test structures to study the dielectric charging phenomenon in MEMS switches. Two characterization methods have been often employed to investigate the charging in MIM, charge/discharge current transients (C/DCT) and thermally stimulated depolarization current (TSDC). In both methods, MIM capacitors are electrically stressed for a long time to produce saturation of dipole orientation and trapping of injected charges. This is followed by measuring the transient discharging currents in the external circuit. Due to the difference in charge collection process between MIM capacitors and MEMS switches, the C/DCT and TSDC methods lead to considerable smaller relaxation times compared to MEMS [Reference Zaghloul9]. In order to overcome this weakness for the mentioned assessment methods, we proposed another characterization technique (KPFM-MIM) to investigate the discharging process in MIM based on KPFM. In this technique, MIM capacitor with a SiNx dielectric film is electrically stressed first. Then, the surface potential of the MIM top electrode, which reflects the potential of the SiNx, has been measured with time. The KPFM-MEMS assessment method has been also applied to monitor the discharging process in a charged dielectric film implemented in a MEMS switch. Both devices have been fabricated on the same wafer, hence the same SiNx film (HF, 500 nm) is measured. For both assessment methods, the same stress conditions have been applied for charging the SiNx film (10 V for 15 min), and the charge collection process has been monitored for a fixed observation time window (20 000 s). Finally, the results from both techniques have been compared.
The normalized surface potential decay measured by KPFM-MEMS and KPFM-MIM methods is plotted in Fig. 12(a). It is obvious that the potential decay for both methods follows accurately the stretched exponential function, exp[−(t/τ)β], similar to what has been observed from the KPFM-TF measurements. Figure 12(b) shows the decay time constants calculated for different observation time windows from KPFM-MEMS and KPFM-MIM. It is evident that the relaxation time increases with the experiment time window for both methods. Increasing the experiment time window allows to monitor discharging mechanisms with longer relaxation times. Actually, this agrees with the reported data for the SiNx material based on TSDC measurements where charging was found to arise from continuous distribution of time constants around specific activation energies [Reference Papandreou, Lamhamdi, Skoulikidou, Pons, Papaioannou and Plana13]. On the other hand, the charge injection in MEMS switches is not uniform, while in MIM capacitors the charge injection is uniform and the surface potential is the same all over the top metal electrode. In spite of this difference between charge injection in MIM and MEMS, the fitting results leads to very close values for the decay time constant calculated from different observation time windows for both KPFM-MEMS and KPFM-MIM as shown in Fig. 12(b). This indicates that the decay of MIM and MEMS surface potential arises from charge collection by the bottom electrode through the same mechanisms. Figure 12(b) includes also the C/DCT relaxation time reported in previous work for SiNx films measured for the same observation time window (20 000 s) [Reference Zaghloul9]. The relaxation time for the C/DCT measurements (3.2E03 s) is much smaller compared to KPFM-MEMS and KPFM-MIM, due to the faster charge collection process by injecting electrodes which takes place in the C/DCT method. Based on the previous analysis, the C/DCT assessment technique, though useful, does not allow to study properly the charge relaxation process in MEMS dielectrics. In addition, MIM capacitors and MEMS switches can lead to the same results regarding the electrical properties of MEMS dielectrics when assessed using the KPFM-MIM and KPFM-MEMS methods, respectively.
Charge collection process in MIM capacitors versus MEMS switches based on KPFM: (a) normalized surface potential decay, (b) decay time constant as a function of the observation time window.

V. CONCLUSION
Nanoscale characterization methods have been proposed to investigate the dielectric charging phenomenon in electrostatic MEMS. The techniques are based on KPFM surface potential measurements, and are applied to study PECVD silicon nitride films in view of application in electrostatic capacitive RF MEMS switches. The impact of various parameters on the dielectric charging/discharging processes has been explored. This includes the effect of the dielectric film thickness, dielectric deposition conditions, and the substrate. FT-IR and XPS have been used to study the chemical composition of SiNx films, and the obtained results from these techniques have been correlated to the KPFM surface potential measurements.
The injected charge density and the relaxation time are found to be higher when charges are injected using larger electric field. These results are in good agreement with the reported data on increasing the shift in pull in voltage and shortening the lifetime of MEMS switches under higher actuation voltage and/or longer stress time. For the same applied electric field intensity, the injected charge density is found to be higher for thicker dielectric films compared to thinner ones. However, SiNx films with different thicknesses show a similar discharging behavior when stressed with the same electric field. When the same bias amplitude is used, thicker SiNx films are found to have smaller injected charge density and shorter decay time constant compared to thinner ones. In view of these nanoscale results, thicker SiNx films would be preferred for MEMS switches for less dielectric charging and therefore longer lifetime, after considering the C on/C off ratio degradation. The SiNx films deposited over metal layers exhibit larger injected charge densities and faster charge collection compared to the SiNx material deposited over silicon substrates. These KPFM nanoscale results could explain the reported data in literature related to the considerable influence of the substrate charging on the shift in pull in voltage and lifetime of MEMS switches. The PECVD deposition conditions of the SiNx films are shown to have a very high impact on the charging/discharging processes. The HF SiNx material is found to be more reliable with respect to the dielectric charging compared to the LF material. This is mainly due to the smaller injected charge density and faster charge decay in the case of the HF material compared to the LF one.
The non-uniform charging and the charge collection process in MEMS switches have been investigated using the KPFM-MEMS method. The surface potential map obtained for a charged SiNx film implemented in a MEMS switch reveals much higher potential in contact areas compared to etch holes positions. Applying KPFM to measure the surface potential over stressed MIM capacitors leads to relaxation times similar to the ones obtained from KPFM-MEMS method. In consequence, MIM capacitors and MEMS can lead to the same conclusions when assessed properly using KPFM. This recommends the application of the KPFM-MIM technique as a powerful tool for studying dielectric charging in MEMS. This method requires a simpler device structure, MIM capacitor, comparing to MEMS devices and hence saves cost and time.
ACKNOWLEDGEMENTS
This work has been partially supported by the following projects: the French ANR project FAME (PNANO-059), POLYNOE project funded by European Defense Agency (B-0035-IAP1-ERG), and the SYMIAE project funded by the Fondation STAE.
 Usama Zaghloul received a B.Sc. degree from the Faculty of Electronics Engineering and an M.Sc. degree from AinShams University, Egypt, both in electrical engineering in 2002 and 2006, respectively. In 2003, he joined the Electronics Research Institute, Microelectronics Department as a research assistant where he was involved in design and fabrication of tunable RF MEMS inductors and capacitors for reconfigurable wireless systems. In 2005, Usama had an internship for seven months at the MEMS and Microsensors Laboratory, Central Electronics Engineering Research Institute, India, where he went through an intensive training on micro-fabrication process development of numerous MEMS pressure and acoustic sensors. Starting from June 2006, he was with SoftMEMS company as a MEMS Physical Design Engineer. In January 2008, Usama joined LAAS-CNRS and the University of Toulouse where he is currently working towards the Ph.D. degree in Mico- and nano-systems, jointly with The Ohio State University, Nanoprobe Laboratory for Bio- and Nanotechnology & Biomimetics (NLBB), Columbus, Ohio, USA. During his Ph.D., Usama invented several characterization techniques based on different scanning probe microscopy measurements to study the dielectric charging and stiction phenomena in electrostatic NEMS/MEMS devices. Besides, he designed and developed the fabrication process of two packaging schemes for RF MEMS devices. His research interests include design, modeling, fabrication, packaging, reliability, and characterization of NEMS/MEMS devices.
 George Papaioannou received a B.Sc. degree in physics from University of Athens, an M.Sc. degree from University College London, England, and a Ph.D. degree in solid state physics from University of Athens. He is leading a team on the transport properties and the radiation effects in compound semiconductors and III–V semiconductor devices and the interaction of light in III–V compound semiconductors and SOI structures and devices. Recently, he is working on the investigation of polarization effects in insulating materials in RF-MEMS switches. He has contributed to 115 publications and more than 190 conference presentations.
 Bharat Bhushan is an Ohio Eminent Scholar and The Howard D. Winbigler Professor in the College of Engineering, and the Director of the Nanoprobe Laboratory for Bio- & Nanotechnology and Biomimetics (NLB2) at the Ohio State University, Columbus, Ohio. He holds two M.S., a Ph.D. in mechanical engineering/mechanics, an MBA, and three semi-honorary and honorary doctorates. His research interests include fundamental studies with a focus on scanning probe techniques in the interdisciplinary areas of bio/nanotribology, bio/nanomechanics and bio/nanomaterials characterization, and applications to bio/nanotechnology and biomimetics. He has authored 7 scientific books, more than 90 handbook chapters, more than 700 scientific papers (h index – 52 + ; ISI Highly Cited in Materials Science, since 2007), and more than 60 scientific reports, edited more than 50 books, and holds 17 US and foreign patents. He is co-editor of Springer NanoScience and Technology Series and Microsystem Technologies. He has organized various international conferences and workshops. He is the recipient of numerous prestigious awards and international fellowships including the Alexander von Humboldt Research Prize for Senior Scientists, Max Planck Foundation Research Award for Outstanding Foreign Scientists, and the Fulbright Senior Scholar Award. He is a member of various professional societies, including the International Academy of Engineering (Russia). He has previously worked for various research labs including IBM Almaden Research Center, San Jose, CA. He has held visiting professor appointments at University of California at Berkeley, University of Cambridge, UK, Technical University Vienna, Austria, University of Paris, Orsay, ETH Zurich, and EPFL Lausanne.
 Fabio Coccetti received the Laurea (M.S.) degree in Electrical Engineering from the University of Perugia, Perugia, Italy and the Ph.D. title in High Frequency Engineering at the Lehrstuhl für Hochfrequenztechnik at the Technische Universität München (TUM) in Munich Germany, in 1999 and 2004, respectively. In 2000 he has been seven months as visiting scientist at the Radiation Lab at University of Michigan USA. Since September 2004 he is working as research scientist at the Laboratoire d'Analyse et d'Architectures des Systèmes at the Centre National de la Recherche Scientifique (LAAS-CNRS) in Toulouse, France. During this period he has worked on numerous research projects going from the theoretical and experimental investigation of power handling in RF-MEMS to design modelling and experimental validation of RF Micro and Nanosystems. During 2004–2007 he has been the coordinator of the European Network of Excellence on RF-MEMS and RF Microsystems (AMICOM NoE). Since September 2008 he has been hired as project manager by the company Novamems, hosted as research scientist in LAAS.
 Patrick Pons received Ph.D. degree in electronics from Toulouse University (France), in 1990. Since 1991 he is a researcher in the CNRS-LAAS (National Scientific Research Center – Laboratory of Analysis and Architecture of Systems) in Toulouse. His research interests are focused in microtechnology and microsensors. In 1995, he started in the lab the study on microtechnology for microwave applications. Now he manages the development of this technology for high-frequency microsystems and develops also pressure sensors for specific applications. In 2005 he started research in a new field coupling sensors and RF for the development of passive wireless sensors.
 Robert Plana obtained its Ph.D. in 1993 at LAAS-CNRS and Paul Sabatier University on the Noise modelling and characterization of Advanced Microwave devices. In 1993, as associate professor at LAAS-CNRS, he has started a new research area concerning the investigation of millimeter-wave capabilities of Silicon-based technologies including RF MEMS. In 1999, he has been involved with SiGe Semi-conductor in Ottawa where he was working on low-noise integrated circuits for RF applications. In 2000, he has been professor at Paul Sabatier University and Institut Universitaire de France. He has built a network of excellence in Europe in the field of RF Microsystem “AMICOM”. He has authored and co-authored more than 300 international journals and conferences. In 2004, he has been appointed as Deputy Director of the Information and Communication Department at the CNRS. From January 2005 to January 2006, he has been appointed director of the same department at CNRS. Since 2006, he is heading a research group at LAAS-CNRS. From November 2007 to November 2009, he joined the “French research Agency” where he is the project officer of the National Nanotechnology Initiative. Since November 2009, he is appointed as head of the department “Physic, Mathematics, Nanosciences & Nanotechnology, Information and Communication Technology” at the Ministry of research.



