Implications
Piglets’ response to the backtest, a standardized behavior test which reflects stress coping abilities, is a moderately heritable trait. Genetic correlations between backtest response and production traits were weak and not statistically significant. Such correlations would have important implications for pig production, as genetic selection may unintentionally alter personality traits. Personality traits may in turn influence how well animals cope under different production environments which may have direct implications for pig welfare and productivity.
Introduction
Production traits can be affected by a pig’s ability to cope with stress (van Erp-van der Kooij et al., Reference van Erp-van der Kooij, Kuijpers, van Eerdenburg and Tielen2003; Cassady, Reference Cassady2007). Commercial pig production selects for improved growth and lean gain, but these traits seem unfavorably correlated with coping with stress (Cassady, Reference Cassady2007; D’Eath et al., Reference Darfour-Oduro, Naazie, Ahunu and Aboagye2009). The coping style of an individual pig reflects its preferred strategy for coping with stress (e.g. castration or mixing at weaning) and can be predicted by the pig’s response in a backtest early in life (Hessing et al., 1993; Bolhuis et al., Reference Bolhuis, Schouten, Schrama and Wiegant2005; Zebunke et al., Reference Zebunke, Repsibler, Nürnberg, Wittenburg and Puppe2015; but see Jensen et al., Reference Jensen, Rushen and Forkman1995 for an alternative review). During the backtest, piglets are placed on their back, usually for 60 s, while the number of struggles (NrS) and vocalizations (NrV), and latency to struggle (LS) and vocalize (LV) are recorded (Hessing et al., 1993; Melotti et al., Reference Melotti, Oostindjer, Bolhuis, Held and Mendl2011). The coping styles usually refer to the extreme ends of a population and are, in pigs, often labeled high (HR) and low resisters (LR).
HR pigs appear more prone to develop rigid, routine-like behavioral patterns than LR pigs, and therefore seem to have more difficulty to adjust their behavior to changing circumstances (Bolhuis et al., Reference Bolhuis, Schouten, de Leeuw, Schrama and Wiegant2004), which is demonstrated in more rigid aggression (Ruis et al., Reference Ruis, te Brake, van de Burgwal, de Jong, Blokhuis and Koolhaas2002; Bolhuis et al., Reference Bolhuis, Schouten, Schrama and Wiegant2005; Melotti et al., Reference Melotti, Oostindjer, Bolhuis, Held and Mendl2011). Moreover, the impact of environmental conditions on immune and physiological status of pigs (Ruis et al., Reference Ruis, te Brake, Engel, Buist, Blokhuis and Koolhaas2000; Bolhuis et al., 2003; Reimert et al., Reference Reimert, Rodenburg, Ursinus, Kemp and Bolhuis2014) seem to depend on their coping style as assessed in the backtest. Studies on the relationship between coping styles and (phenotypic) production characteristics such as backfat or growth have yielded inconsistent results across studies, with some studies reporting positive and some reporting negative correlations between backtest response and production traits. In addition, it has been suggested that HR pigs will, compared with LR pigs, show impaired performance when exposed to changing conditions (Geverink et al., Reference Geverink, Schouten, Gort and Wiegant2004).
Several behavioral traits (e.g. aggression, feeding behavior) have been found to be heritable (Turner, Reference Turner2011; Rohrer et al., Reference Rohrer, Brown-Brandl, Rempel, Schneider and Holl2013) and correlated with production traits (Velie et al., Reference Velie, Maltecca and Cassady2009). Therefore, it is important to understand whether and how these behavioral traits are affected by selection for production traits.
The heritability of the backtest has been previously estimated, yielding a wide range (NrS: between 0.16 and 0.53, LS: between 0.16 and 0.29) (Velie et al., Reference Velie, Maltecca and Cassady2009; Rohrer et al., Reference Rohrer, Brown-Brandl, Rempel, Schneider and Holl2013; Scheffler et al., Reference Scheffler, Stamer, Traulsen and Krieter2014; Zebunke et al., Reference Zebunke, Repsibler, Nürnberg, Wittenburg and Puppe2015). Genetic correlations between backtest variables and production traits have been scarcely reported, with either no (Rohrer et al., Reference Rohrer, Brown-Brandl, Rempel, Schneider and Holl2013) or a positive correlation between NrS and ADG (Velie et al., Reference Velie, Maltecca and Cassady2009). Given the inconsistencies between studies, and the potential impact of genetic selection for production traits on pigs’ personalities, these correlations warrant further investigation. In addition, to the best of our knowledge, no studies have estimated the heritability and genetic correlations of the vocal response of pigs (LV and NrV) during the backtest, in spite of the fact that the range in vocalization frequency is much larger than that in struggling. The objective of this study was therefore to estimate the heritability of the backtest traits and to estimate genetic correlations of these traits with production traits.
Material and methods
The study was approved by the Animal Care and Use Committee of Wageningen University and by the Animal Care and Use Committee of the University of Groningen, linked to the experimental farm.
Animals and housing
In total, 992 piglets (Tempo×Topigs-20 cross) from 80 litters equally divided over five batches (from 2010 to 2012) were subjected to the backtest at the research farm Beilen (TOPIGS Research Center IPG, Beuningen, The Netherlands). Piglets were cross-fostered if a sow had >14 piglets. In total, 6.1% of the piglets were cross-fostered. The piglets were raised in commercial farrowing pens. All piglets received an ear tag at the day of birth and an iron injection at 3 days of age. All male piglets were castrated under O2/CO2 anesthesia (at 5 days of age). Further details on housing can be found in Reimert et al. (Reference Reimert, Rodenburg, Ursinus, Duijvesteijn, Camerlink, Kemp and Bolhuis2013) and Camerlink et al. (Reference Camerlink, Ursinus and Bolhuis2014). The pedigree consisted of 15 993 animals (over 25 generations), of which 65 dams and 25 sires were parents of the piglets that were part of the experiment.
Backtest
Piglets were tested individually at an average age of 14 days (range 10 to 18). The entire litter was placed in a cart and brought to the test area where each piglet was tested away from its littermates and dam. The piglet was laid in a supine position for 60 s as described in detail in Melotti et al. (Reference Melotti, Oostindjer, Bolhuis, Held and Mendl2011), and the NrS and NrV and the LS and LV were recorded. One struggle was defined as any bout of struggling without pause; when the piglet paused and then started struggling again this was counted as another struggle. Piglets that struggled while being placed in supine position were given a maximum of 3 s to become immobile before the start of the test. If they still struggled after 3 s and could not be fixated in an immobile position, LS was set at 0. Each vocalization (note) was counted. Piglets that did not struggle were given a value for LS of 60 s (the maximum time of the test), and piglets that did not vocalize were likewise given a value for LV of 60 s. The observer for LS, LV and NrV was the same for all piglets. The handler that recorded NrS was different in batch 5, but a handler effect was not statistically significant.
Production traits
Weight records were taken at birth (BirW), at weaning (WW) and at slaughter. Growth rate (g/day) was calculated between birth and weaning (GRW, where GRW is defined as WW minus BirW divided by weaning age for each piglet) and between weaning (week 4) and slaughter (GR_FIN). Fat depth (FD) and loin depth (LoD) were measured at slaughter.
Statistical analysis
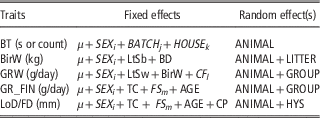
After removing potential outliers detected by ASReml (VSN International Ltd, residual with >3.5 SD in magnitude, which is a standard setting in ASReml and applied to all traits (Gilmour et al., Reference Gilmour, Gogel, Cullis and Thompson2009) and animals with missing records for the backtest, the data set consisted of 973 animals. A GLM procedure in R was used to test the significance of fixed effects of the four backtest traits and the production traits. In the initial analysis of fixed effects, P<0.20 was used to evaluate the fixed effects before adding the random effects. This is to avoid excluding important fixed effects as levels of significance of the different effects may change when adding more effects (e.g. random effects) into the model. The final evaluation of fixed effects were done with P<0.05. As no interactions were significant for the fixed effects, the step procedure (equivalent to using an F-test with type II sums of squares) was used to test significance. The step procedure uses the Akaike information criterion (AIC) to determine the least significant effect in the model, then re-runs without that effect to determine the next least significant effect. These steps are repeated until the AIC does not improve by removing any of the effects. Fixed effects for all traits are shown, along with the random effects, in Table 1.
Fixed effects included in vector b and random effects included in vector a and g for the different traits under analysis

BT=backtest traits; BirW=birth weight; GRW=growth rate from birth to weaning; GR_FIN=growth rate finishing period; LoD=loin depth; FD=fat depth; μ=overall mean for the trait; SEX i =effect of sex i (i=female or castrated male); BATCH j =effect of batch j (j=1 to 5); HOUSE k =effect of farrowing house k (k=A or B); LtSb=litter size at birth; BD=birth date; LtSw=litter size at weaning; CF l =cross-fostering (l=Yes or No); TC=indicates if animals were assigned to a trial; FS m =feeding protocol m (m=ad libitum or restricted); AGE=age at slaughter; CP=cutting protocol; ANIMAL=additive genetic effect of animal; LITTER=random non-genetic effects common to individuals born in same litter; GROUP=random non-genetic effects common to individuals in the same group at time of measurement of trait (from birth until weaning or during finishing period); HYS=herd-year-season effect, random non-genetic effects common to individuals reared in the same year and season.
The final model was as follows
 $${\bf{Y\,{\equals}\,Xb{\plus}Za{\plus}Wg{\plus}e}} $$
where Y was the vector of observations (LS, LV, NrS, NrV, BirW, GRW, GR_FIN, FD and LoD), X, Z and W known incidence matrices, b the vector of the fixed effects, a the vector of the random additive genetic effects, with a~N(0,
 $${\bi A\bisigma }_{ \bf \it A} ^{\bf 2} $$
), g the vector of random non-genetic effects of pen (original litter, pen at weaning or pen at slaughter, but not included for all traits) or herd-year-season effect for traits measured after weaning, with g~N(0,
 ${\bf{I}} _{{\bf{g}} } \bisigma _{\bf \it g} ^{\bf2} $
) and e the vector of residuals, with e~N(0,
 ${\bf{I}} _{{\bf{e}} } \bisigma _{\bf \it e} ^{\bf2} $
). The I
g
and I
e
were identity matrices of the appropriate dimensions and A a matrix of additive genetic relationships among all individuals.
A univariate analysis was run in ASReml to estimate the variance components for each of the four backtest response traits. A multivariate model was then run (based on variance components from the univariate analysis) for the four backtest traits (four-trait model) to estimate variance components and genetic correlations among the backtest traits. In addition, correlations between LS and NrS and between LV and NrV were tested without non-responders (animals that did not struggle/vocalize) to check whether the arbitrary cut-off point of 60 s created ‘false’ correlations.
Multivariate analyses were run to estimate genetic correlations between the backtest traits and production traits; BirW, GRW, GR_FIN, LoD and FD (i.e. five-trait model). Not all traits were combined in one multivariate model, but one production trait at a time with four backtest traits was included. It was necessary to include a larger data set for estimation of the production traits as the heritability estimates and genetic correlations did not stabilize for the production traits when only the animals subjected to the backtest were included. Therefore, for the production traits, the data set consisted of 7128 animals including animals from the same genetic line.
Backtest traits were also considered as binary variables because the raw data of the backtest traits did not follow a normal distribution (see the ‘Results’ section for details). Two methods for splitting the data were used. First the piglets with records higher than average were assigned a 1 and piglets with lower than average records were assigned a 0. Second, piglets were separated into responders (strugglers/vocalizers) and non-responders (non-strugglers/vocalizers). NrS or NrV were considered as no response if the piglet had a record of 0. A bivariate analysis was not run with binary variables as ASReml cannot cope with two binary variables in the same model (Gilmour et al., Reference Gilmour, Gogel, Cullis and Thompson2009). Estimated breeding values (EBVs) produced by ASReml resulting from the binary analysis were evaluated against the EBVs from the original analysis to investigate if values on the original scale and on the binary scale corresponded.
Results
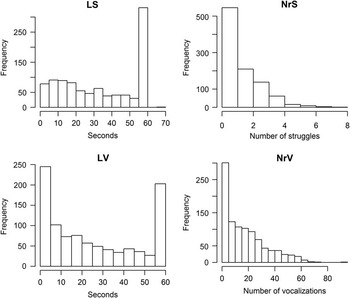
The backtest traits were not normally distributed (Figure 1). LS had a large peak at 60 s and most animals tended to have low values. For LV, large peaks were found at 0 and 60 s, whereas intermediate values were more uniform, and like LS, there was a tendency for more animals having low values. Distributions for NrS and NrV had peaks at 0, with most individuals having low values. However, mixed model equations take care of non-normally distributed traits as good as possible and the difference was tested assuming normality v. using binary traits, which showed a high correlation.
Distributions of backtest traits. Struggle traits at the top (latency to struggle (LS)) and number of struggles (NrS)) and vocalization traits at the bottom (latency to vocalize (LV)) and number of vocalizations (NrV)).
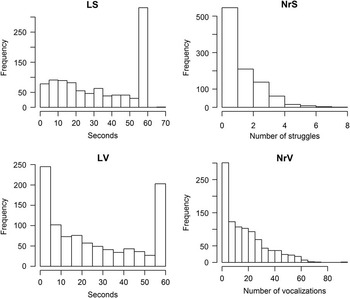
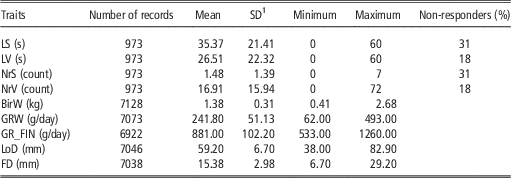
The means, number of animals and percentages of non-responders are presented in Table 2. The overall mean for LS (35.4 s) was higher than for LV (26.5 s), suggesting that pigs are quicker to vocalize than to struggle, and the mean NrV was more than 11 times larger than the mean NrS.
Descriptive statistics for all traits under analysis
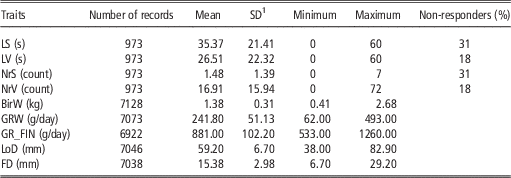
LS=latency to struggle; LV=latency to vocalize; NrS=number of struggles; NrV=number of vocalizations; BirW=birth weight; GRW=growth rate birth–weaning; GR_FIN=growth rate finishing period; LoD=loin depth; FD=fat depth.
1 SD corrected for the fixed effects and covariates used in the model for genetic parameters calculation.
Heritability estimates and genetic correlations of backtest traits
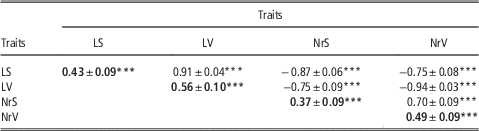
All heritability estimates for the backtest traits were significantly different from 0 (significance if P<0.05) and were high, with the highest heritability being found for LV (0.56±0.10) and the lowest for NrS (0.37±0.09), and with both vocalization traits having higher heritability estimates than the struggle traits (see Table 3). As was expected from the nature of the traits (because latency traits are usually high when struggles/vocalizations are low), LS and LV were negatively genetically correlated with NrS and NrV (Table 3). LS was more strongly genetically correlated with NrS than with NrV and vice versa for LV. LV with NrV had the strongest correlation of all backtest traits (−0.94±0.03). LS and LV had a strong positive genetic correlation (0.91±0.04) with each other. NrS and NrV were also positively correlated, but less so than the latency traits (0.70±0.09).
Heritability estimates (diagonal and bold) and genetic correlations (above diagonal) between backtest traits from multivariate analysis with corresponding SE
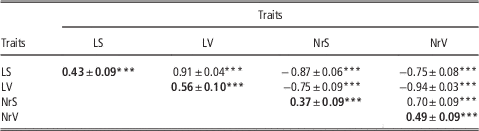
LS=latency to struggle; LV=latency to vocalize; NrS=number of struggles; NrV=number of vocalizations.
***P<0.001.
Genetic correlations were lower when non-responders were removed from the data (−0.43±0.21 (P<0.05) for struggle traits (LS with NrS) and −0.85±0.07 (P<0.001) for vocalization traits (LV with NrV)), compared with keeping the non-responders in the data set.
Production traits
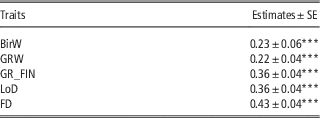
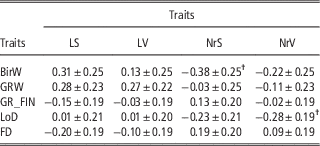
Heritability estimates for production traits were all significantly different from 0 (significance if P<0.05) (Table 4). None of the production traits were significantly genetically correlated (P>0.05) with backtest traits, but the correlation between LoD with NrV (negative), and between BirW with NrS (negative) were approaching significance (P=0.07) (Table 5).
Heritability estimates for production traits from multivariate analysis with backtest traits and corresponding SE
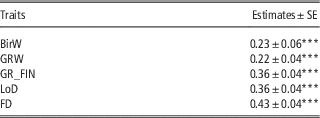
BirW=birth weight; GRW=growth rate birth–weaning; GR_FIN=growth rate finishing period; LoD=loin depth; FD=fat depth.
***P<0.001.
Genetic correlations with corresponding SE of production traits with backtest traits from multivariate analysis with four backtest traits and one production trait
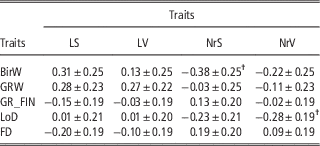
LS=latency to struggle; LV=latency to vocalize; NrS=number of struggles; NrV=number of vocalizations; BirW=birth weight; GRW=growth rate before weaning; GR_FIN=growth rate finishing period; LoD=loin depth; FD=fat depth.
†P=0.07.
Heritability estimates of backtest (non)-responders
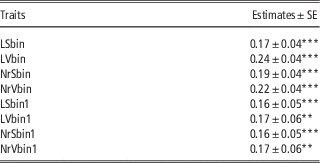
The heritability estimates from the univariate binary analysis, where piglets were divided into responders and non-responders (i.e. 0 struggles and vocalizations) were lower than the heritability estimates on the original scale (Table 6), although this was expected due to removing much of the variation when making a trait binary. Heritability estimates of the binary analysis when data were divided based on the mean were slightly higher and had smaller standard errors than estimates based on responders and non-responders (Table 6).
Heritability estimates from the univariate binary analysis where traits were given a 1 if they were above average on the original scale, and 0 if below average and heritability estimates from univariate binary analysis where traits are separated into responders and non-responders
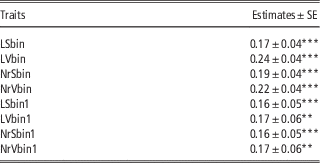
LSbin=1 if latency to struggle (LS) is above average, otherwise 0; LVbin=1 if latency to vocalize (LV) is above average, otherwise 0; NrSbin=1 if number of struggles (NrS) is above average, otherwise 0, NrVbin=1 if number of vocalizations (NrV) is above average, otherwise 0. LSbin1=1 if LS is <60 s, if LS=60 LSbin1=0; LVbin1=1 if LV is <60 s, if LV=60 LVbin1=0; NrSbin1=1 if NrS>0, if NrS=0 then NrSbin1=0; NrVbin1=1 if NrV>0, if NrV=0 then NrSbin1=0.
**=P<0.01, ***=P<0.001.
The breeding values estimated by ASReml for the binary traits were highly correlated (>0.7) with the breeding values from the original scale. The correlation coefficients between the binary traits defined as above or below average were >0.8 for all binary traits correlated with the original scale. When based on responders and non-responders, the correlations were 0.7 and −0.7 for NrS/NrV and LS/LV. The negative correlation for latency traits in this case would be because of opposite scaling of LS and LV compared with NrS/NrV, where values of 60 s got a 0 (=non-responder).
Discussion
Heritability estimates for all backtest traits were significantly different from 0, and heritability estimates were highest for the vocal response of pigs during the backtest. No significant correlations were found between backtest traits and production traits, except a tendency for lighter piglets to struggle more and piglets vocalizing less to have higher LoD.
Backtest
Heritability estimates of the backtest traits were statistically moderate (0.37 to 0.56, although from a behavioral point of view these are high (Turner, Reference Turner2011)). It has been suggested that the response of pigs in the backtest reflects part of their personality (Ruis et al., Reference Ruis, te Brake, Engel, Buist, Blokhuis and Koolhaas2000; Bolhuis et al., Reference Bolhuis, Schouten, de Leeuw, Schrama and Wiegant2004), and the heritability estimates are in the range of those for similar personality traits of other species (e.g. great tits (Drent et al., Reference Drent, van Oers and van Noordwijk2003), scallops (Brokordt et al., Reference Brokordt, Farias, Lhorente and Winkler2012). In terms of the distributions, the large peaks at 60 s can be explained by the large amount of records of 0 for NrS and NrV, which resulted in values of 60 s for latency traits. The distributions are also similar to results by Zebunke et al. (Reference Zebunke, Repsibler, Nürnberg, Wittenburg and Puppe2015).
The heritability estimate for NrS in this study was smaller than the estimate found by Velie et al. (Reference Velie, Maltecca and Cassady2009) (0.37±0.09 compared with 0.53±0.10), but higher than what was found by Scheffler et al. (Reference Scheffler, Stamer, Traulsen and Krieter2014) (0.19±0.05 (over two backtests)). The data set in the current study was about twice as large as in Velie et al. (Reference Velie, Maltecca and Cassady2009) and could explain the differences found. Zebunke et al. (Reference Zebunke, Repsibler, Nürnberg, Wittenburg and Puppe2015) found a heritability of 0.24 (±0.04) over four backtests (range 0.23 to 0.28), but did not include non-strugglers in the analysis. Rohrer et al. (Reference Rohrer, Brown-Brandl, Rempel, Schneider and Holl2013) found a heritability for NrS of 0.16 (±0.07), which was considerably lower. However, those piglets were subjected to the backtest (not all piglets of each litter were included) after weaning (24 days of age) instead of before weaning as is common practice in most studies. Both Scheffler et al. (Reference Scheffler, Stamer, Traulsen and Krieter2014) and Zebunke et al. (Reference Zebunke, Repsibler, Nürnberg, Wittenburg and Puppe2015) tested piglets over several backtests (two and four, respectively), with different heritability estimates across each test. This is relevant because the age (and also previous experiences) at the time of the backtest may influence the response of piglets (van Erp-van der Kooij et al., Reference van Erp-van der Kooij, Kuijpers, van Eerdenburg and Tielen2001). Indeed, Zebunke et al.’s (Reference Zebunke, Repsibler, Nürnberg, Wittenburg and Puppe2015) analysis of their results indicated a habituation response to the backtest.
In addition, testing over several backtests decreases environmental variance, which increases heritability (Rohrer et al., Reference Rohrer, Brown-Brandl, Rempel, Schneider and Holl2013). This could explain why the heritability estimate by Velie et al. (Reference Velie, Maltecca and Cassady2009) is higher than in the current study, but this is not the case for Scheffler et al. (Reference Scheffler, Stamer, Traulsen and Krieter2014) and Zebunke et al. (Reference Zebunke, Repsibler, Nürnberg, Wittenburg and Puppe2015), which had smaller estimates than the current study while using several backtests.
The execution of the test could also result in differences among studies. For example, some studies that report few non-strugglers count struggling when the piglet is placed on its back as the first struggle (Ruis et al., Reference Ruis, te Brake, Engel, Buist, Blokhuis and Koolhaas2000; Spake et al., Reference Spake, Gray and Cassady2012), whereas in the current study the piglet was given a maximum of 3 s to become still (if it could not be fixated in an immobile position, LS=0). This was also true for the tests by Scheffler et al. (Reference Scheffler, Stamer, Traulsen and Krieter2014) and Zebunke et al. (Reference Zebunke, Repsibler, Nürnberg, Wittenburg and Puppe2015). Velie et al. (Reference Velie, Maltecca and Cassady2009) reported that the piglet was placed gently on its back, whereas this was done firmly in the current study and this could have influenced the amount of struggling. This could explain the difference in the distribution of the data between the current study and the study by Velie et al. (Reference Velie, Maltecca and Cassady2009), which had a normal distribution. However, neither Scheffler et al. (Reference Scheffler, Stamer, Traulsen and Krieter2014) nor Zebunke et al. (Reference Zebunke, Repsibler, Nürnberg, Wittenburg and Puppe2015) reported normal distributions for the backtest, the latter describing a similar distribution as in the current study (over many more observations, n=3555 piglets, tested four times each).
The heritability for LS found by Rohrer et al. (Reference Rohrer, Brown-Brandl, Rempel, Schneider and Holl2013) was estimated to be much lower (0.16±0.07) than in the current study (0.43±0.09). This is similar to the latency estimate of Zebunke et al. (Reference Zebunke, Repsibler, Nürnberg, Wittenburg and Puppe2015) (0.17), whereas Scheffler et al. (Reference Scheffler, Stamer, Traulsen and Krieter2014) reported a heritability of 0.29. The genetic correlation estimated here between LS and NrS is similar to what has been reported by Zebunke et al. (Reference Zebunke, Repsibler, Nürnberg, Wittenburg and Puppe2015), but weaker than reported in another study (−0.91, P<0.001) (Rohrer et al., Reference Rohrer, Brown-Brandl, Rempel, Schneider and Holl2013). It can be argued that because all piglets that do not struggle or vocalize get assigned an arbitrary value for latency of 60 s, this may create a correlation that might not be present if the test period was extended. Therefore, non-responders (31% and 18% for struggles and vocalizations, respectively) were removed from the data set and bivariate analyses between LS and NrS and between LV and NrV were run again. Although the correlation coefficients were smaller than before removing non-responders (−0.43±0.21 for LS with NrS compared with −0.87±0.06; and −0.85±0.07 for LV with NrV compared with −0.94±0.03), the traits were still correlated, suggesting that although the cut-off point for latency traits is arbitrary, correlations still exist, and therefore we can assume that a cut-off point of 60 s does not invalidate the correlations. Interestingly, the correlation between traits for struggles reduced considerably more than for vocalizations. This may be due to the higher variation seen with NrV compared with NrS or due to the relative percentage of non-responders, as NrV had 13% fewer non-responders compared with NrS. It is also possible that the correlation between LV and NrV is stronger than for LS and NrS because vocalizations can be considered a more objective measure as it is easier to distinguish between two notes (for vocalizations) than two struggles as it is not always clear where one struggle stops and the next begins. However, this might depend on how vocalizations are defined; the soft ones might be harder to notice. In addition, one struggle may have a considerable longer duration than a vocalization. Overall, the high correlations found between backtest traits across studies suggest that it is not necessary to measure both LV and NrV or both LS and NrS, as was proposed by Scheffler et al. (Reference Scheffler, Stamer, Traulsen and Krieter2014). Perhaps it would be sufficient to count vocalization frequency only as this variable has more variation and is a more objective measure than using NrS. Several studies (Ruis et al., Reference Ruis, te Brake, Engel, Buist, Blokhuis and Koolhaas2000; van Erp-van der Kooij et al., Reference van Erp-van der Kooij, Kuijpers, Schrama, Ekkel and Tielen2000; Geverink et al., Reference Geverink, Schouten, Gort and Wiegant2004) have chosen to use only one backtest trait, usually struggles, to compare the backtest response with other traits. Based on the findings in this study it may be better to use vocalizations (notes) as the selected trait in future backtest studies. Moreover, in other stressful situations in later life, HR pigs have been reported to vocalize more than LR pigs (e.g. social isolation: Ruis et al., Reference Ruis, te Brake, Engel, Buist, Blokhuis and Koolhaas2001; restraint stress: Geverink et al., 2002), suggesting that the vocal response of pigs may, apart from an active v. passive behavioral response, be another reflection of their coping style.
Production traits
The heritability estimates for the production traits were in accordance with other studies (Hermesch et al., Reference Hermesch, Luxford and Graser2000; Solanes et al., Reference Solanes, Grandinson, Rydhmer, Stern, Andersson and Lundeheim2004; Darfour-Oduro et al., Reference D’Eath, Roehe, Turner, Ison, Farish, Jack and Lawrence2009). No significant correlations were found for any of the backtest traits with growth rate (GRW or GR_FIN), BirW, LoD or FD. Phenotypic associations between backtest traits and production traits were reported by Camerlink et al. (Reference Camerlink, Ursinus and Bolhuis2014) using the same data set as the current study.
Although there were no significant genetic correlations between backtest traits and production traits there seems to be an indication that pigs that struggle less in the backtest have less fat, and grow slower during the finishing period than pigs which struggles more in the backtest, but have a faster growth before weaning. The lack of a significant correlation for backtest traits with growth is in agreement with findings by Rohrer et al. (Reference Rohrer, Brown-Brandl, Rempel, Schneider and Holl2013), but Velie et al. (Reference Velie, Maltecca and Cassady2009) found significant genetic correlations between NrS and average daily gain (positive), back FD (negative), loin muscle area (negative) and BW (positive). In cases where phenotypic correlations (not covered in this study) have been studied (e.g. van Erp-van der Kooij et al., Reference van Erp-van der Kooij, Kuijpers, Schrama, Ekkel and Tielen2000; Ruis et al., Reference Ruis, te Brake, Engel, Buist, Blokhuis and Koolhaas2001; Cassady, Reference Cassady2007; Spake et al., Reference Spake, Gray and Cassady2012), results are inconsistent between studies too.
It is possible that the result of the backtest is not correlated to growth per se, but that growth may be influenced by the way in which the pigs cope in different environments or with potentially stressful experiences. Hessing et al. (Reference Hessing, Schouten, Wiepkema and Tielen1994) found that when pigs were mixed according to their coping style at the start of the grower/finisher period, pigs in groups with a mix of HR and LR pigs had the highest ADG, compared with groups composed solely of HR or LR pigs. These pigs also had a better meat percentage, a better carcass classification and higher total weight (Hessing et al., Reference Hessing, Schouten, Wiepkema and Tielen1994). Studies have also found differences in daily growth between pigs with different coping styles in different environments (Ruis et al., Reference Ruis, te Brake, Engel, Buist, Blokhuis and Koolhaas2001; Bolhuis et al., Reference Bolhuis, Schouten, Schrama and Wiegant2006). For example, Bolhuis et al. (Reference Bolhuis, Schouten, Schrama and Wiegant2006) found that for HR pigs, there was a tendency for higher ADG in piglets remaining in an enriched environment compared with being moved to a barren environment halfway through the study, whereas this difference was not seen in LR pigs. Furthermore, when faced with social isolation, in the 2nd week after isolation, LR pigs had a significantly lower daily growth than HR pigs (Ruis et al., Reference Ruis, te Brake, Engel, Buist, Blokhuis and Koolhaas2001). Geverink et al. (Reference Geverink, Heetkamp, Schouten, Wiegant and Schrama2003 and Reference Geverink, Schouten, Gort and Wiegant2004) found no interaction between housing type (individual stalls v. group housing) and backtest type, and no difference between BW of HR and LR gilts at 13 months of age. When gilts were re-located from their home pen to climate respiration chambers, however, HR pigs showed a lower ADG and lower energy metabolizability (Geverink et al., Reference Geverink, Schouten, Gort and Wiegant2004), suggesting that they have more difficulty to cope with changes in their environment, which is in line with behavioral studies (e.g. Bolhuis et al., Reference Bolhuis, Schouten, de Leeuw, Schrama and Wiegant2004). These findings may be important for breeding, because some personality traits may be more suited in certain environments or certain conditions than others.
Heritability estimates for (non)-responders
Due to the distributions (on the original scale) and the nature of the backtest traits (i.e. many records with 0 as a value), it was difficult to perfectly normalize the distribution of the backtest traits through transformation. Despite losing much variation when making continuous traits binary, all traits were found to be heritable (although with a considerably smaller heritability than on the original scale). Zebunke et al. (Reference Zebunke, Repsibler, Nürnberg, Wittenburg and Puppe2015) also analyzed NrS as a binary trait and found heritability estimates between 0.21 and 0.32, which is slightly higher than in the current study. This suggests that the backtest traits still seem heritable, regardless of how they are defined, and indicates that if desirable, it would be possible to select for these traits. Guerra (Reference Guerra2004) suggested that when heritability estimates are lower for the binary trait than on the original scale, the trait might be affected by environmental factors not accounted for in the analysis. Thus, it is possible that factors (e.g. test location (i.e. separate room or in hallway outside pen), temperature, test surface) not accounted for may play a role in the outcome of the backtest. However, heritability estimates and genetic correlations are reasonably robust to deviations from normality when using residual maximum likelihood (Roff, Reference Roff2001).
Conclusion
The aim of this study was to estimate the heritability of backtest traits and to estimate genetic correlations of these traits with production traits. Heritability estimates for backtest traits were significantly different from 0 regardless of the type of analyses, which enables genetic selection for these traits. The estimates for heritability for the backtest traits were in the range 0.37 to 0.56, where vocalization traits had higher heritability estimates than struggle traits. The genetic correlations between backtest traits were high and it is therefore possible to consider just one or two backtest traits for selection purposes. No significant genetic correlations were found between backtest traits and production traits, although piglets with a higher birth weight tended to struggle less and piglets with a higher LoD tended to vocalize less. However, it is unlikely that selecting for lean gain will immediately result in a shift in the distribution of coping styles. This suggests that although backtest traits are not directly correlated with production traits, some association exists, and the coping style of the pig may be of interest for rearing in different environments.
Acknowledgments
The authors would like to acknowledge technicians Fleur Bartels, Monique Ooms and Merel Verhoeven, and all students involved in collecting the data and employees of the experimental farm TOPIGS Research Center IPG B.V. for taking care of the sows and piglets. This research is part of the project ‘Seeking Sociable Swine? Incorporating social genetic effects into pig breeding programs to achieve a balanced improvement in productivity and welfare’ which is funded by the program ‘The value of Animal Welfare’ of the Netherlands Organization for Scientific Research and the Dutch Ministry of Economic Affairs.