Introduction
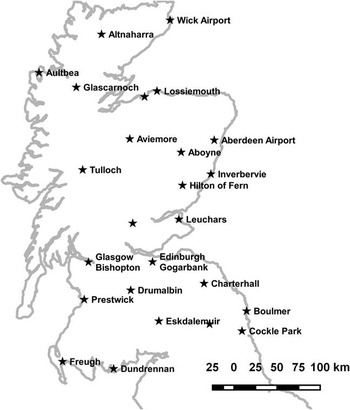
Growers are routinely reliant on good weather data to inform management decisions. Local weather data is also becoming increasingly important as input into computational plant development models and agricultural decision support systems (e.g. Hoogenboom, Reference Hoogenboom2000). Outside research environments, the costs of the set-up and maintenance of a weather station on a commercial farm might not be justified. In addition, multiple stations are often required to adequately cover the desired spatial extent of modern farms. Increasingly there are commercial agricultural services being proposed that include some form of plant development or environmental modelling to adjust local farming practices and the accuracy of these is likely to be reliant on the availability of local weather data. In this contribution air temperatures obtained from an online weather forecast service will be compared with air temperatures obtained from a series of weather stations (Figure 1). The temperature data were obtained mainly from UK Met Office (Met Office) weather stations and from weather forecasts issued by the Norwegian Meteorological Institute (MET Norway) for the weather station locations. In some aspects the MET Norway forecast service (MET Norway, 2016) was a “black box” for us during the data collection period (note: On the 15th of December 2016 MET Norway changed the forecast model used for parts of Northern Europe, including our study area. The HIRLAM model, that provided the forecast data used in this study, was replaced with the lower (spatial and temporal) resolution ECMWF model). The complete forecast period was about 9 days and could be divided into a long and short term forecast. The latter one covered approximately the first 48 hours and was given at a resolution of 1 hour. In the long term regime the time resolution of the forecast dropped to 6 hours. The available time resolution can depend on the location because different weather models are used in different parts of the world (MET Norway, 2016b). Air temperature determines thermal time which is key to modelling cereal (decimal) growth stages. We start by visualizing the difference between daily air temperatures based on MET Norway weather forecasts and daily air temperatures based on weather station measurements for the same locations. In a second step we investigate if daily air temperatures based on the weather forecasts can be a suitable substitute for daily air temperatures based on station recordings required by a cereal phenology model. We used a CERES-Wheat type phenology model based on (Johnen et al., Reference Johnen, Boettcher and Kage2012) that takes temperature and day length as inputs. Decimal growth stages were calculated for two locations using daily temperature values based on local forecast data, on-site weather station data and data from (a) nearby Met Office station(s).
Locations of the weather stations used in the study. Location names not shown from North to South are Kinloss, Strathallan and Redesdale. The coastline of the UK was extracted from the GSHHG database (https://www.soest.hawaii.edu/pwessel/gshhg/). The figure was prepared with QGIS.

Materials and methods
Weather stations
Data from 23 UK Met Office stations were retrieved through the Met Office DataPoint service (Met Office, 2016). In-house written scripts were used to access and store the data automatically. The time resolution of the provided data is hourly (assuming no missing data). The scripts were scheduled to run twice a day (00:35 UTC and 23:35 UTC).
The data from the Met Office station at Cockle Park Farm, Newcastle University (LAT 55.213°, LON -1.686°) were retrieved through the Newcastle University Library with the exception of data for October 2016 that were provided by the Met Office directly. The time resolution is 1 day and air temperature is available as temperature extremes, the minimum and maximum values observed in a 24 and 12 hour period, and as the air temperature at 09:00.
The weather station at SoilEssentials Ltd., Hilton of Fern (LAT 56.7317°, LON -2.8023°) is a commercially available CaipoBase device produced by Caipos GmbH (Gleisdorf, Austria) with the data accessible through the manufacturer’s CaipoWeb interface. Data was logged at hourly intervals initially but changed to 10 minute intervals averaged to 1 hour on the 04/05/2016.
Weather forecasts
Online weather forecast data were obtained from MET Norway through their application programming interface (API). In-house written scripts were used to access and store the data for several locations automatically. The scripts were scheduled to run twice a day starting at 04:05 UTC and 16:05 UTC respectively. The API only required the geographic location in decimal degrees. The API could accept the altitude above sea level and this option was used here. The forecast data were stored for the locations of the weather stations shown in Figure 1. The Met Office DataPoint service was used to obtain the station locations and altitudes. The location and altitude for the Met Office station at Cockle Park Farm was extracted from the Met Office website (Met Office, 2016b). SoilEssentials’ weather station location and altitude was estimated with a Trimble Nomad (Trimble Inc., Sunnyvale, CA, United States) and compared with the height contour lines on a local Ordnance Survey map (OS Explorer 389, scale 1:25000, last map update 2007).
Data processing
All processing of the stored weather data described in the following was done in R version 3.3.2. (R Core Team, 2016). Different data processing steps were necessary depending on the data source and on the mode of data recording. In a first step air temperature data was extracted from all weather station and forecast data sets. The Cockle Park Farm station did not record the daily median air temperature. This quantity was calculated as the mean from the daily maximum and minimum air temperature. These extremes were recorded in a 09:00 to 09:00 period. All data were checked for missing records, duplicated entries and order of the time stamps. In terms of station data, all entries having the same time stamp more than once were removed. For the MET Norway forecast data, since new data was appended twice a day to the previous record, only the latest update for a given time stamp was retained.
The following check was performed only for the forecast data. The time difference between each forecast time point and the time this forecast was generated was calculated and compared against a 13 hour threshold. All entries exceeding this threshold were removed.
Again, all data was checked for duplicated entries and order of the time stamps. In two cases where the time stamps were not ordered the responsible records were removed.
The MET Norway forecast data for the Hilton of Fern weather station location (LAT 56.7317°, LON –2.8023°) was requested with an altitude of 105 m. The temperature forecast data was converted using a factor of –0.006 °C/m to an altitude of 110 m.
All hourly air temperature data were aggregated into daily temperature data by using the median. At the same time it was recorded how many hourly temperature values contributed to the daily median temperature value. No temperature value was assigned to those days on which less than 22 temperature values contributed to the daily median value.
The time series of air temperature data from the 15/04/2016 to 18/10/2016 was used for further analysis. For each location the daily difference between temperature values aggregated from forecasts and stations were calculated. The temperature difference was only computed for days where a value was available from the station and forecast data.
Modelling cereal growth stages
The growth stage model required temperature sequences without missing values. A visual comparison was performed between the station locations and the Met Office UK climate districts map (Met Office, 2016c). The climatic region (Scotland North, Scotland East, Scotland West or North East and East England) of each location was estimated. Monthly mean temperatures spanning several decades for each of the climatic regions mentioned above were obtained from the Met Office (Met Office, 2016d). This data was further aggregated into median temperature values for each month in each climatic region using all available years. Missing values in the daily temperature sequences (see previous subsection) were replaced with the corresponding monthly median temperature values from the corresponding climatic region.
Two locations (Hilton of Fern and Cockle Park Farm) were chosen. The daily air temperature time series from the forecast, the on-farm weather station and the nearest Met Office DataPoint station(s) were used independently as inputs to a cereal phenology model. The cereal phenology model was modified but a description of those modifications and the model is beyond the scope of this article. The phenology model was run with two different parameter sets, identical for each of the two locations. Some spring barley growth stages were collected on a single plot at Hilton of Fern during the growing season 2016. These were used to estimate some model parameters while other model parameters were manually adjusted for a spring crop (parameter set 1). A second parameter set consisted mainly of winter wheat default parameters but the vernalization requirement was reduced (parameter set 2). Since the focus is on understanding the impact of daily temperature series from different sources on the simulated growth stages, model details and parameters have not been elaborated on. The simulation period covered the period from the 17/04/2016 to the 30/09/2016 to capture crop development through to harvest.
Results and discussion
In our experience the altitude for a location should be provided when requesting forecast data because the built-in estimation of the forecast service can lead to surprising results (probably only outside of Norway). For example the location altitude of Aboyne station (LAT 57.0770°, LON –2.8360°) estimated by the forecast service is 316 m whereas the Met Office DataPoint service states the station altitude as 140 m. Altitude was important when dealing with air temperature forecast data as the MET Norway service reduced the temperature of the forecast by a fixed 0.6°C for every 100 m increase in altitude. This seemed to be a reasonable approximation although the lapse rate might show monthly variation (Table 1 in Lennon and Turner, Reference Lennon and Turner1995). We did not have information on the spatial resolution of the forecast data. Using some equidistant (2.5 km) test locations around Hilton of Fern with an arbitrary altitude of 100 m, temperature variations were observed for locations 2.5 km apart. Apparently, the short term forecast was updated twice a day and our request schedule was supposed to be in sync with the latest updates. The update timings could vary.
The reasons for missing data updates were mainly related to the local IT and not to the data service providers. In principal a 9 day weather forecast would cover for missing updates within this interval, however, we decided for this study to use only the most recent temperature forecast values for comparison with measurements. After applying our filters and aggregating the hourly temperature data into daily median values we obtained temperature series spanning 187 days and 25 locations. The number of missing temperature values in these 187 days ranged from 35 to 60 (19–32%). Current work at SoilEssentials aims to reduce this error rate by moving data requests and storage into a cloud-based system.
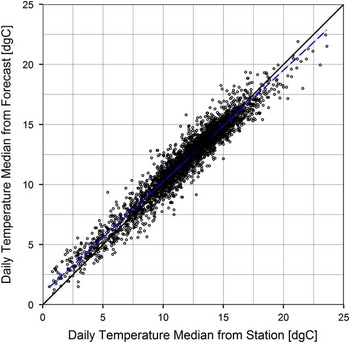
A scatterplot of all daily median temperature value pairs is shown in Figure 2. Ignoring any structure in the time series of the differences between temperatures obtained from forecast and stations at the moment, we observe a good agreement between both sources (Pearson’s r=0.967). The distribution of the temperature differences (not shown) has a median of 0.1°C and an interquartile range of 1.0 °C with the first quartile at −0.4°C and the third at 0.6°C. The 5th percentile has a value of −1.25 °C and the 95th percentile has a value of 1.52°C. No difference between the daily median temperatures has an absolute value greater than 4 °C.
Plot of the daily median temperatures obtained from the MET Norway forecast against daily median temperatures obtained from Met Office and SoilEssentials’ weather stations for the period from 15/04/2016 to the 18/10/2016. In total 25 locations contributed 3545 data points. The dashed blue line represents a linear fit with slope 0.93 and intercept 0.94.

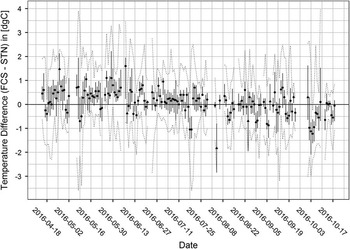
Figure 3 shows for each day summary statistics of the available temperature differences across all locations. Note that the number of locations that contributed to the basic summary could vary on each day depending on data availability (see different markers in Fig. 3). A trend of the median (markers in Fig. 3) of the temperature differences from positive to negative values from the first to the last observations is visible. The interquartile range of the differences (vertical bars in Fig. 3) shows considerable variation without an obvious pattern. A trend and seasonal analysis of the temperature difference time series will be valuable once longer series spanning multiple seasons are available. Of course it would be of interest to analyse the temperature differences not only on the time but also on the spatial scale. Ideally, such an analysis could result in a spatio-temporal model of the temperature differences.
Temperature difference between forecast (FCS) and station (STN) per day aggregated over all locations. The position of the marker indicates the daily median (all locations) of the temperature difference and the vertical bar indicates the interquartile temperature difference range. The dotted lines indicate the observed extremes of the temperature differences. If the median marker is a circle a temperature difference was available from 13 to 25 locations, a triangle indicates that less than 13 locations contributed to the temperature difference.

Our modified cereal phenology model allowed a comparison of the impact of differences in the air temperature time series – obtained from forecasts or stations – on the simulated dates of key decimal growth stages (e.g. Tottman and Broad, Reference Tottman and Broad1987). Where data were missing from the station or forecast, the corresponding monthly median temperature value for the specific climate region was used as a replacement. No attempt was made to analyse the statistical impact of the replacements on the temperature time series. Depending on the density of the in-season data collected, future work could include a more sophisticated approach that puts emphasis on the climate of the current season. The time period of the weather data used here covered the spring barley production at Hilton of Fern and within this period critical growth stages occur, that usually need targeted management (fertiliser and agro-chemicals). It was desirable to use two different parameter sets with the same temperature series and check the impact on the differences of the simulated growth stages.
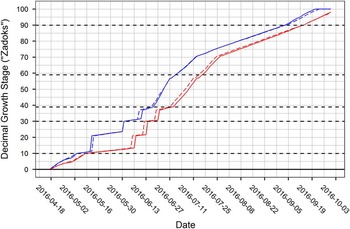
Figure 4 shows the results of the modified phenology model for Hilton of Fern when using temperature data from the MET Norway forecasts (dashed lines) and the on-site weather station (solid lines). The results using the parameter set resembling spring barley are shown in blue (curves on the left) and the results obtained with the second parameter set are drawn in red (curves shifted to the right). It can be seen that the growth stages modelled with the air temperatures obtained from different sources are in good agreement and can depend on the used model parameters. A closer look at some key decimal growth stages (here 10, 21, 30, 31, 39, 59 and 90) shows that for these stages the differences in the modelled dates are not greater than 1 day (parameter set 1) and 3 days (parameter set 2) respectively. Similar results (1–3 day difference in modelled growth stages) were achieved at Cockle Park Farm (data not shown).
Decimal growth stages simulated using daily temperatures from forecasts (dashed lines) and stations (solid) at Hilton Fern. The two lines on the left (blue) and the two lines shifted to the right (red) were generated with different parameter sets (see text for details).

The Met Office stations nearest to Hilton of Fern in this data set are Inverbervie (35.5 km distance), Aboyne (38.5 km) and Leuchars (39.7 km). The phenology model was run with temperatures from these stations. Key growth stage dates were compared with results using air temperature from Hilton of Fern station as input. Following maximum differences for key growth stage dates were observed. Inverbervie: up to 10 days (parameter set 1 and 2). Leuchars: 4 days (set 1) and 7 days (set 2). Aboyne: up to 3 days (set 1) and a better performance with only 2 days for set 2. The three Met Office DataPoint stations have a similar distance to Hilton of Fern but the variation in the differences of the simulated key growth stages can be substantial.
This pronounced effect of local weather and/or climate seems not to be present in the following case. The nearest Met Office DataPoint station to Cockle Park Farm is Boulmer (23.8 km). Date differences for key growth stages obtained with temperatures from Boulmer show maximum deviations of 1 day (parameter set 1) and 2 days (parameter set 2). So for the second parameter set the performance is slightly better compared to temperatures obtained from the forecast.
Conclusion
The results indicate that temperatures forecasted by the MET Norway may be sufficiently accurate to be used as approximation to station measurements for applied cereal growth stage modelling if an on-site weather station is not available. The differences in modelled key growth stage dates resulting from the use of different temperature sources can depend on the location and the used model (parametrization). We anticipate that the introduced uncertainty from switching to a forecast against a measured air temperature reading will not be detrimental to growth stage modelling in commercial agricultural environments, especially given other uncertainty sources such as the discrete observation scale or inhomogeneous plant development in a single field. However the full impact on modelling the growth stages of winter cereals does need further work, especially across an entire season. Other agricultural modelling approaches, e.g. deterministic crop models, will need to define their own acceptable thresholds for differences between forecasted and measured temperatures.
Acknowledgements
This work is part of a Knowledge Transfer Partnership project and the authors gratefully acknowledge funding by Innovate UK. The authors are grateful to the Norwegian Meteorological Institute (MET Norway) for providing online access to their weather forecast data. Furthermore we acknowledge the UK’s Met Office for providing UK weather station data through DataPoint and UK regional climate summaries. The authors thank the R Core Team from the R Foundation for Statistical Computing, RStudio, the QGIS project and the IrfanView project. Figures 2 to 4 were created using ggplot2 maintained by Hadley Wickham.