INTRODUCTION
A long-standing but unresolved question in tropical forest ecology is the extent to which communities comprise ecologically distinct species, occupying different positions along local environmental gradients, versus species that are ecologically similar (Fedorov Reference FEDOROV1966, Hubbell Reference HUBBELL2001). If interspecific niche differences exist, they are expected to promote species diversity within heterogeneous landscapes by allowing different species to excel at different microsites. However, a high degree of ecological similarity may also promote species coexistence, and hence diversity, by decreasing the probability of competitive exclusion of species (Hubbell Reference HUBBELL2001). Ecologically similar species might either tend towards a subset of available environmental conditions, or be environmental generalists, with their site occupancy mainly determined by random mortality and dispersal dynamics.
Our theoretical understanding of rain-forest community assembly has developed largely based on studies of tropical trees. However, another significant fraction of diversity is found in the understorey (Gentry & Dodson Reference GENTRY and DODSON1987, Landim et al. Reference LANDIM, PROENÇA, SALES and MATOS2015, Linares-Palomino et al. Reference LINARES-PALOMINO, CARDONA, HENNIG, HENSEN, HOFFMANN, LENDZION, SOTO, HERZOG and KESSLER2009). There are several reasons to suspect that the degree and type of habitat specialization might differ for large trees vs. smaller understorey plants in relation to, for example, soil and topographic conditions. Firstly, although trees begin their life cycle as small seedlings, strictly understorey plant species will perceive the abiotic environment at a finer spatial grain throughout their life cycle than trees do. Secondly, trees are longer-lived, on average, so their distributions may reflect environmental conditions integrated over a longer time period. Each of these factors might result in a tighter relationship between the distributions of understorey species with measured environmental variables than those of established trees (de Knegt et al. Reference DE KNEGT, VAN LANGEVELDE, COUGHENOUR, SKIDMORE, DE BOER, HEITKÖNIG, KNOX, SLOTOW, VAN DE WAAL and PRINS2010, Murphy et al. Reference MURPHY, SALPETER and COMITA2016, Zagt & Werger Reference ZAGT, WERGER, Newbery, Prins and Brown1998). This would be expected to manifest as a greater prevalence of habitat specialization in understorey species and perhaps also as a greater degree of interspecific habitat differentiation. Thirdly, divergence between the distributions of plant groups on soil gradients might occur if they differ in their average nutrient requirements, or, in the case of understorey plants vs. trees, because the former tend to have more superficial root systems than do established trees (Becker & Castillo Reference BECKER and CASTILLO1990, Grainger & Becker Reference GRAINGER and BECKER2001, Wright Reference WRIGHT1992) and so access different soil nutrient pools. Shallow-rooting species are also likely to be more sensitive to variation in topsoil water availability than are deeper-rooting plants, which can contribute to different patterns of topographic species sorting (Comita & Engelbrecht Reference COMITA, ENGELBRECHT, Coomes, Burslem and Simonson2014) or other forms of hydrological niche segregation (Silvertown et al. Reference SILVERTOWN, ARAYA and GOWING2015).
In tropical forests, sorting of plant species’ distributions has been amply documented on topographic and soil gradients, as well as among edaphically and topographically defined habitat types, from local (e.g. single ridge-valley systems) to landscape scales (< 10 km2) (Chuyong et al. Reference CHUYONG, KENFACK, HARMS, THOMAS, CONDIT and COMITA2011, Clark et al. Reference CLARK, CLARK and READ1998, Reference CLARK, PALMER and CLARK1999; Comita & Engelbrecht Reference COMITA and ENGELBRECHT2009, Reference COMITA, ENGELBRECHT, Coomes, Burslem and Simonson2014; Gunatilleke et al. Reference GUNATILLEKE, GUNATILLEKE, ESUFALI, HARMS, ASHTON, BURSLEM and ASHTON2006, Harms et al. Reference HARMS, CONDIT, HUBBELL and FOSTER2001, John et al. Reference JOHN, DALLING, HARMS, YAVITT, STALLARD, MIRABELLO, HUBBELL, VALENCIA, NAVARRETE, VALLEJO and FOSTER2007, Jones et al. Reference JONES, CICUZZA, VAN STRAATEN, VELDKAMP and KESSLER2014, Metz Reference METZ2012). However, the proportion of species for which significant habitat biases are detected has varied greatly across studies, leading to a range of conclusions about the likely importance of niche vs. neutral processes in community assembly. One limitation of these studies is that they have usually focused on topographic habitats alone, or occasionally on soil habitats alone, rather than considering both these dimensions of environmental variability. Furthermore, cross-taxon comparisons of habitat biases in individual tree vs. understorey species at the same study site have rarely been carried out (but cf. Murphy et al. Reference MURPHY, SALPETER and COMITA2016).
Here, we compare the local topographic and soil habitat distributions of trees, including palms and lianas, and two phylogenetically distant understorey plant groups that are common in lowland Neotropical rain forests, the Melastomataceae and ferns. Specifically, we test three hypotheses: (1) that habitat specialization is more prevalent in the two understorey groups than in trees; (2) that understorey plants manifest a greater degree of interspecific habitat differentiation than trees, and (3) that trees are biased towards different topographic and perhaps soil conditions than are the two understorey plant groups.
METHODS
Study area
The study was carried out in c. 5 km2 of old-growth rain forest at La Selva Biological Station of the Organization for Tropical Studies (OTS) in Costa Rica. La Selva is classified as Tropical Wet Forest in the Holdridge life zone system (Hartshorn & Hammel Reference HARTSHORN, HAMMEL, McDade, Bawa, Hespenheide and Hartshorn1994). Annual precipitation averages c. 4000 mm (OTS, unpublished rainfall data 1990–2006). Monthly precipitation is highly variable, but averages over 150 mm during the driest months, and over 400 mm during the rainiest months. Mean monthly temperature is c. 26°C all year (Sanford et al. Reference SANFORD, PAABY, LUVALL, PHILLIPS, McDade, Bawa, Hespenheide and Hartshorn1994).
Plant data
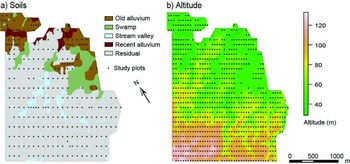
Tree species were inventoried in 1170 small circular plots (each 100 m2 in area) between 1993 and 1995 (Clark et al. Reference CLARK, CLARK and READ1998, Reference CLARK, PALMER and CLARK1999). All woody plants ≥ 10 cm in diameter at breast height, including palms and lianas, were recorded. Plots were centred on permanent tubes marking the intersections of a 50 × 100-m grid within the forest (Figure 1). Fern species were inventoried in 1154 of the tree plots in 2001 and 2002. These comprised all individuals with at least one green leaf ≥ 10 cm in length, including climbers and epiphytes that had green leaves less than 2 m above the ground. Two congeneric ferns, Tectaria athyrioides and T. rivalis, were confused in the field, so they are combined in the analyses. Melastomataceae species were inventoried at 327 of the sites in 2002. A larger plot size was used for the Melastomataceae inventory (200 m2), because their densities were anticipated to be relatively low (Orlando Vargas, pers. comm.). Furthermore, plot spacing was usually 100 × 200 m in the Melastomataceae inventory, but was denser in some areas in order to increase the representation of rarer soil types. The Melastomataceae comprised all individuals that were large enough to be identified to the family; in practice the minimum height was c. 5 cm.
Locations of the 277 (a) and 983 (b) sampling plots that were included in the statistical analyses overlaid on maps of soil types (a) and altitude (b) across the study area at La Selva Biological Station in Costa Rica. Plots were located within three upland soil types: old alluvial, stream valley and residual soils.

Environmental data
The study area encompasses many small ridge and valley systems, and most plots were on slopes of variable steepness. Slope angle in degrees across each plot was measured by Clark et al. (Reference CLARK, PALMER and CLARK1999) using a clinometer. Each plot was assigned a topographic position by refining a similar earlier index (Clark et al. Reference CLARK, PALMER and CLARK1999) using the slope angle data: 1 = riparian, 2 = low, flat ground (slope angle < 5°), 3 = lower slopes, 4 = mid-slopes, 5 = upper slopes and 6 = high, flat ground (slope angle < 5°).
Soil data for each plot were obtained from composite samples taken in 1998–1999 (top 10 cm of mineral soil, 8–10 subsamples per plot; David B. Clark, unpubl. data). All samples from within each plot were pooled, oven-dried and analysed at the Institute of Soil Science and Forest Nutrition at the University of Göttingen in Germany for pH (in 1M KCl), total C and total N (measured by combustion), total P (HNO3-pressure extraction), and the exchangeable cations Al, Ca, K, Mg and Mn (1 M NH4Cl percolation).
We focus on species distributions within three upland soil types: old alluvial, stream valley and residual soils (Figure 1a). Plots in swamps and on periodically inundated recent alluvial soils were excluded. A total of 1011 upland plots included soil and topographic data as well as data on tree and fern distributions. Many of the soil variables were correlated. Hence, we ran a principal component analysis (PCA) to identify the main independent dimensions of variability in the soil data. Prior to running the PCA, we took the natural logarithm of the essential plant nutrients N, P, Ca, K, Mg and Mn. Carbon and Al were not transformed, as these are not plant nutrients, and pH is already expressed on a logarithmic scale. All variables were standardized before analysis. The first three soil PCA axes represented 67% of variation in the original soil data. Soil axis 1 was most strongly a function of ln(Mn), ln(Ca), Al and pH: lower values on this axis represent more acidic sites with higher soil Al but lower Mn and Ca concentrations. Soil axis 2 was most strongly a function of soil C and ln(N), and soil axis 3 of ln(P).
In the statistical analyses, the first three soil PCA axes were used to describe the major soil gradients in our study area, and slope and topographic position were used to describe topographic gradients. Correlations between the environmental variables were mostly weak. The strongest correlation between any environmental variable pair was that between soil axis 1 and the topographic position index (R = −0.43).
Data preparation
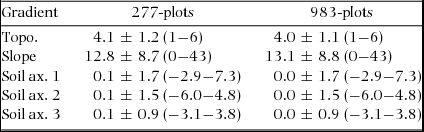
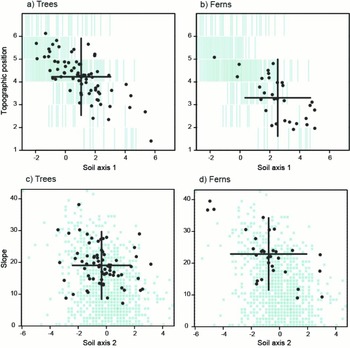
We compared the species occurrence distributions of trees, Melastomataceae and ferns on soil and topographic gradients in a total of 277 plots (i.e. those Melastomataceae inventory plots that coincided with upland soil types, Figure 1a). We furthermore compared the distributions of tree and fern species on the same environmental gradients in a larger upland soil dataset (n = 983 plots, Figure 1b) to see whether consistent results were obtained, particularly for large trees, whose frequencies of occurrence in the plot network are lower on average than are those of the two understorey plant groups. These 983 plots were selected from among the total set of 1011 plots on which the soil PCA was calculated such that environmental gradient lengths in the retained plots matched those in the 277 plot subset. The means and standard deviations of gradient values in the two datasets were also very similar (Appendix 1).
Prior to analysis, we excluded all strictly epiphytic species from the fern data (40 species, 42% of the total in the 983-plot dataset). From the tree dataset, we excluded all Melastomataceae species (six species, 42 individuals) and 26 liana individuals that had not been identified to species. We were unable to exclude possible trees ≥10 cm dbh from the Melastomataceae dataset, as we only recorded plant height and not stem diameter in the Melastomataceae inventory. However, the available height information suggests that trees ≥10 cm dbh were rare in the Melastomataceae dataset: only 11 Melastomataceae individuals were recorded as >5 m in height, and only one as >10 m.
Species optima and tolerances
Species occurrence distributions on each environmental gradient were compared among the plant groups using two metrics: species optima (O) and species tolerances (T), sensu Schaffers & Sýkora (Reference SCHAFFERS and SÝKORA2000). Species optima were calculated as:
 $$\begin{equation*}
O = \frac{{\mathop \sum \nolimits_i^n \frac{{{X_i}}}{{{f_i}}}}}{{\mathop \sum \nolimits_i^n \frac{1}{{{f_i}}}}}
\end{equation*}$$
where Xi = environmental gradient values in those plots (i = 1 to n) that contain the species. To account for uneven environmental sampling, each occupied plot was inversely weighted in the calculations by fi = total plot density in a moving window centred on plot i and covering 10% of the range of environmental gradient X. Species tolerances were calculated as:
 $$\begin{equation*}
T = \sqrt {\frac{{\mathop \sum \nolimits_i^n \ \frac{1}{{{f_i}}}{{\left( {{X_i} - {O}} \right)}^2}}}{{\mathop \sum \nolimits_i^n \frac{1}{{{f_i}}}}}}
\end{equation*}$$
Our approach to correct for uneven sampling density along each environmental gradient is based on a moving window and thereby differs slightly from that of Schaffers & Sýkora (Reference SCHAFFERS and SÝKORA2000), who divided the gradient into fixed segments.
It is important to note that these metrics are specific to this dataset and do not correspond to species’ physiological optima or tolerances. Rather, O simply represents the mean of the gradient values in plots occupied by the species and T represents the sample standard deviation of the species’ occurrences on the gradient, relative to its optimum. Hence T is a measure of the range of environmental conditions within which the bulk of a species’ occurrences were observed. We calculated O and T for species observed in at least 10 sample plots. Rarer species were excluded, as estimates of their habitat distributions are highly uncertain.
Randomization tests of habitat association
If species show habitat specialization, their observed optima on a gradient should diverge from random expectation and/or their tolerances should be narrower than expected at random, given the number of occupied plots. We tested these predictions both for each species separately and for the mean optima and tolerances of each plant group by comparing observed values to those obtained after randomizing species occurrences across sites. We also calculated the standard deviations of the species optima within each plant group on each gradient, and tested whether these were either over- or under-dispersed relative to random expectation. It can be hypothesized that greater variation in species optima leads to lower interspecific resource competition on a gradient.
If both environmental conditions and species distributions are spatially autocorrelated, the statistical significance of an association between them cannot be assessed by freely randomizing the species occurrences among sites. Instead, one should either maintain or mimic the observed spatial structure of species’ distributional ranges in the randomizations. Torus translations are a commonly applied solution to this problem for regular sampling schemes (Harms et al. Reference HARMS, CONDIT, HUBBELL and FOSTER2001), but our sampling scheme was irregular. Hence, we ran a series of spatially constrained randomizations of the occurrences of each species among sites, and retained for further analysis those iterations whose spatial structure was deemed sufficiently similar to that actually observed. Sufficient similarity was defined according to two criteria: (1) the observed maximum geographic distance between plots in which the species was present (OBS_MAXD) and (2) the distances between all pairs of occupied sample plots (OBS_DIST).
In each randomization run, we assigned the first occurrence of each species to a plot entirely at random. We then calculated how many plots were available within a circle of radius OBS_MAXD/2 centred on that plot. If plot availability was less than the number of species occurrences to be assigned, a new initial plot was chosen at random. Once the initial plot had been selected, we limited all subsequent occurrences of the same species at random to within one of 11 pre-defined radii of the initial plot. These radii were defined as OBS_MAXD of the focal species multiplied by a constant ranging at even intervals of 0.1 from 0.5–1.5. From among the resulting set of 11 randomized species occurrence distributions, a subset was selected in which the maximum distance between occupied sites (RAND_MAXD) was within 20% of OBS_MAXD (criterion 1). From this subset the final randomization result whose internal spatial structure most closely correlated with that in the observed data was selected (criterion 2). To evaluate this, Pearson correlations were calculated between OBS_DIST and the geographic distances between occupied plots in the randomized data (RAND_DIST), both transformed into vectors and sorted in ascending order. This two-step process produced randomized species distributions that closely resembled those observed.
We repeated this process 10000 times. After each run, we calculated the optimum and tolerance values for each randomized species distribution, and from these the plant group means, and the standard deviations of optima within each plant group. The observed values for both species and plant groups were compared with the distributions of the randomized values across all 10000 runs in two-tailed tests for species optima, and in a one-tailed test for species tolerances, to determine their statistical significance. Evidence of habitat specialization was defined as an observed optimum significantly different from random expectation and/or an observed tolerance value narrower than expected at random.
The species-wise results allowed us to calculate the percentage of habitat specialists in each plant group (1) on each environmental gradient individually and (2) on at least one of the five environmental gradients tested (hypothesis 1). On a single environmental gradient, 10% of species can be expected to have either divergent optima or narrow tolerances just by chance (under a two-tailed test of divergence in optima and a one-tailed test of narrower tolerances, with a P = 0.05 threshold for significance in each). For the five soil and topographic gradients, due to multiple testing, 40% of species are likely to show divergent optima and/or narrow tolerances on at least one gradient just by chance. Hence we only consider percentages exceeding these values to be truly significant.
Comparison of observed vs. randomized standard deviations of optima within each plant group enabled us to assess evidence of significant interspecific habitat differentiation within each plant group (hypothesis 2).
The tests of plant group mean optima and tolerances allowed us to assess whether each plant group had an overall tendency towards non-random habitat association on each gradient. Finally, we tested whether the plant groups differed in the positions of their mean species optima on the environmental gradients (hypothesis 3). This was done by taking the observed optima for all species in all three plant groups and permuting their plant group memberships 10000 times. The difference between mean plant group optima was recalculated after each permutation. Differences in mean tolerance values between plant groups were not tested, because these are confounded by differences in their average frequencies of occurrence.
RESULTS
Prevalence of habitat specialization within plant groups
The 277-plot dataset included a total of 157 tree species, 45 Melastomataceae species and 52 fern species. Of these, 26 tree species, 32 Melastomataceae species and 21 fern species were frequent enough to be analysed (i.e. occurred in at least 10 plots). The 983-plot dataset included a total of 233 tree species and 68 fern species, of which 72 tree species and 31 fern species were frequent enough to be analysed.
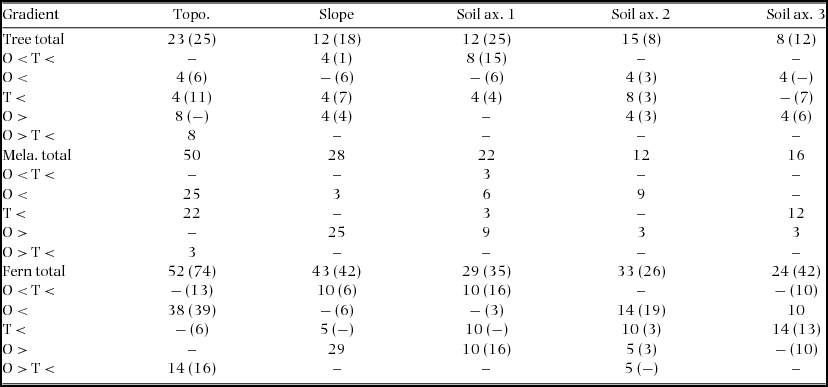
Many species showed evidence of habitat specialization on at least one of the five soil and topographic gradients. In the 277-plot dataset, this was the case for 58% of the tree species tested, 75% of the Melastomataceae species, and 81% of the fern species (Appendix 2). In the 983-plot dataset, evidence of habitat specialization was found for 57% of the tree species tested and 87% of the fern species. All of these values exceed the percentage expected by chance alone (40%).
On the individual gradients, the percentage of species in each plant group with a distributional bias exceeded random expectation (10%) in most cases. Distributional biases with respect to topographic position were common in all three plant groups, and especially in the two understorey plant groups (Table 1). Species optima in ferns and Melastomataeae were most often biased towards lower topographic positions than expected at random, whereas the opposite pattern was more frequent in trees. Species tolerances narrower than random expectation were also most frequently detected in relation to topographic position in all three plant groups, and especially in the Melastomataceae. In relation to slope angle, species optima in both the Melastomataceae and ferns were most often biased towards steeper microsites than expected at random.
Percentages of tree, Melastomataceae (Mela.) and fern species showing habitat specialization on gradients in topographic position (Topo.), slope angle (Slope) and soil chemistry (soil PCA axes 1–3) in 277 plots vs 983 plots in old-growth forest at La Selva Biological Station, Costa Rica. Tests involving Melastomataceae were only possible for the 277-plot dataset, whereas tests on trees vs. ferns were run on both the smaller and the larger 983-plot dataset. Results for the 983-plot dataset are reported in parentheses, where they differed from those for the 277-plot dataset. Habitat specialization was defined as observed species optima (O) either significantly greater than (>) or less than (<) random expectation, or species tolerances (T) significantly narrower than (<) random expectation, or both. Statistical significance was calculated by comparing observed species optima and tolerances with obtained for the same species and environmental gradient after 10000 spatially restricted randomizations of species occurrences among sites. Randomization tests were run on all species that were encountered in at least 10 plots (in the 277-plot dataset: n = 26 Tree, n = 32 Mela., n = 21 Fern; in the 983-plot dataset: n = 72 Tree, n = 31 Fern). Under our test criteria, a total of 10% of species on any single gradient are expected to show either optima divergent from random expectation or narrower tolerances than expected just by chance. The results for the individual species in each plant group are in Appendix 2.

Most tree species with distributional biases in relation to the main soil gradient (soil axis 1) tended towards lower values (more acidic and cation-poor soils) than expected at random. In contrast, habitat biases in both understorey plant groups were more evenly distributed along this gradient. On soil axis 2, most fern and Melastomataceae species with distributional biases tended towards lower values (less carbon- and nitrogen-rich soils), whereas habitat biases in trees were more evenly distributed. For trees, the frequency of distributional biases detected on soil axis 2 did not exceed random expectation in the 983-plot dataset. On soil axis 3, distributional biases were most frequently detected in ferns, and these were more often towards low values (lower soil phosphorus). The frequency of tree species with distributional biases on soil axis 3 was close to random expectation.
Dispersion of species optima within plant groups
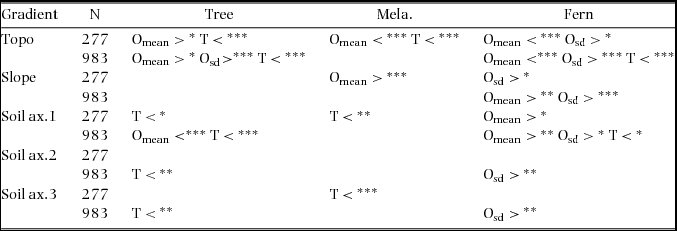
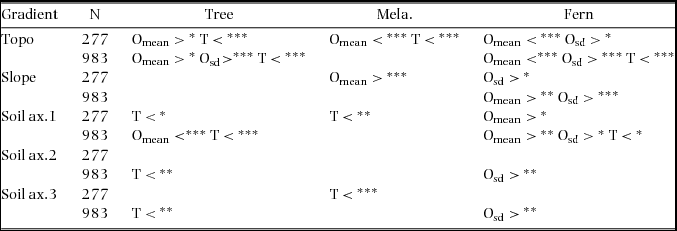
In ferns, interspecific habitat differentiation, as measured by the standard deviation of species optima on each gradient, exceeded random expectation on all five gradients tested in the 983-plot dataset (Table 2). In the 277-plot dataset, the same was true for two of the five gradients (topographic position and slope angle). In contrast, the dispersion of species optima in the Melastomataceae did not differ from random on any gradient. In trees, the only significant pattern was over-dispersion of species optima in relation to topographic position in the 983-plot dataset.
Plant group means and standard deviations of species optima (Omean, Osd) and means of species tolerances (T) that diverged from random expectation with respect to topographic position, slope angle, and three soil PCA axes in 277 and 983 plots in old growth rain forest at La Selva Biological Station, Costa Rica. The smaller dataset includes trees, Melastomataceae and ferns. The larger dataset includes trees and ferns only. All species occurring in ten or more plots in each dataset were included in the calculations. See Table 1 legend for details of sample size. Statistical significance was calculated by 10000 randomizations of species occurrences among sites (– not significant, *P < 0.05, **P < 0.01, ***P < 0.001). We tested whether observed means and standard deviations of optima were greater than (>) or less than (<) random expectation in a two-tailed significance test, and whether mean tolerances were narrower than (<) random expectation in a one-tailed test.
Plant-group mean optima and tolerances
Evidence of habitat specialization at the plant-group level was found slightly more often in the 983-plot dataset than in the 277-plot dataset for both trees and ferns (Table 2). In both datasets, trees tended – on average – towards higher topographic positions than expected at random, and in the 983-plot dataset also towards more acidic, less nutrient-rich soils (i.e. lower values on soil axis 1). Mean tree species tolerance was narrower than random expectation with respect to topographic position and soil axis 1 in both datasets.
Ferns tended towards lower topographic positions and less acidic, more nutrient-rich soils than expected at random (i.e. higher values on soil axis 1). They also tended towards more sloping microsites than expected at random in the 983-plot dataset, and the same pattern was almost significant in the 277-plot dataset (P = 0.05). Mean fern species tolerance was narrower than expected at random on both soil axis 1 and in relation to topographic position in the 983-plot dataset.
Melastomataceae tended towards lower topographic positions and steeper microsites than expected at random. Mean Melastomataceae tolerances were narrower than random expectation in relation to topographic position and on soil axes 1 and 3.
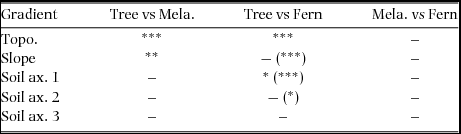
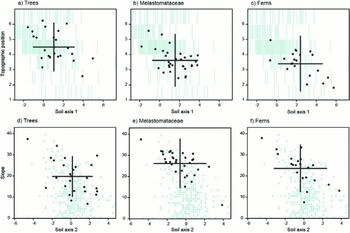
The mean optima of the two understorey plant groups did not diverge significantly from each other on any gradient. However, the mean optimum of trees was significantly higher than that of both Melastomataceae and ferns with respect to topographic position (Table 3, Figure 2). The mean optima of trees and ferns also diverged from each other on soil axis 1, whereas that of the Melastomataceae was intermediate. In relation to slope angle, the mean optimum of the Melastomataceae was significantly higher than that of trees. In the larger dataset, the mean optimum of ferns was also higher than that of trees on this gradient.
Significance tests of divergence in the mean species optima of plant group pairs (trees, Melastomataceae and ferns) on gradients in topographic position, slope angle and three soil PCA axes at La Selva Biological Station, Costa Rica. Tests on trees vs. ferns were run on both a smaller 277-plot and larger 983-plot dataset, whereas Melastomataceae data were only available for the 277-plot dataset. Results for the 983-plot dataset are reported in parentheses, where they differed from those for the 277-plot dataset. All species occurring in ten or more plots are included. See Table 1 legend for details of sample size. Statistical significance was calculated by 10000 randomizations of species occurrences among sites (– not significant, *P < 0.05, **P < 0.01, ***P < 0.001).

Calculated optima of tree (a, d), Melastomataceae (b, e) and fern (c, f) species on four environmental gradients at La Selva Biological Station, Costa Rica. Optima in relation to topographic position (ranging from 1= riparian to 6 = ridge top) and soil PCA axis 1 (a–c). Optima in relation to slope angle (range 0–43°) and soil PCA axis 2 (d–f). Optima in relation to soil PCA axis 3 are not illustrated since plant group means did not differ significantly either from random expectation or among taxa on this gradient. Optima are superimposed on a two-dimensional histogram of plot densities in the sampled environmental space drawn using the R package gplots v. 2.11.0. Optima were calculated based on species occurrences in 277 sample plots. Equivalent results for trees and ferns in a larger dataset (983 plots) are in Appendix 3. Crosses indicate the positions of the mean species optima of each plant group on the two environmental gradients in each panel. The lengths of the lines forming the crosses represent mean species tolerances on these gradients. Optima and tolerances were calculated with inverse-weighting to account for uneven plot densities on each environmental gradient.

DISCUSSION
Prevalence of habitat specialization
Non-random patterns of microsite occupancy were detected in all three plant groups in relation to both topographic and soil gradients. However, these were clearly more prevalent in the two understorey groups, Melastomataceae and ferns, than in trees. Hence, our results appear to conform to our first hypothesis that small understorey plants are more frequently soil and topographic specialists than are larger trees. However, the proportion of habitat specialists in trees might have been underestimated for two reasons. Firstly, because the soil data were collected somewhat closer in time to the understorey inventories than the tree inventories, and secondly, because average occurrence frequencies in trees were lower, which reduces statistical power, and hence our ability to detect non-random patterns of site occupancy (Jones et al. Reference JONES, TUOMISTO and OLIVAS2008). If lower tree species densities were the main driver of lower apparent habitat specialization in trees, however, then the frequency of habitat specialists should have been consistently higher in the larger than in the smaller dataset, whereas we saw variable patterns among taxa and gradients. The overall frequencies of habitat specialization detected in trees were similar in the two datasets (57% and 58% for the larger and smaller datasets, respectively).
Our best estimate of the prevalence of topographic or soil microhabitat specialization in trees (57% of species) exceeds an earlier estimate (30%) in the same study area (Clark et al. Reference CLARK, PALMER and CLARK1999). This difference may be partly explained by the fact that Clark et al. (Reference CLARK, PALMER and CLARK1999) included rarer species in their analyses than we did. Furthermore, rather than testing for associations with soil variables that are directly relevant for plants, they used five categorical soil types with partly overlapping soil nutrient concentrations. Reported frequencies of tree species with significant topographic or soil habitat associations at similar spatial scales in other tropical forests have ranged widely, from c. 20% to 80% (Chuyong et al. Reference CHUYONG, KENFACK, HARMS, THOMAS, CONDIT and COMITA2011, Comita et al. Reference COMITA, CONDIT and HUBBELL2007, Gunatilleke et al. Reference GUNATILLEKE, GUNATILLEKE, ESUFALI, HARMS, ASHTON, BURSLEM and ASHTON2006, Harms et al. 2000, John et al. Reference JOHN, DALLING, HARMS, YAVITT, STALLARD, MIRABELLO, HUBBELL, VALENCIA, NAVARRETE, VALLEJO and FOSTER2007, Webb & Peart Reference WEBB and PEART2000).
Interspecific habitat differentiation within plant groups
The three plant groups differed in their degree of interspecific environmental differentiation, as indicated by the dispersion of species’ environmental optima. Ferns showed significant partitioning of the available environmental space, especially in terms of topography. Tree species optima were also over-dispersed in relation to topographic position, but the dispersion of optima did not differ from random expectation in the Melastomataceae on any gradient. This implies that in the Melastomataceae, in particular, many species are ecologically similar, at least in relation to their soil and topographic distributions, although they are not habitat generalists. These findings do not hence conform to our second hypothesis of greater interspecific habitat differentiation in understorey plants than in trees. Patterns may instead be taxon-specific. At the landscape level, our results imply that fern diversity is probably promoted by interspecific niche differences to a greater extent than is diversity in the other two plant groups.
Differences between trees and understorey plants
Tree species occurrence distributions diverged significantly from those of one or both of the two understorey plant groups on several of the gradients tested, whereas patterns in the understorey were more congruent. Tree distributions tended towards mid-slope positions in the landscape, and their mean tolerances were also narrower than expected at random on this gradient. This suggests that many tree species have higher establishment and/or survival probabilities on mid-slopes than on ridges or in valleys. Indeed, tree stem densities are generally higher on slopes than in flat areas at La Selva (Clark & Clark Reference CLARK and CLARK2000), and Palmer et al. (Reference PALMER, CLARK and CLARK2000) showed that tree stem density and species richness are highly correlated in these small plots. The apparent environmental favourability of mid-slopes for trees may be explained by a combination of their reduced risk of drought relative to ridge tops (Comita & Engelbrecht Reference COMITA and ENGELBRECHT2009, Reference COMITA, ENGELBRECHT, Coomes, Burslem and Simonson2014), reduced risk of water-logging relative to valley bottoms, better light penetration into the understorey, and more frequent disturbance due to tree falls, relative to flat areas (Clark et al. Reference CLARK, CLARK, RICH, WEISS and OBERBAUER1996).
In contrast, species distributions in both understorey plant groups were biased, on average, towards lower slopes. Hence our results conform to our third hypothesis of divergence in the topographic distributions of trees and understorey plants. The difference between trees and ferns was especially pronounced. Since soil and air humidity are generally higher in low-lying areas, we speculate that this pattern might reflect greater drought-sensitivity in these understorey plant groups, and especially in herbaceous ferns, than in larger trees. Murphy et al. (Reference MURPHY, SALPETER and COMITA2016) similarly found herb species richness to peak in swamp habitat on Barro Colorado Island in Panama, whereas the richness of both woody tree and liana seedlings generally peaked on slopes. Furthermore, an irrigation study in Panama indicated that drought sensitivity tends to be greatest in terrestrial herbs, intermediate in understorey shrubs, and lowest in trees (Wright Reference WRIGHT1992). If this is indeed the case, it may imply differences in the responses of these broad life-form categories to future changes in rainfall (IPCC 2014).
The fact that soils in our study site are, on average, less acidic and more nutrient-rich at lower than at higher topographic positions may also contribute to topographic sorting. Indeed, mean tree and fern optima also diverged significantly on the main soil nutrient gradient. However, that of the Melastomataceae was intermediate. For ferns and Melastomataceae this pattern is in accordance with the general observation that the species richness of Melastomataceae appears to peak at lower soil cation concentrations than that of ferns in western Amazonia (Tuomisto & Ruokolainen Reference TUOMISTO and RUOKOLAINEN2005, Tuomisto et al. Reference TUOMISTO, RUOKOLAINEN, POULSEN, MORAN, QUINTANA, CAÑAS and CELI2002, Reference TUOMISTO, ZUQUIM and CÁRDENAS2014).
Finally, both ferns and the Melastomataceae tended towards significantly steeper microsites than expected at random, whereas patterns in trees did not differ from random expectation. Similar patterns have been detected in ferns and in some other herbaceous understorey plant groups in earlier studies (Costa Reference COSTA2006, Jones et al. Reference JONES, CICUZZA, VAN STRAATEN, VELDKAMP and KESSLER2014, Poulsen et al. Reference POULSEN, TUOMISTO and BALSLEV2006, Rodrigues & Costa Reference RODRIGUES and COSTA2012). This might represent avoidance of the most poorly drained sites at lower topographic position, but it could also be related to other factors. There is, for example, evidence that the establishment success of small-seeded plant species and spore-producing ferns is negatively related to leaf litter depth, and litter accumulation is likely to be lower on slopes relative to flat sites (Metcalfe et al. Reference METCALFE, GRUBB and TURNER1998, Molofsky & Augspurger Reference MOLOFSKY and AUGSPURGER1992, Rodrigues & Costa Reference RODRIGUES and COSTA2012). Metcalfe & Grubb (Reference METCALFE and GRUBB1995) found a general tendency for seed size to be related to adult plant stature in shade-tolerant rain-forest plants, being smaller on average in shrubs and herbs than in trees.
In summary, our results indicate that habitat specialization is prevalent in all three plant groups, but that understorey taxa, and perhaps particularly herbaceous species, may respond differently to local topographic and soil gradients than trees do. Murphy et al. (Reference MURPHY, SALPETER and COMITA2016) similarly concluded that the species richness and composition of herbs and woody plant seedlings are structured by contrasting mechanisms, and that habitat partitioning is stronger in herbs, at a local scale in Panama. We propose that differences in species’ sensitivity to microsite hydrology may be a significant driver of differences in topographic sorting between trees and the two understorey plant groups studied here. We also suggest that congruence in the microhabitat distributions of our chosen understorey plant taxa, ferns and the Melastomataceae, can probably be extrapolated to other understorey groups as well, in part because these are distantly related plant groups, with a different life cycle and reproductive biology. Furthermore, Jones et al. (Reference JONES, CICUZZA, VAN STRAATEN, VELDKAMP and KESSLER2014) compared the soil and topographic species optima of all fern vs. angiosperm herbs in two Indonesian forests using parallel methods to ours, and found them to be similar. Our intention is not to imply that all understorey plant taxa will do best under the same set of local environmental conditions. Indeed, as noted here in the ferns in particular, marked interspecific ecological differentiation may exist even in taxa that tend, on average, towards particular habitats. Nonetheless, there may be a general tendency for understorey species diversity to peak in lower-lying and more humid microsites, at least in areas that experience periodic drought. However, comparative studies of a variety of plant life forms, including information on their hydraulic architecture and direct measurements of soil water availability, are needed to further test this idea.
ACKNOWLEDGEMENTS
We thank David B. Clark and Deborah A. Clark for kindly allowing us to use the La Selva tree and soil datasets, gathered with support from the Andrew W. Mellon Foundation. We also acknowledge staff of the Organization for Tropical Studies (OTS) and La Selva Biological Station for logistic support and Paulo Olivas and Rigoberto Gonzalez for their hard work during the understorey plant inventories. The study was funded by grants from the Academy of Finland to M. Jones, K. Ruokolainen and H. Tuomisto, from the Jenny and Antti Wihuri Foundation and Oskar Öflunds Stiftelse to M. Jones, and from OTS to N. Llerena. Research permits were granted by MINAE in Costa Rica.
Mean±SD and range (in parentheses) of values for gradients in topographic position (ordered categories 1–6), slope angle (degrees) and soil PCA axes 1–3 in 277 and 983 sampling plots at La Selva Biological Station, Costa Rica.

Tree, Melastomataceae and fern species for which evidence of habitat specialization on gradients in topographic position, slope angle and soil chemistry (PCA axes 1–3) was detected in old-growth rain-forest plots at La Selva Biological Station, Costa Rica. Tree and fern species distributions were analysed across 983-plots (upper row) and a 277-plot subset (lower row). Melastomataceae data were available for the 277-plot dataset alone. Habitat specialization was defined as either species optima (O) significantly different from random expectation, species tolerances (T) significantly narrower than random expectation, or both. Optima and tolerances are corrected for uneven environmental sampling. Tests were run on all species encountered in ≥ 10 plots (trees: n = 72 species in the larger dataset, n = 26 species in the smaller dataset, Melastomataceae: n = 32 species in the smaller dataset, ferns: n =31 species in the larger dataset, n = 21 species in the smaller dataset). Those species are listed for which we found significant evidence of habitat specialization on at least one gradient. Statistical significance was calculated by comparing observed optimum and tolerance values with those obtained after 10000 spatially restricted randomizations of species occurrences among sites (*** P < 0.001, ** P < 0.01, * P < 0.05). Species nomenclature follows that in the Tropicos database (tropicos.org).

Calculated optima of tree (a, c) and fern (b, d) species on four environmental gradients at La Selva Biological Station, Costa Rica. Optima in relation to topographic position (ranging from 1= riparian to 6 = ridge top) and soil PCA axis 1 (a, b). Optima in relation to slope angle (range 0–43°) and soil PCA axis 2 (c, d). Optima are superimposed on two-dimensional histograms of plot densities in the sampled environmental space drawn using the R package gplots v. 2.11.0. Optima were calculated based on species occurrences in 983 sample plots. Crosses indicate the positions of the mean species optima of each plant group on the two environmental gradients in each panel. The lengths of the lines forming the crosses represent mean species tolerances on these gradients. Optima and tolerances were calculated with inverse-weighting to account for uneven plot densities on each environmental gradient.