I. INTRODUCTION
Understanding the distribution of inorganic matter in coal is a significant part of coal analysis, contributing important information on the suitability of coal deposits for various industrial purposes. Some elements, such as Na, Ca, K, and Fe, for example, may contribute to lower fusion temperatures of coal ash, leading to build-up of slags, and other deposits in combustion applications (Bryers, Reference Bryers1996; Creelman et al., Reference Creelman, Ward, Schumacher and Juniper2013). The inorganic chemistry of coal-seam cores has traditionally been determined from bulk-sampling operations (Standards Australia, 1993), with length-based portions of the core being ashed and analysed using techniques such as wavelength- and energy-dispersive X-ray fluorescence (WD-XRF and ED-XRF, respectively) spectrometry and/or inductively coupled plasma (ICP) methods. These techniques provide low limits of detection and high levels of precision. As the mineral matter within a coal seam is not evenly distributed (Ward, Reference Ward2002; Golab et al., Reference Golab, Ward, Permana, Lennox and Botha2013), a trade-off is necessary between the length of the core segments sampled and the spatial resolution required to evaluate the distribution of the inorganic components. Sampled segments for coal seams may range from about 10 cm to over 1 m in length.
Recent developments in instrumentation mean that the analysis of drill cores can be performed rapidly at sub-millimetre scales using core scanners equipped with ED-XRF spectrometers. Such scanners enable evaluation of the distribution of different inorganic components within the core at significantly greater spatial resolution than bulk sampling and analysis. Scanning can be carried out in conjunction with high-resolution optical imaging and X-radiography, with split or whole cores being analysed directly by the instrument after drilling.
Measurement of rough and/or fractured surfaces may provide some difficulties, since the irradiated surface-area will change at each measurement along the core. Changes in the distance between the sample surface and the X-ray detector may also result in variable air-attenuation of the fluorescent X-rays, and changes in the matrix will affect the fluorescence response. These issues may lead to artefacts that mask the actual concentration changes along a core. Some core scanners automatically adjust the detector height to minimize variations during the scan. The problem of roughness can be further minimized if scanning is carried out on a completely flat surface, i.e. if the core is carefully cut down its length in a way that avoids fracturing and crumbling. This is, however, not always possible in industrial situations, partly because of the brittle nature of coal and partly because of the need to keep open the options for more conventional sampling and analysis programs. Tube-to-sample distance will also affect the X-ray flux reaching the sample.
Another issue for coal analysis is the challenge associated with ED-XRF analysis of light elements at low concentrations (typically <3 wt%) in an organic-rich matrix. Analysis of the coal ash based on fused borosilicate discs and WD-XRF techniques is typically preferred for inorganic-element determination in coal samples (Standards Australia, 1999). The present paper describes the development of a calibration for use with the Itrax Core Scanner (Cox Analytical, Sweden) on whole cores of coal-seam sections, without the need for sample preparation. A range of certified reference materials (CRMs) and secondary standards were analysed, and a calibration for use on drill cores developed and tested. The effectiveness of this calibration is discussed. The impacts of sample curvature and roughness upon results were also investigated, and evaluated in the light of the need to analyse whole coal-cores for geological purposes.
II. THE ITRAX CORE SCANNER
The Itrax Core Scanner is able to carry out a combination of ED-XRF spectroscopy, high-resolution optical imaging, X-radiography, and magnetic-susceptibility analysis along the longitudinal axis of a cylindrical drill core. The sample compartment can hold cores up to 1.75 m in length and 100 mm in diameter, sliding the core under the instrument package in the body of the unit. The ED-XRF spectroscopy system potentially allows analysis of elements from Mg through to U, with a minimum step size of 100 μm. The highest possible resolution for the associated X-ray image is 20 μm. Measurements are conducted in air and the XRF detector moves to maintain a constant distance between the sample surface and the detector along the sample length, based on a sample-height profile collected prior to analysis. The analytical exposure/dwell time at each step can be selected by the operator, with a minimum time of 1 s per step.
More detailed descriptions of the instrument are given by Croudace et al. (Reference Croudace, Rindby, Rothwell and Rothwell2006) and Croudace and Rothwell (Reference Croudace and Rothwell2010). The instrument is most commonly used to analyse sediment cores, typically wet and split longitudinally, with minimal to no sample preparation required. However, the scanner has also been applied to other materials as diverse as wood for dendrochronology (Gunnarson et al., Reference Gunnarson, Linderholm and Moberg2011) and oxide thin films (Nilsen et al., Reference Nilsen, Fjellvåg and Kjekshus2003).
III. MATERIALS AND METHODS
A. Samples and preparation
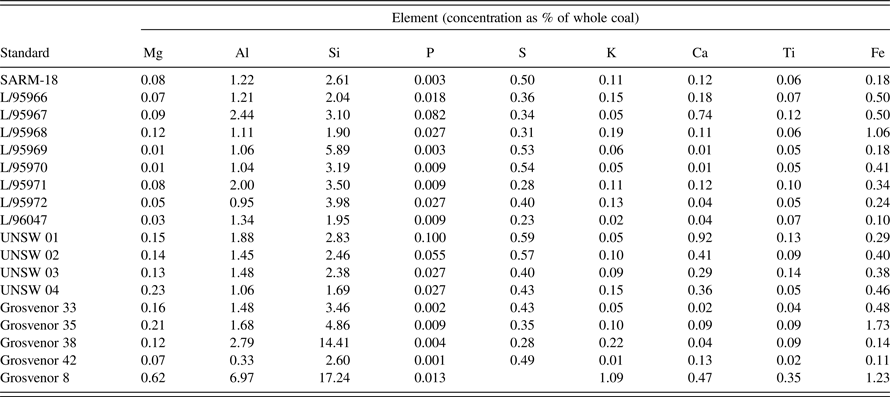
A calibration was developed for the principal major elements represented in the inorganic material of bituminous coals (Al, Si, P, S, K, Ca, Ti, and Fe), based on pressed pellets of independently-analysed reference coals, including the South African coal standard SARM-18 (Ring and Hansen, Reference Ring and Hansen1984), as well as a range of secondary standards. The secondary standards included a series prepared and extensively analysed by CSIRO Energy Technology, Australia (L-series), plus coal samples from several other sources prepared and analysed in the XRF Laboratory, Mark Wainwright Analytical Centre, University of New South Wales (Table I).
Geochemical data for calibration coal samples determined by WDXRF, expressed as a percentage of whole coal, taking into account dilution by wax.

Except for SARM-18 and the L-series coals, which were already powdered, the reference coals were ground in a tungsten carbide ring-grinder mill. Subsamples (~12–20 g) of each coal were ashed at 815 °C for a minimum of 8 h, except SARM-18, for which published concentration values were already available. The ash produced from each sample was fused into a 40 mm diameter glass bead at 1,050 °C for 15 min, using a ratio of sample to lithium borate flux (Type 12:22) of 1:10, for analysis of major elements by WD-XRF spectrometry. Powdered subsamples of the coals, except for SARM-18, were also pressed into 40 mm diameter aluminium caps at a pressure of 20 ton, with Ceridust (wax) as a binder in a ratio of sample to wax of 10:1. SARM-18 had previously been pressed into a pellet using a sample-to-wax ratio of 9:1 under the same pressure conditions. Although pellets for the Itrax calibration could have been prepared without wax, wax pellets were less fragile for further analysis in traditional laboratory WD-XRF spectrometers under vacuum. Another sample, coal standard CMT-CRM001 [South African Bureau of Standards, Coal and Mineral Technologies (Pty) Ltd], was pressed into pellets 40 and 50 mm in diameter and used to compare the results obtained by the core scanner from rounded and flat surfaces of the same coal material, as well as the effects of surface roughness on the chemical profiles. This was done by scanning the flat surfaces and the pellet edges for the former and scratched surfaces for the latter.
B. Chemical analysis of calibration samples
The element concentrations in the secondary standards were determined by WD-XRF analysis of fused beads of the respective coal ashes using a Philips PW2400 WD-XRF spectrometer, fitted with an Rh anode and operated using PANalytical SuperQ software. The PANalytical WROXI (wide-ranging oxides) calibration was used to determine the element-oxide concentrations (wt%), which were then back calculated and expressed as element percentages of the whole coal. S concentrations were determined by analysing approximately 0.1 g of each powdered whole coal using a LECO TruSpec Sulfur Module. Analysis of a reference coal supplied by Standards Australia (ASCRM-009) was used to cross-check the (total) S content obtained.
C. Data collection and calibration
Profiles across the flat surface of each reference coal-pellet were obtained using the Itrax Core Scanner. The Itrax was fitted with a 1.8 kW Cr tube, operating at 30 kV and 30 mA. The pellets were analysed with an exposure time of 15 s per step, in air and with a 200 μm step size. The analytical area of each measurement was 8 mm × 100 μm. Cox CoreScanner software (v8.6.3) was used to operate the instrument and Q-spec (v8.6.0) was used for spectra fitting, deconvolution and determination of peak areas. The peak areas for each element and the Compton scatter from each step in the analysis of each pellet were averaged. The average element peak areas were divided by the average Compton scatter peak area to achieve a Compton ratio correction, which was then plotted against the concentration values of the standards (taking into account the wax dilution, as unprepared coals were the intended unknown samples). Regression lines were calculated based on a variable y-intercept. Some outliers were excluded from the calibration, resulting in the concentration ranges in Table II.
Concentration ranges for calibration by element, expressed as percentages of whole coal.

The analysis of ASCRM-009 as a pressed pellet (without wax) using the Itrax Core Scanner was carried out as a check of the calibration. Profiles to visualize the data corresponding to sample-surface experiments were also created using ItraxPlot (v2.68). The black and white X-radiograph image of a pressed pellet that had been scratched to test the effect of core roughness was processed using MATLAB (version R2010b, Mathworks, Massachusetts, USA, script available from the authors). Processing involved inversion of the intensity values, then maximizing contrast in a false-colour image by changing an arbitrary threshold value until the scratched regions of the sample were clearly visible.
IV. RESULTS AND DISCUSSION
Two factors concerning XRF measurements were investigated to determine their effects on “raw” peak area-based profiles and quantified results of untreated coal cores: sample surface roughness and surface curvature.
A. Sample surface-roughness
The core scanner is configured with X-rays transmitted along a capillary waveguide perpendicular to the sample surface. Prior to an XRF measurement, the instrument performs a height survey along the core, using the resulting information to program the detector to maintain a constant sample-surface to detector height. However, as the detector is mounted approximately 45° behind the zone irradiated by the X-ray source (relative to the motion of the sample on the stage), there is the possibility of roughness generating enhancements and/or attenuations in the detector response that would not be corrected by the height-adjustment system. Ideally it may be possible to understand the relationship of roughness, at least on a sub-millimetre scale, to the instrument response and account for this by data processing, prior to application of the calibration.
To investigate the effects of roughness, a control sample was required with a known concentration of elements in coal, homogeneously distributed throughout the sample, in this case the CMT-CRM001 pressed pellet. This control pellet was roughened by scoring the surface with a number of horizontal and vertical scratches along the longitudinal axis. Figure 1 shows these features on the pellet in an optical image [Figure 1(a)] and a false-colour radiograph [Figure 1(b)] collected on the core scanner. The scratches can be seen as yellow-green areas in the radiograph.
Optical (a) and false-colour radiograph (b) images of a roughened pressed-pellet of CMT-CRM001.
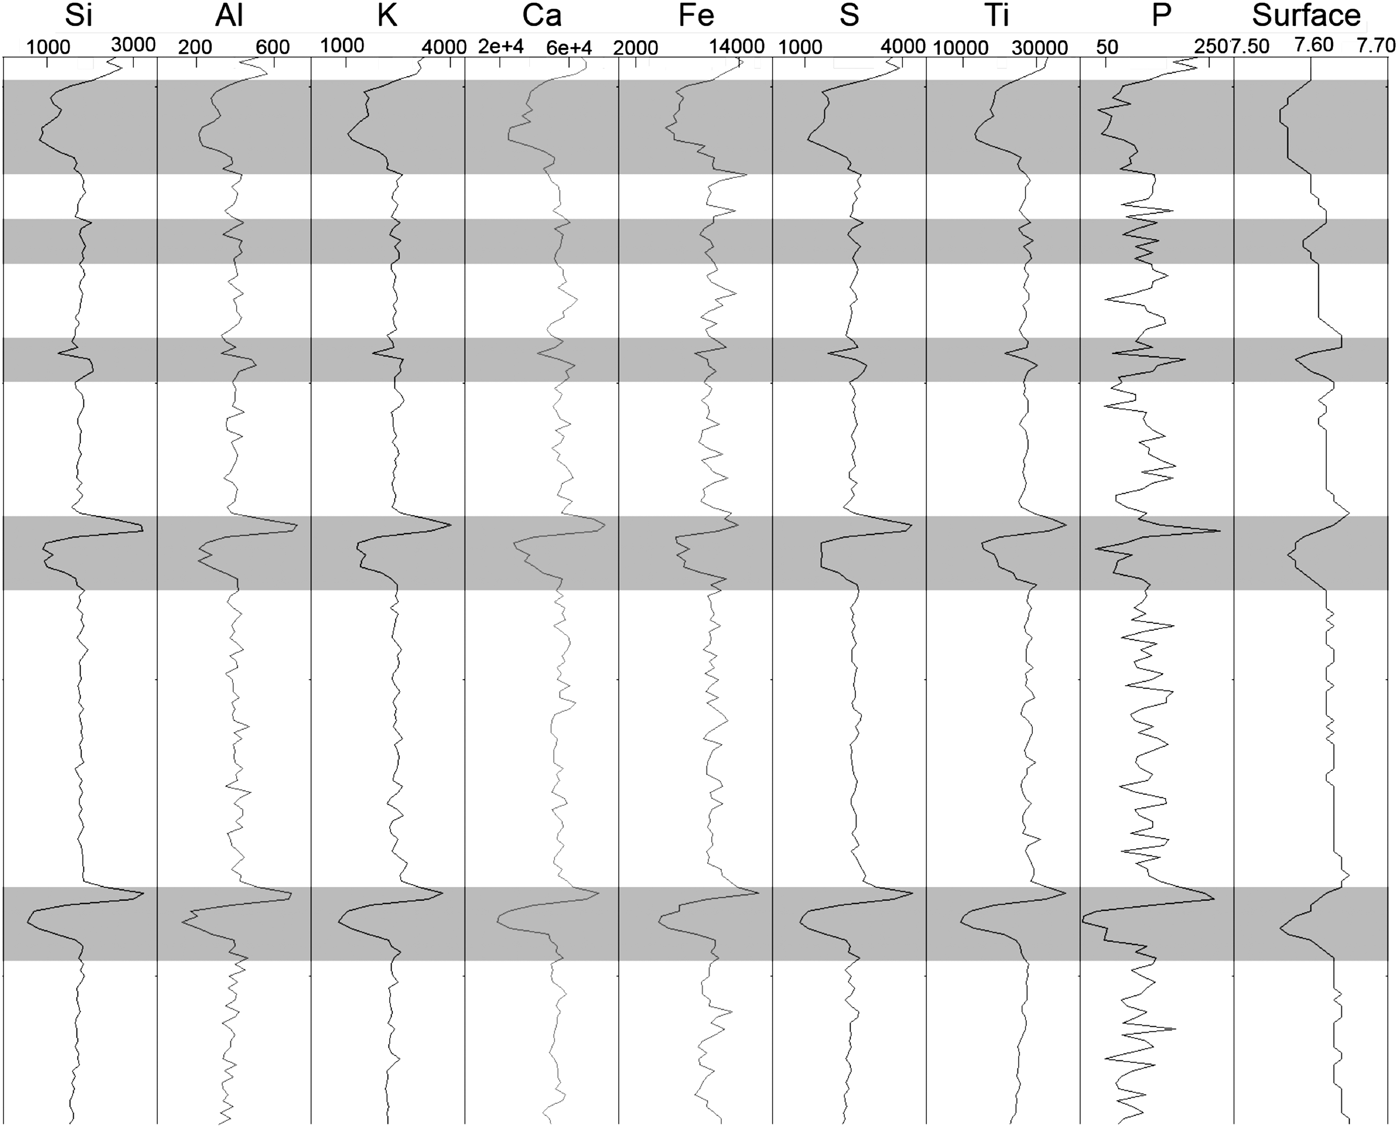
An XRF scan along the scratched pellet is shown in Figure 2. Scratches with depths of approximately 0.5 mm (or deeper) appear to have an impact on the profiles (grey shading in Figure 2), whereas shallower scratches and vertical scratches do not appear to have a noticeable impact on the profiles. For the deeper scratches, a sharp peak followed by a trough was noted across the scratch for all elements. Such a profile may thus represent one way to differentiate changes in profiles owing to cracks from changes because of compositional differences.
Element profiles (peak areas) and sample-surface profile (cm) for a scratched pressed-pellet (CMT-CRM001). Scratched intervals are highlighted in grey.
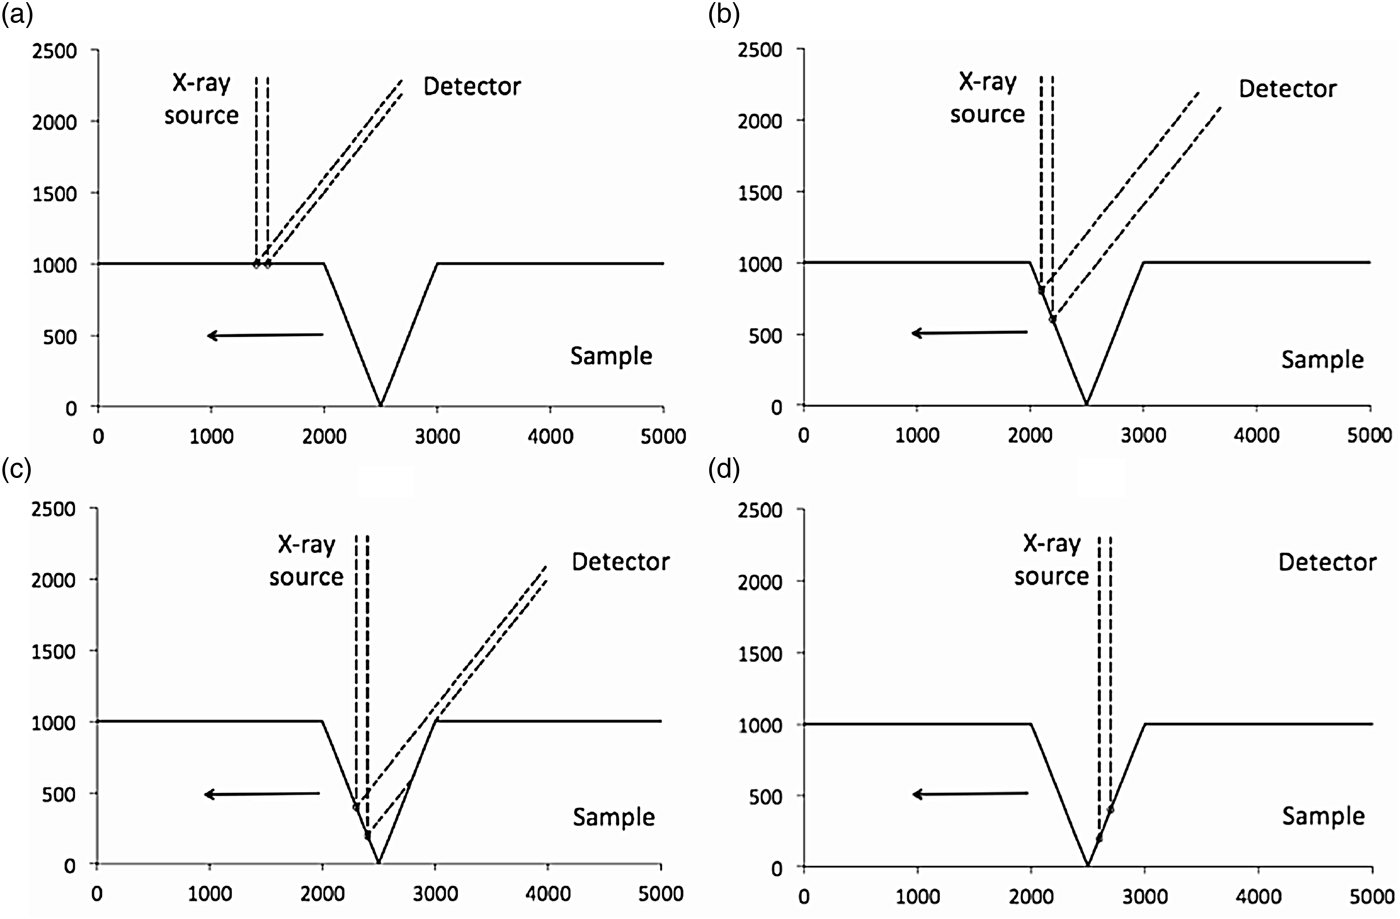
There are three scenarios on a roughened surface that could possibly give rise to the measurement artefacts observed in Figure 2. These are illustrated in Figure 3, which shows an idealized one-dimensional surface irradiated with a primary X-ray beam of width 100 μm that is perpendicular to the surface. The figure demonstrates the influence of the surface topography on the secondary X-ray beam that reaches the detector. Figure 3(a) shows measurement of a flat surface, followed by measurement of the leading face of a V-shaped fissure [Figure 3(b)]. The result is an increase in the length of surface irradiated by the primary X-ray beam, represented in this figure as a wider beam approaching the detector. In Figure 3(c), the primary X-ray beam has travelled down the leading face of the fissure, and the trailing face has attenuated the secondary beam. Near the bottom and travelling up the trailing face, the secondary beam is entirely eclipsed [Figure 3(d)].
Scenarios that could arise from the geometry of the Itrax Core Scanner measuring an idealized sample with a V-shaped 1,000 μm fissure. All axis units are μm and the arrow in each figure indicates the direction of sample motion on the stage: (a) 100 μm primary X-ray beam irradiates a flat surface at 90° and a proportion of the secondary X-rays propagate towards the detector mounted at 45° behind the sample; (b) X-ray source irradiates the leading face of the fissure; (c) shadowing of the secondary beam by the trailing face; and (d) eclipsing of the beam by the trailing face of the fissure.
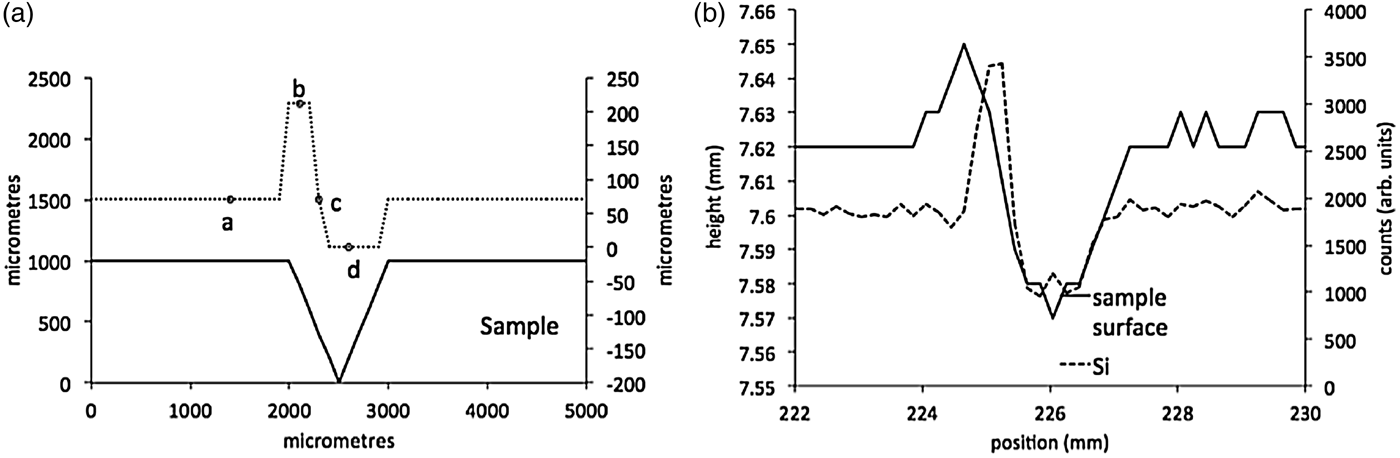
This “shadowing” effect of the secondary fluorescence appears to match the behaviour of the experimental data. Figure 4(a) shows the influence on the secondary X-ray beam width observed at the detector, calculated in 100 μm steps along the idealized surface. The points marked a–d correspond to the different scenarios shown in Figure 3. The beam width in Figure 4(a) shows an initial increase (irradiation of the leading edge of the fissure), that corresponds to an initial increase in the Si counts in the measured data in Figure 4(b), and supports the hypothesis that this shadowing effect is contributing to measurement artefacts on the coal surface.
(a) Secondary beam width calculated at 100 μm steps along the idealized sample-surface shown in Figure 3, and (b) Si counts and height profile across a scratched region of the CMT-CRM001 pellet.
Observations suggest that most element concentrations are affected similarly by roughness on the surface and hence there may be a correction process that can be universally applied to all elements. However, this correction is non-trivial, requiring an algorithm to identify which of the four, highly idealized, scenarios in Figure 3 is applicable at each point on the surface. An imperfect, but more readily applied solution is to use the surface height data to filter the element counts prior to applying a calibration.
Figure 5 shows an example of this filtering process applied to the Si data collected from the scratched CMT-CRM001 pellet, where the true Si counts should be constant across the pellet. The shadowing phenomenon requires that the height data be offset to the left by 0.2 mm to better cover the outlier points in the raw Si data. A linear trendline from the surface-height data is then adjusted (lower) and those Si outlier points removed at the positions where the sample-surface data lies below the threshold. The procedure is amenable to automation, although some outlier points remain and it is not yet clear over what range of height change this would be applicable. Nevertheless this filtering process would remove roughness artefacts to reveal true concentration changes along a core surface and is the focus of continued work by the authors.
Filtering of roughness artefacts from Si-count data on the scratched CMT-CRM001 pellet.
B. Comparison of flat and rounded surfaces
A comparison of the values obtained from the flat and rounded surfaces of the pressed-pellet samples is presented in Table III. The data for the rounded surfaces were obtained by scanning the edges of pressed pellets, 40 and 50 mm in diameter. Little difference was observed between the flat-face and curved-surface data for most elements, particularly P, S, K, Ca, and Ti. Potential increases in elemental concentrations with decreasing diameter are theoretically possible, as more of the sample is encompassed within the analytical area, however, the relationship of curvature to irradiated-surface area shows that the effect is expected to be relatively small, and a typical coal core 50 mm in diameter would show differences less than those owing to roughness of the sample. Calculation of the irradiated area of a perfectly smooth curved-core surface with a diameter of 40 mm versus a flat surface indicated that the irradiated area of the curved core is <1% greater than the flat surface.
Chemical results for CMT-CRM001 obtained on flat and rounded surfaces of pressed pellets with diameters of 50 and 40 mm.
In conventional laboratory-based XRF spectrometers the detector–sample distance is fixed, and curved beads or pellets lead to an increase in fluorescent X-rays reaching the detector and hence, an increase in measured concentration. The Itrax Core Scanner can adjust for changes in the sample-to-detector distance by performing a height survey along the core prior to an XRF measurement and using the resulting information to program the detector to maintain a constant sample surface-to-detector height. In the case of whole cores, the sample-surface height profile taken before analysis would ideally be based on the highest point in the curved profile of the core. This means that the distance from the detector to the centre of the analytical area would be the same as a flat surface, but that the sides of the scanned area would be farther away from the detector. The values obtained from such curved surfaces would, moreover, also be affected if the X-ray beam was not centred on the highest point of the core. Other factors would also have an effect, such as surface roughness with respect to the height profile, and tube-to-sample distance with respect to the X-ray flux reaching the sample, which is fixed in conventional laboratory-based spectrometers and is not adjusted during analysis using the Itrax Core Scanner. This suggests that, although higher concentrations may be observed when analysing curved beads in traditional XRF spectrometers, other factors also need to be taken into account when using the Itrax, such as increased attenuation of fluorescent X-rays coming from the sides of the analytical area. Table III shows that concentration differences were generally within the expected precision of the calibration, which is discussed more fully below.
C. Development of calibration curves
The calibration curves derived from the pressed-pellet samples are presented in Figure 6. The plot for P shows a greater degree of scatter compared with those of the other elements because it occurs at low concentrations in the coal and is close to the calibration detection-limit. Data for ASCRM-009, used as a check on the coal calibration based on the other pressed powders, are given in Table IV.
Calibration curves, with concentrations expressed as percentages of whole coal.
Chemical results for ASCRM-009 obtained using the Itrax compared with published concentrations, expressed as a percentage of whole coal, and relative errors, and relative standard deviations. n=number of measurements.
The results for ASCRM-009 and the relative errors (REs) based on comparisons to published values for ASCRM-009 for each element are given in Table IV. Two elements (Ca and Ti) have REs of 5% or better, whereas Al, Si, S, K, and Fe have REs of 15% or better. P has a RE of 60%. The relative standard deviations (RSDs) based on 76 measurements of ASCRM-009 are also given in Table IV, with all elements below 6%, except P (100%) and Ca (17%). The poor precision for P is due to its presence close to the limit of detection. Both the REs and RSDs indicate that the calibration, although not fully quantitative across the range of elements, has the potential to provide useful information on the inorganic composition of coals scanned using the Itrax instrument.
V. CONCLUSIONS
The calibration check using ASCRM-009 shows that the calibration developed in the present study is capable of providing at least semi-quantitative results for determination of major inorganic elements in coal, and thus the Itrax (or similar scanners) could represent an alternative to traditional bulk-sampling techniques to understand the distribution of inorganic matter in coal seams. The comparison of rounded versus flat surfaces indicates that the XRF results obtained from these surfaces are similar, and in the present study were within the range of the relative standard deviations. The overall trend for each element along the core is more significantly altered by the presence of cracks, pits, and similar sample-surface variations. Fluctuations in element profiles because of cracks can potentially be identified and filtered out by identifying peak-and-trough trends for all elements, in combination with comparison of the elemental profiles to the optical and radiographic images and the sample-surface profiles. Further investigations into the use of the Itrax scanner on cores from coal-exploration programs, based on the findings of the present study, are discussed in a separate work by Kelloway et al. (Reference Kelloway, Ward, Marjo, Wainwright and Cohen2014).
ACKNOWLEDGEMENTS
The assistance of CSIRO Energy Technology, especially Dr. David French, for provision of coal samples to assist the calibration process is gratefully acknowledged.