
1. Introduction
Gas–particle suspensions are widespread in nature and industrial applications. Examples of the former include snowstorms, sandstorms and pyroclastic flows. Typical examples of the latter are fluidized-bed operations for the classification of particles, olefin polymerization and co-gasification of coal and biomass. In general, the particles contained in these suspensions are polydisperse, which, under the gas–particle drag force and the gravity force, gives rise to relative velocities between particles of different types. For brevity, the relative velocity refers to the velocity difference of different particle types if not otherwise specified. In dense suspensions, the collision frequency between different particle types is high, and the relative velocity is significantly reduced by collisions. The relative velocity is the key characteristic of the segregation phenomenon (Beetstra, van der Hoef & Kuipers Reference Beetstra, van der Hoef and Kuipers2007; Mehrabadi, Tenneti & Subramaniam Reference Mehrabadi, Tenneti and Subramaniam2016; Mehrabadi & Subramaniam Reference Mehrabadi and Subramaniam2017). Segregation is desired in the classification of particles, but should be avoided in the process where various particle types need to be well mixed, such as olefin polymerization and co-gasification of coal and biomass. In the literature, the multi-fluid model (MFM) (Iddir & Arastoopour Reference Iddir and Arastoopour2005; Chao et al. Reference Chao, Wang, Jakobsen, Fernandino and Jakobsen2011; Zhao & Wang Reference Zhao and Wang2021), in which the gas and the particles are treated as interpenetrating continuous phases, is one of the most prevalent methods for studying segregation. In MFM, the transport equations of each particle type are established, and the closure relations are obtained by the kinetic theory of granular flow (KTGF) or by experiments. The gas–particle drag force and the particle–particle drag force are equally crucial to reproducing the segregation phenomenon (Mehrabadi et al. Reference Mehrabadi, Tenneti and Subramaniam2016). However, studies on the particle–particle drag force are relatively rare. Here, the particle–particle drag force is the mean collision force between different particle types per unit volume. In this paper, the particle–particle drag force is studied by a set of fully resolved methods. The gas flow is resolved to a much smaller scale than the smallest particle diameter, the motion of each particle is tracked by the discrete element method (DEM), and the collisions between particles are simulated by the soft-sphere model (Tsuji, Kawaguchi & Tanaka Reference Tsuji, Kawaguchi and Tanaka1993; Zhu et al. Reference Zhu, Zhou, Yang and Yu2007; Zhou et al. Reference Zhou, Kuang, Chu and Yu2010).
In the literature, KTGF is the primary way to obtain the correlation of the particle–particle drag force. The KTGF is based on the classic kinetic theory of gases, which is exhaustively discussed in the book of Chapman & Cowling (Reference Chapman and Cowling1970). The main feature that distinguishes the KTGF from gas is the consideration of the energy dissipation in collisions (Lun et al. Reference Lun, Savage, Jeffrey and Chepurniy1984; Lun Reference Lun1991; Garzo Reference Garzo2019). Jenkins & Mancini (Reference Jenkins and Mancini1987, Reference Jenkins and Mancini1989) first extended the kinetic theory of monodisperse granular flows to binary granular flows. The proposed closure relations, including the relation of the particle–particle drag force, assume the equipartition of the kinetic energy of the peculiar motion, which indicates that the product of the granular temperature and the particle mass is the same for all particle types. Here, the peculiar motion refers to the velocity of a particle relative to the reference frame where the mean velocity of particles is zero. This assumption is strictly valid for a gas in the uniform steady state and not subjected to any external force (Chapman & Cowling Reference Chapman and Cowling1970), but maybe invalid for granular systems (Feitosa & Menon Reference Feitosa and Menon2002; Montanero & Garzo Reference Montanero and Garzo2003; Galvin, Dahl & Hrenya Reference Galvin, Dahl and Hrenya2005). For this reason, many researchers derived the closure relations of the non-equipartition energy (Iddir & Arastoopour Reference Iddir and Arastoopour2005; Songprawat & Gidaspow Reference Songprawat and Gidaspow2010; Chao et al. Reference Chao, Wang, Jakobsen, Fernandino and Jakobsen2011; Chen, Mei & Wang Reference Chen, Mei and Wang2017). To simplify the integral of the collision term, all these relations neglected or partly neglected the relative velocity between different particle types and hence may only apply to the systems where the relative velocity is small compared with the peculiar velocity (Zhao & Wang Reference Zhao and Wang2020; Solsvik & Manger Reference Solsvik and Manger2021). Recently, the closure relations at the first approximation, where the single-particle velocity distribution function (VDF) is assumed Maxwellian, are rigorously derived without any mathematical simplification by Zhao & Wang (Reference Zhao and Wang2021). Therefore, their relations could apply to the full range of the relative velocity. Unlike the above works, Syamlal (Reference Syamlal1987) derived a relation for the particle–particle drag force by assuming that all particles of each particle type have the same velocity. It is worth noting that the relation proposed by Syamlal (Reference Syamlal1987) is the only particle–particle drag relation that includes the contribution from interparticle friction. Although the mathematical method for the derivation of the particle–particle drag force becomes more and more refined, a priori analysis of the obtained relations is still lacking. To the authors’ knowledge, only Mehrabadi et al. (Reference Mehrabadi, Tenneti and Subramaniam2016) compared the predictions of the relation proposed by Syamlal (Reference Syamlal1987) with the data of particle-resolved direct numerical simulations (PR-DNSs). They found that the relation of Syamlal (Reference Syamlal1987) seriously underestimates the particle–particle drag force due to neglecting the peculiar particle velocity. In this work, PR-DNSs of suspensions containing smooth particles are conducted, and the relation of Zhao & Wang (Reference Zhao and Wang2021) is examined and improved based on simulation results.
The lubrication force arises when the gap between two approaching particles is very small compared with the particle size and tends to infinity as the gap size decreases to zero in theory. In practice, the growth of the lubrication force is limited by the breakdown of the continuity hypothesis and other reasons. As indicated in Koch (Reference Koch1990), the fractional change in the relative velocity between two approaching particles due to the lubrication force equals  $- C/St$. Here, C is a constant of order unity for gas, and the Stokes number, defined as
 $St = d\rho {U_0}/(9\mu )$, characterizes the importance of particle inertia. In the expression of
 $St$, d,
 $\rho $,
 ${U_0}$ and
 $\mu $ represent the particle diameter, the particle mass density, the initial relative velocity between the two approaching particles and the dynamic viscosity of the fluid, respectively. When
 $St$ is comparable to C, the relative velocity decreases significantly before the collision. As a result, the particle–particle drag force is very small compared with the gas–particle drag force and hence is not important. In the present study, the Stokes number ranges from
 $40.5$ to
 $665.1$ by estimating
 ${U_0}$ with the square root of the granular temperature, and consequently the lubrication force has little effect on the particle–particle drag force. In addition, the lubrication force has an impact on the microstructure of suspensions and therefore indirectly influences the particle–particle drag force. For the low-Stokes-number suspensions, it takes a long time for the particle pairs close to each other to overcome the lubrication force and separate, which leads to an enormous value of the radial distribution function at contact. In the current range of Stokes number, the particle inertia allows a particle pair to approach and separate with a negligible effect of the lubrication force, and as a result the microstructure of the suspensions approaches that of hard-sphere fluids (Koch & Hill Reference Koch and Hill2001). We should also note that the system size of the suspensions is sufficiently small to ensure that the homogeneous state of the suspensions is stable (Koch & Sangani Reference Koch and Sangani1999; Garzo Reference Garzo2015; Fullmer & Hrenya Reference Fullmer and Hrenya2017).
The paper is structured as follows. In § 2, a brief review of the derivation of the momentum equation and the particle–particle drag relation is given. In § 3, the simulation method is explained in detail. In § 4, the particle–particle drag relation of Zhao & Wang (Reference Zhao and Wang2021) is validated against simulation results, and a new methodology is proposed. In § 5, MFM simulations are performed to verify the proposed model. In the last section, the important aspects of the present work are summarized.
2. Derivation of the momentum equation and the particle--particle drag relation
For completeness, a brief review of the derivation of the momentum equation for a particular particle type is shown as follows, and readers can refer to Garzo, Dufty & Hrenya (Reference Garzo, Dufty and Hrenya2007), Marchisio & Fox (Reference Marchisio and Fox2013) and Zhao & Wang (Reference Zhao and Wang2021) for more details. The single-particle VDF of particle type i is denoted by  ${f_i}({\boldsymbol{c}_i},\boldsymbol{r},t)$, and
 ${f_i}({\boldsymbol{c}_i},\boldsymbol{r},t)\,\textrm{d}{\boldsymbol{c}_i}\,\textrm{d}\boldsymbol{r}$ is equivalent to the probable number of particles in the velocity and position element
 $\textrm{d}{\boldsymbol{c}_i}\,\textrm{d}\boldsymbol{r}$ at time t. Similarly, the two-particle VDF is represented by
 $f_{ij}^{(2)}({\boldsymbol{c}_i},{\boldsymbol{r}_i},{\boldsymbol{c}_j},{\boldsymbol{r}_j},t)$, and
 $f_{ij}^{(2)}({\boldsymbol{c}_i},{\boldsymbol{r}_i},{\boldsymbol{c}_j},{\boldsymbol{r}_j},t)\,\textrm{d}{\boldsymbol{c}_i}\,\textrm{d}{\boldsymbol{r}_i}\,\textrm{d}{\boldsymbol{c}_j}\,\textrm{d}{\boldsymbol{r}_j}$ equals the probable number of the particle pairs in which the two particles are respectively lying in velocity and position elements
 $\textrm{d}{\boldsymbol{c}_i}\,\textrm{d}{\boldsymbol{r}_i}$ and
 $\textrm{d}{\boldsymbol{c}_j}\,\textrm{d}{\boldsymbol{r}_j}$. The spatio-temporal evolution of the single-particle VDF is described by the Boltzmann equation
 \begin{equation}\frac{{\partial {f_i}}}{{\partial t}} + {\boldsymbol{c}_i}\boldsymbol{\cdot }{\nabla _{\boldsymbol{r}}}{f_i} + {\nabla _{{\boldsymbol{c}_i}}}\boldsymbol{\cdot }({\boldsymbol{a}_i}\,{f_i}) = \frac{{{\partial _e}\,{f_i}}}{{\partial t}},\end{equation}
where  ${\nabla _{\boldsymbol{r}}}$ and
 ${\nabla _{{\boldsymbol{c}_i}}} \cdot $ are the gradient with respect to the position
 $\boldsymbol{r}$ and the divergence with respect to the velocity
 ${\boldsymbol{c}_i}$, respectively, and
 ${\boldsymbol{a}_i}$ is the acceleration of a particle of type i due to the external force, such as the gas–particle drag force. The term on the right-hand side represents the rate at which the single-particle VDF is changed by collisions and has the following form:
 \begin{align}\frac{{{\partial _e}\,{f_i}}}{{\partial t}} = \sum\limits_j {\iint_{\boldsymbol{g}\boldsymbol{\cdot }\boldsymbol{k} > 0} {\left[ {\frac{1}{{e_{ij}^2}}f_{ij}^{(2)}(\boldsymbol{c}_i^b,\boldsymbol{r},\boldsymbol{c}_j^b,\boldsymbol{r} - {d_{ij}}\boldsymbol{k},t) - f_{ij}^{(2)}({\boldsymbol{c}_i},\boldsymbol{r},{\boldsymbol{c}_j},\boldsymbol{r} + {d_{ij}}\boldsymbol{k},t)} \right]} d_{ij}^2(\boldsymbol{g}\boldsymbol{\cdot }\boldsymbol{k})\,\textrm{d}\boldsymbol{k}\,\textrm{d}{\boldsymbol{c}_j}} .\end{align}
Here,  ${e_{ij}}$ is the coefficient of restitution,
 ${d_{ij}}$ is the arithmetic mean diameter,
 $\boldsymbol{k}$ is the unit vector directed from the centre of a particle of type i to the centre of a particle of type
 $j$ and
 $\boldsymbol{g} = {\boldsymbol{c}_i} - {\boldsymbol{c}_j}$. The superscript b denotes the property before the inverse collision, and the prime will be used to indicate the property after the direct collision. The inverse collision is defined as collisions after which the pre-collision velocities
 $(\boldsymbol{c}_i^b,\boldsymbol{c}_j^b)$ are changed into
 $({\boldsymbol{c}_i},{\boldsymbol{c}_j})$, and the direct collision is defined as collisions after which the pre-collision velocities
 $({\boldsymbol{c}_i},{\boldsymbol{c}_j})$ are changed into
 $({\boldsymbol{c^{\prime}}_i},{\boldsymbol{c^{\prime}}_j})$.
Let  ${\psi _i}$ be any particle property. In general,
 ${\psi _i}$ is a function of
 ${\boldsymbol{c}_i}$ and invariable with
 $\boldsymbol{r}$ and t. The mean value of
 ${\psi _i}$, i.e. the hydrodynamic property of particle type i, is defined by
 \begin{equation}{n_i}\langle {\psi _i}\rangle = \int {{\psi _i}\,{f_i}\,\textrm{d}{\boldsymbol{c}_i}} ,\end{equation}
where  ${n_i}$ is the particle number density. Multiplying
 ${\psi _i}$ and integrating over
 ${\boldsymbol{c}_i}$ on both sides of (2.1) yields the transport equation of particle type
 $i$
 \begin{equation}\frac{{\partial {n_i}\langle {\psi _i}\rangle }}{{\partial t}} + {\nabla _{\boldsymbol{r}}}\boldsymbol{\cdot }({n_i}\langle {\psi _i}{\boldsymbol{c}_i}\rangle ) - {n_i}\langle {\boldsymbol{a}_i}\boldsymbol{\cdot }{\nabla _{{\boldsymbol{c}_i}}}{\psi _i}\rangle = {\varPsi _i}({\psi _i}).\end{equation}
Using Taylor expansion and neglecting the second-order and higher-order terms, the collision source term  ${\varPsi _i}$ can be decomposed into a collision source term
 ${\varPhi _i}$ and a collision flux term
 ${\boldsymbol{\varOmega }_i}$ as follows:
 \begin{equation}{\varPsi _i}({\psi _i}) = {\varPhi _i}({\psi _i}) - {\nabla _{\boldsymbol{r}}}\boldsymbol{\cdot }{\boldsymbol{\varOmega }_i}({\psi _i}),\end{equation}
where
 \begin{gather}{\varPhi _i}({\psi _i}) = \sum\limits_j {d_{ij}^2} \iint\!\!\!\int_{\boldsymbol{g}\boldsymbol{\cdot }\boldsymbol{k} > 0} {({{\psi ^{\prime}}_i} - {\psi _i}){\chi _{ij}}} \left( {{f_i}\,{f_j} - \frac{{{d_{ij}}}}{2}\boldsymbol{k}\boldsymbol{\cdot }{f_i}\,{f_j}{\nabla_{\boldsymbol{r}}}\ln \frac{{{f_i}}}{{{f_j}}}} \right)(\boldsymbol{g}\boldsymbol{\cdot }\boldsymbol{k})\,\textrm{d}\boldsymbol{k}\,\textrm{d}{\boldsymbol{c}_j}\,\textrm{d}{\boldsymbol{c}_i},\end{gather}
 \begin{gather}{\boldsymbol{\varOmega }_i}({\psi _i}) = \sum\limits_j {\frac{{d_{ij}^3}}{2}} \iint\!\!\!\int_{\boldsymbol{g}\boldsymbol{\cdot }\boldsymbol{k} > 0} {({{\psi ^{\prime}}_i} - {\psi _i}){\chi _{ij}}} \left( { - {f_i}\,{f_j} + \frac{{{d_{ij}}}}{2}\boldsymbol{k}\boldsymbol{\cdot }{f_i}\,{f_j}{\nabla_{\boldsymbol{r}}}\ln \frac{{{f_i}}}{{{f_j}}}} \right)\boldsymbol{k}(\boldsymbol{g}\boldsymbol{\cdot }\boldsymbol{k})\,\textrm{d}\boldsymbol{k}\,\textrm{d}{\boldsymbol{c}_j}\,\textrm{d}{\boldsymbol{c}_i}.\end{gather}
In the above equations, the correlation of the pre-collision velocities is neglected, i.e. the assumption of molecular chaos, and therefore the two-particle VDF can be written as the product of the two single-particle VDFs with the pair correlation function  ${\chi _{ij}}$. For inertial particles, the assumption of molecular chaos is valid when the total solid volume fraction is very small
 $(\phi \ll 0.1)$. The reason for this is twofold. First, the collision interval is long enough so that post-collision velocities can relax completely. Second, the particle motion is less restricted, leading to a low probability of repeated collisions. Both of these two aspects weaken the correlation between pre-collision velocities. However, for dense systems, the assumption of molecular chaos may be invalid (Chapman & Cowling Reference Chapman and Cowling1970). When
 ${\psi _i} = {m_i}{\boldsymbol{c}_i}$ where
 ${m_i}$ is the particle mass, the momentum equation for particle type i is obtained from (2.4) and (2.5) and reads
 \begin{equation}\frac{{\partial {\phi _i}{\rho _i}{\boldsymbol{u}_i}}}{{\partial t}} + {\nabla _{\boldsymbol{r}}}\boldsymbol{\cdot }({\phi _i}{\rho _i}{\boldsymbol{u}_i}{\boldsymbol{u}_i}) ={-} {\nabla _{\boldsymbol{r}}}\boldsymbol{\cdot }{\boldsymbol{\mathsf{p}}_i} + {\phi _i}{\rho _i}\langle {\boldsymbol{a}_i}\rangle + {\boldsymbol{\varPhi }_i}({m_i}{\boldsymbol{c}_i}).\end{equation}
Here,  ${\boldsymbol{u}_i} = \langle {\boldsymbol{c}_i}\rangle $, and
 ${\phi _i}{\rho _i} = {n_i}{m_i}$, where
 ${\phi _i}$ and
 ${\rho _i}$ are respectively the particle volume fraction and the particle mass density. The stress tensor
 ${\boldsymbol{\mathsf{p}}_i} = {\phi _i}{\rho _i}\langle {\boldsymbol{C}_i}{\boldsymbol{C}_i}\rangle + {\boldsymbol{\varOmega }_i}({m_i}{\boldsymbol{c}_i})$ in which the peculiar velocity
 ${\boldsymbol{C}_i} = {\boldsymbol{c}_i} - {\boldsymbol{u}_i}$.
 ${\boldsymbol{\varPhi }_i}({m_i}{\boldsymbol{c}_i})$ is the particle–particle drag force experienced by particle type i per unit volume and is the focus of the present study.
In a collision, the relation between the pre-collision velocity  ${\boldsymbol{c}_i}$ and post-collision velocity
 ${\boldsymbol{c^{\prime}}_i}$ is
 \begin{equation}{\boldsymbol{c^{\prime}}_i} = {\boldsymbol{c}_i} - \frac{{{m_j}}}{{{m_i} + {m_j}}}(1 + {e_{ij}})(\boldsymbol{g}\boldsymbol{\cdot }\boldsymbol{k})\boldsymbol{k}.\end{equation}
The present study considers the particle–particle drag force at first approximation, so the gradient terms in (2.6) and (2.7) are neglected. Substituting equation (2.9) into the equation of  ${\boldsymbol{\varPhi }_i}({m_i}{\boldsymbol{c}_i})$, the integral form of the particle–particle drag force is finally given by
 \begin{equation}{\boldsymbol{\varPhi }_i}({m_i}{\boldsymbol{c}_i}) ={-} \sum\limits_j {d_{ij}^2} \frac{{{m_i}{m_j}}}{{{m_i} + {m_j}}}(1 + {e_{ij}})\iint\!\!\!\int_{\boldsymbol{g}\boldsymbol{\cdot }\boldsymbol{k} > 0} {{\chi _{ij}}{f_i}\,{f_j}{{(\boldsymbol{g}\boldsymbol{\cdot }\boldsymbol{k})}^2}\boldsymbol{k}\,\textrm{d}\boldsymbol{k}\,\textrm{d}{\boldsymbol{c}_j}\,\textrm{d}{\boldsymbol{c}_i}} .\end{equation}
It should be noted that, due to symmetry,  ${\boldsymbol{\varPhi }_i}$ is zero when
 $i = j$, which means that only collisions between different particle types contribute to the particle–particle drag force. At the first approximation, the single-particle VDF is Maxwellian and reads
 \begin{equation}{f_i} = \frac{{{n_i}}}{{{{(2{\rm \pi} {T_i})}^{3/2}}}}\,{\textrm{e}^{ - {{({\boldsymbol{c}_i} - {\boldsymbol{u}_i})}^2}\,/(2T_i)}},\end{equation}
where  ${T_i}$ is the granular temperature and defined by
 \begin{equation}{T_i} = \frac{{\langle C_i^2\rangle }}{3}.\end{equation}
Note that the equipartition of the kinetic energy of the peculiar motion indicates  ${m_i}{T_i} = {m_j}{T_j}$. Zhao & Wang (Reference Zhao and Wang2021) rigorously derived the particle–particle drag relation from (2.10) and (2.11) without any mathematical approximations, and it is given as
 \begin{align} {\boldsymbol{\unicode{x1D4BB}}_{\!ij}} & ={-} 2{\rm \pi} d_{ij}^2\dfrac{{{m_i}{m_j}}}{{{m_i} + {m_j}}}(1 + {e_{ij}}){n_i}{n_j}({T_i} + {T_j}){\chi _{ij}}\left[ {\dfrac{1}{{\sqrt {\rm \pi} }}\left( {\dfrac{1}{2} + \dfrac{1}{{4{{\langle {g^\ast }\rangle }^2}}}} \right)\,{\textrm{e}^{ - {{\langle {g^\ast }\rangle }^2}}}} \right.\nonumber\\ & \left. \quad + \left( {\dfrac{{\langle {g^\ast }\rangle }}{2} + \dfrac{1}{{2\langle {g^\ast }\rangle }} - \dfrac{1}{{8{{\langle {g^\ast }\rangle }^3}}}} \right)erf(\langle {g^\ast }\rangle ) \right]\langle {\boldsymbol{g}^\ast }\rangle,\end{align}
in which  ${\boldsymbol{g}^\ast } = \boldsymbol{g}/\sqrt {2({T_i} + {T_j})}$ and the error function is defined by
 $erf(\langle {g^\ast }\rangle ) = (2/\sqrt {\rm \pi} )\int_0^{\langle {g^\ast }\rangle } {{\textrm{e}^{ - {y^2}}}\,\textrm{d}y}$. Notice that the summation notation is dropped in (2.13) since bidisperse mixtures are considered in this study, and
 $\boldsymbol{\unicode{x1D4BB}}_{\!ij}$ represents the particle–particle drag force on the particle type i exerted by j per unit volume. For the latter analysis, the number of collisions per time per unit volume between particle types i and j is denoted by
 ${N_{ij}}$, and
 ${N_{ij}}/{n_i}$, named the collision frequency, is the average number of collisions experienced by a particle of type i with particle type j. The relation of
 ${N_{ij}}/{n_i}$ proposed by Zhao & Wang (Reference Zhao and Wang2020) is
 \begin{equation}\frac{{{N_{ij}}}}{{{n_i}}} = \sqrt {2{\rm \pi} } d_{ij}^2{n_j}\sqrt {{T_i} + {T_j}} {\chi _{ij}}\left[ {{\textrm{e}^{ - {{\langle {g^\ast }\rangle }^2}}} + \sqrt {\rm \pi} \left( {{g^\ast } + \frac{1}{{2\langle {g^\ast }\rangle }}} \right)erf(\langle {g^\ast }\rangle )} \right].\end{equation}
When the particle distribution is homogeneous and isotropic, the pair correlation function only depends on the radial distance and degenerates into the radial distribution function. For the contact value of the radial distribution function, Lebowitz (Reference Lebowitz1964) proposed the following expression for a mixture of hard spheres:
 \begin{equation}{\chi _{ij}} = \frac{1}{{1 - \phi }} + \frac{{3{d_i}{d_j}}}{{{{(1 - \phi )}^2}({d_i} + {d_j})}}\left( {\frac{{{\phi_i}}}{{{d_i}}} + \frac{{{\phi_j}}}{{{d_j}}}} \right),\end{equation}
where the total solid volume fraction  $\phi = {\phi _i} + {\phi _j}$. Simulation results show that, in the current parameter range,
 ${\chi _{ij}}$ is invariant with respect to the Reynolds number, and the prediction error of (2.15) is less than
 $5 \%$, indicating that the microstructure of the suspensions is close to binary hard-sphere fluids. Therefore, (2.15) is employed in the calculations of the particle–particle drag force and the collision frequency.
3. Simulation method
The second-order accurate immersed boundary-lattice Boltzmann method (IB-LBM) developed by Zhou & Fan (Reference Zhou and Fan2014) is employed to solve the gas flow, and the particle motion is tracked by the DEM. The particle collision is simulated by the soft-sphere model and resolved by 8 LBM time steps, each containing 15 DEM time steps. The reader can refer to the document of MFIX (Garg et al. Reference Garg, Galvin, Li and Pannala2012) for more details. The accuracy of these methods is proved by simulating flow past arrays of rotating spheres (Zhou & Fan Reference Zhou and Fan2015a,Reference Zhou and Fanb) and gas–particle suspensions (Duan et al. Reference Duan, Zhao, Chen and Zhou2020; Zhao, Chen & Zhou Reference Zhao, Chen and Zhou2021). When the gap size between a pair of particles becomes comparable to the grid size, the flow in the gap is not fully resolved, and consequently the lubrication force cannot be correctly computed. In this situation, a theoretical formula (Guazzelli & Morris Reference Guazzelli and Morris2012) is adopted to compensate for the unresolved part of the lubrication force and is given by
 \begin{equation}\boldsymbol{F}_{ij}^l ={-} \frac{{3{\rm \pi} \mu }}{2}{\left( {\frac{{{d_i}{d_j}}}{{{d_i} + {d_j}}}} \right)^2}\frac{{(\boldsymbol{g}\boldsymbol{\cdot }\boldsymbol{k})\boldsymbol{k}}}{{|{\boldsymbol{r}_i} - {\boldsymbol{r}_j}|- {d_{ij}}}},\end{equation}
where  $\mu $ is the dynamic viscosity of the gas. The detailed implementation can be found in Nguyen & Ladd (Reference Nguyen and Ladd2002), Simeonov & Calantoni (Reference Simeonov and Calantoni2012) and Brandle de Motta et al. (Reference Brandle de Motta, Breugem, Gazanion, Estivalezes, Vincent and Climent2013)
Initially, a particle configuration, the microstructure of which is identical to that of a bidisperse hard-sphere fluid, is generated by the Monte Carlo procedure in a fully periodic cube (Hill, Koch & Ladd Reference Hill, Koch and Ladd2001), and the particle velocity is set to zero. Then, the gas and particle phases start to move freely under gravity and an upward pressure gradient. Since the particle density is larger than the gas, the particle phase accelerates downward relative to the gas phase, and therefore the slip velocity between the gas and particle phases increases. The increase rate of the slip velocity decreases because the gas–particle drag force increases with the slip velocity. Finally, the increase rate of the slip velocity is close to zero, and the slip velocity is statistically stationary. The value of the gravitational acceleration is varied so that different particle Reynolds numbers are obtained. The reported particle Reynolds number is computed after the flow reaches its statistically steady state. The pressure gradient is dynamically adjusted in simulations to keep the total volumetric flux of the flow constant (Fullmer et al. Reference Fullmer, Liu, Yin and Hrenya2017). The flow simulated in this study corresponds to sedimentation or fluidization in a fully periodic domain, depending on whether the constant is zero or not. Note that the physics should not change with the constant. The quantities of interest are first averaged over a period of simulation time after the statistically stationary state is reached and then averaged over three different initial particle configurations. For instance, the mean particle–particle drag force is computed as follows:
 \begin{equation}{\boldsymbol{\unicode{x1D4BB}}_{\!ij}} = \frac{{\sum\limits_{s = 1}^3 {\sum\limits_{k = 1}^N {\sum\limits_{m = 1}^{{N_i}} {\sum\limits_{n = 1}^{{N_j}} {\boldsymbol{F}_{im,jn}^c({t_k},s)} } } } }}{{3NV}},\end{equation}
where  $\boldsymbol{F}_{im,jn}^c({t_k},s)$ is the collision force on
 $no.\ m$ particle of type i exerted by
 $no.\ n$ particle of type j at time
 ${t_k}$ for the initial particle configuration s, where N is the number of time slices,
 ${N_i}$ and
 ${N_j}$ are, respectively, the particle numbers of type i and
 $j$ and V is the volume of the computation domain. As was always done for the gas–particle drag force,
 $\boldsymbol{\unicode{x1D4BB}}_{\!ij}$ is normalized by the Stokes drag force as follows:
 \begin{equation}F_{ij}^c = \frac{{{\boldsymbol{\unicode{x1D4BB}}_{\!ij}}\boldsymbol{\cdot }{\boldsymbol{U}_i}}}{{3{\rm \pi} \mu {d_i}U_i^2{n_i}}},\end{equation}
in which  ${\boldsymbol{U}_i}$ is the superficial gas velocity relative to particle type i, and equals
 $(1 - \phi )({\boldsymbol{u}_g} - {\boldsymbol{u}_i})$. Here,
 ${\boldsymbol{u}_g}$ is the gas velocity. It is found from simulation results that the ratio of the particle–particle drag force to the gas–particle drag force is
 $0.16$ (maximum
 $0.20$),
 $0.31$ (maximum
 $0.36$) and
 $0.37$ (maximum
 $0.42$) for
 ${d_l}/{d_s} = 1.2$,
 $1.6$ and
 $2$, respectively, which indicates that the particle–particle drag force cannot be neglected in predicting the segregation phenomenon.
The ratio of the particle mass density to the gas density is fixed at  $1000$, ensuring that the effect of the lubrication force on the particle collision is quite small in the current range of the Reynolds number. In order to keep the suspensions homogeneous and save computational costs, the edge length of the computation domain is chosen to be five times the diameter of large particles. The effect of the domain size on the particle–particle drag force is studied in Appendix A. The particle collision is assumed elastic and frictionless. The ranges of other parameters are listed in table 1. In LBM simulations, the quantities are in lattice units, and the conversion between lattice units and physical units can be readily achieved by exploiting the fact that key dimensionless numbers are the same between different systems of units. According to the law of similarity, the physics obtained from a case applies to the cases with the same geometry and key dimensionless numbers, regardless of what the values of physical quantities are. Therefore, only the critical geometry parameters and key dimensionless numbers are provided in table 1.
The parameter ranges in the present study. The subscripts s and l respectively denote small and large particles. Here,  $\phi $ is the total solid volume fraction, and
 ${x_s}$ is the ratio of the solid volume fraction of small particles to the total solid volume fraction, that is,
 ${x_s} = {\phi _s}/\phi $;
 $\langle R{e_p}\rangle $ represents the mean particle Reynold number defined based on the Sauter mean diameter
 ${\langle d\rangle _{32}}$ and the mean of the superficial relative velocity
 $\langle \boldsymbol{U}\rangle $;
 ${\langle d\rangle _{32}} = 1/(\sum\nolimits_i {{x_i}/{d_i}} )$ and
 $\langle \boldsymbol{U}\rangle = \sum\nolimits_i {{x_i}{\boldsymbol{U}_i}} $;
 $S{t_{hi}}$ is the hydrodynamic Stokes number with the expression of
 ${d_i}{\rho _i}{U_i}/(18\mu {F_{di}})$, where
 ${F_{di}}$ is the gas–particle drag force normalized by the Stokes drag force, i.e.
 $3{\rm \pi} \mu {d_i}{\boldsymbol{U}_i}$;
 $S{t_{hi}}$ is the ratio of the particle inertial response time to the flow time scale;
 $S{t_{ci}}$ is the collision Stokes number with the expression of
 $d_i^2{\rho _i}\sum\nolimits_j {{N_{ij}}/(18\mu {F_{di}}{n_i})} $, representing the ratio of the particle inertial response time to the inter-collision time. When
 ${d_l}/{d_s} = 1.2$ or
 $1.6$, only the cases of
 ${x_s} = 0.3$ are simulated.

It has been found that the relative velocity  $\langle g\rangle $, the granular temperature
 ${T_s}({T_l})$ and the particle–particle drag force
 $\unicode{x1D4BB}_{\!sl}$ are less sensitive to the grid resolution. Here, the subscripts s and l respectively denote small and large particles. For the case of
 $\phi = 0.3$ and
 $\langle R{e_p}\rangle \approx 113.5$, relative to the results at the grid resolution of
 ${d_s}/20$, the deviations of
 $\langle g\rangle $,
 ${T_s}({T_l})$ and
 $\unicode{x1D4BB}_{\!sl}$ at the grid resolution of
 ${d_s}/12$ are
 $5.7\,\textrm{%}$,
 $0.2 \%\textrm{(}1.1 \%\textrm{)}$ and
 $0.6\,\textrm{%}$, respectively, and the deviations at the grid resolution of
 ${d_s}/16$ are
 $0.8\,\textrm{%}$,
 $0.5 \%\textrm{(}1.1 \%\textrm{)}$ and
 $0.6\,\textrm{%}$, respectively. In this study, the grid size of
 ${d_s}/16$ is adopted.
4. Application of the particle--particle drag relation to bidisperse gas--particle suspensions
Figures 1(a) and 1(b) respectively show the collision frequency between small and large particles and the particle–particle drag force of small particles at various  $\langle R{e_p}\rangle $ and
 $\phi $. The volume fraction of small particles
 ${x_s}$ is around
 $0.3$, and the particle diameter ratio is
 $2$. For other cases listed in table 1, that is,
 ${x_s} = 0.1$,
 ${x_s} = 0.5$,
 ${d_l}/{d_s} = 1.2$ and
 ${d_l}/{d_s} = 1.6$, similar behaviour is found and therefore they are not shown for brevity. As the particle Reynolds number increases, the granular temperature increases. Consequently, the collision frequency and the particle–particle drag force increase. The predictions of the collision frequency by (2.14) agree well with the simulation results. However, (2.13) seriously overestimates the particle–particle drag force, especially when the total solid volume fraction is high, and its deviations at
 $\phi = 0.1$,
 $0.2$ and
 $0.3$ are
 $34 \%$,
 $68 \%$ and
 $89 \%$, respectively.
Simulated and predicted values of (a) the collision frequency between small particles and large particles and (b) the particle–particle drag force of small particles exerted by large particles at various  $\langle R{e_p}\rangle $ and
 $\phi $. The collision frequency is normalized by
 $\nu /d_{sl}^2$, where
 $\nu $ is the kinematic viscosity of the gas and the particle–particle drag force is normalized by the Stokes drag force. The volume fraction of small particles
 ${x_s}$ is around
 $0.3$, and the particle diameter ratio is
 $2$. The circle, square and triangle symbols respectively correspond to
 $\phi = 0.1$,
 $0.2$ and
 $0.3$. Solid and void symbols respectively denote the simulation results and the predictions by the equations of Zhao & Wang (Reference Zhao and Wang2020, Reference Zhao and Wang2021), i.e. (2.14) in (a) and (2.13) in (b).

For the cases in figure 1, the mean of the skewness and the mean of the kurtosis (the kurtosis of the normal distribution, i.e. 3, is subtracted) of the single-particle VDFs are both smaller than  $0.1$, indicating the assumption of the Maxwellian is valid. The ratio of the granular temperature in the streamwise direction to the non-streamwise direction is
 $1.15$ on average. However, there is no apparent correlation between the ratio and the total solid volume fraction, which is inconsistent with the tendency of in the deviations of (2.13) shown in figure 1(b), and hence the slight anisotropy is not the cause of the poor performance of (2.13). Before further analysis, the mean free path of particle type i, in the reference frame of the mass centre of particle type j, will first be derived. The mean free path is the mean distance travelled by a particle between successive collisions during a given time and is defined by
 \begin{equation}{l_i} = \frac{{{n_i}\langle {v_i}\rangle \Delta t}}{{{n_i}\Delta t/{\tau _i}}},\end{equation}
where  ${\tau _i}$ is the collision interval and equals to
 ${n_i}/({N_{ii}} + {N_{ij}})$. In the reference frame of the mass centre of particle type j, the velocity of a particle of type i, denoted by
 ${\boldsymbol{v}_i}$, is
 ${\boldsymbol{c}_i} - {\boldsymbol{u}_j}$, and the mean of
 ${\boldsymbol{v}_i}$ is the relative velocity
 $\langle \boldsymbol{g}\rangle $. The mean of the module of
 ${\boldsymbol{v}_i}$ is then computed from (2.3) and (2.11) with
 ${\boldsymbol{c}_i}$ and
 ${\boldsymbol{u}_i}$ replaced by
 ${\boldsymbol{v}_i}$ and
 $\langle \boldsymbol{g}\rangle $ respectively. By the integral method in Glansdorff (Reference Glansdorff1962), Zhao & Wang (Reference Zhao and Wang2020), the final form of
 $\langle {v_i}\rangle $ is
 \begin{equation}\langle {v_i}\rangle = \sqrt {\frac{{2{T_i}}}{{\rm \pi} }} \,{\textrm{e}^{ - {{\langle g\rangle }^2}/(2{T_i})}} + \left( {\langle g\rangle + \frac{{{T_i}}}{{\langle g\rangle }}} \right)erf\left( {\frac{{\langle g\rangle }}{{\sqrt {2{T_i}} }}} \right).\end{equation}
We should note that, when  $\langle g\rangle = 0$, the above equation reduces to the form
 $\langle {v_i}\rangle = 2\sqrt {2{T_i}/{\rm \pi} } $, which is the relation of
 $\langle {C_i}\rangle $ proposed in the book of Chapman & Cowling (Reference Chapman and Cowling1970).
Figure 2 shows the collisions between a small particle, labelled by m, and large particles during  $20{\tau _{sl}}$. Here,
 ${\tau _{sl}}$ is the mean of the collision interval between small particles and large particles and equals
 ${n_s}/{N_{sl}}$. Once a small particle collides with a large particle, over the following time, the small particle will probably be trapped within the space around the large particle, and bounce back and forth, with a much shorter interval than
 ${\tau _{sl}}$, among the large particle and its neighbours. For example, during the time period
 $t/{\tau _{sl}} = 14.8\sim 18.8$, the small particle m is trapped within the space between the large particles of no. 13 and no. 21, and in turn collides with them by an interval of
 $0.44{\tau _{sl}}$. Note that other small particles also play a role in trapping the small particle
 $m$. Similar phenomena can also be found in the time periods
 $t/{\tau _{sl}} = 0.1\sim 1.6$
 $(0.21{\tau _{sl}})$ and
 $8.7\sim 11.7(0.43{\tau _{sl}})$, and these time periods are named the time period of trapping for brevity (indicated by the shadows in figure 2). Under the prerequisite condition of
 ${\tau _{sl}} < {\tau _{ps}}$, a shorter collision interval gives a smaller relative velocity. This is because the collisions between different particle types reduce their relative velocity. Here,
 ${\tau _{ps}}$ is the small-particle relaxation time and can be roughly estimated by
 $d_s^2{\rho _s}/(18\mu {F_{ds}})$ (Zaichik et al. Reference Zaichik, Fede, Simonin and Alipchenkov2009). It can be calculated by simulation results that
 ${\tau _{ps}}/{\tau _{sl}}\sim O(10)$ in this case. Consequently, it is expected that the relative velocity over the time period of trapping is statistically smaller than the relative velocity over the entire time period. Because most of the collision events occur during the time period of trapping, it is more reasonable to use the relative velocity over this time period instead of that over the entire time period. By fitting (2.13) and (2.14) with polynomials, it has been found that for
 $\langle {g^\ast }\rangle < 1$ in this study,
 ${N_{ij}}$ is insensitive to
 $\langle {g^\ast }\rangle $ and
 $\boldsymbol{\unicode{x1D4BB}}_{\!ij}$ almost linearly increases as
 $\langle {g^\ast }\rangle $. Therefore, with the mean of the relative velocity over the entire time period, (2.14) well predicts the collision frequency, but (2.13) significantly overestimates the particle–particle drag force. Considering that the small particle that has just collided with a large particle will collide with other particles on average at the location
 ${l_s}$ away from the large particle, and then be probably bounced back and trapped, in what follows, the relative velocity during the time period when the relative distance of the particle pair is smaller than a mean free path
 ${l_s}$ is assumed to be relevant to the particle–particle drag force.
The collisions between a small particle, labelled by the subscript m, and large particles during  $20{\tau _{sl}}$ for the case of
 $\phi = 0.3$,
 ${x_s} \approx 0.3$,
 ${d_l}/{d_s} = 2$ and
 $\langle R{e_p}\rangle \approx 69.2$. The shadows indicate the time periods of trapping. (a) The instantaneous change of the minimum distance between the small particle m and large particles, normalized by the arithmetic mean diameter
 ${d_{sl}}$. Here,
 $|{\boldsymbol{r}_{sm}} - {\boldsymbol{r}_l}{|_{min}}/{d_{sl}} = 1$ implies the collision between the small particle m and a large particle. (b) Number of the particles that collided with the small particle m. Circles and squares respectively denote small and large particles. According to the time sequence of collisions, the shown particles are labelled by no. 1, 2, 3, ….

The position and velocity of each particle in a computational domain are collected after a statistically stationary state has been reached, and then the relative velocity of each particle pair of different size,  $\boldsymbol{g} = {\boldsymbol{c}_s} - {\boldsymbol{c}_l}$, is binned in terms of the distance
 $|{\boldsymbol{r}_s} - {\boldsymbol{r}_l}|$ and
 ${\theta _{\boldsymbol{k}}}$, which is the angle between
 $\boldsymbol{k}$ and the flow direction. Recall that
 $\boldsymbol{k}$ is the unit vector along
 ${\boldsymbol{r}_l} - {\boldsymbol{r}_s}$. Figure 3 shows the geometry of the left part of a bin in two dimensions, denoted by
 $\Delta A$, and the geometry in three dimensions is obtained by rotating
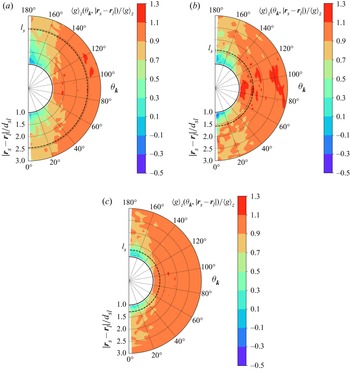
 $\Delta A$ around the z-axis. Figure 4 is the contour plot of the mean of the relative velocities within each bin,
 $\langle \boldsymbol{g}\rangle ({\theta _{\boldsymbol{k}}},|{\boldsymbol{r}_s} - {\boldsymbol{r}_l}|)$, normalized by that within the entire domain,
 $\langle \boldsymbol{g}\rangle $. Because the distribution of the relative velocity is symmetrical about the z-axis of the spherical coordinate system
 $({\theta _{\boldsymbol{k}}},|{\boldsymbol{r}_s} - {\boldsymbol{r}_l}|,\varphi )$ shown in figure 3, the x and y components of
 $\langle \boldsymbol{g}\rangle ({\theta _{\boldsymbol{k}}},|{\boldsymbol{r}_s} - {\boldsymbol{r}_l}|)$ and
 $\langle \boldsymbol{g}\rangle $ are close to zero. As discussed earlier, a small particle is easily trapped within the space around a large particle, and statistically has a velocity close to that of the large particle. As a result, the regions of the low relative velocity are formed near large particles, as shown in figure 4. As the total solid volume fraction increases, the distance that the trapped small particle is allowed to travel becomes smaller and smaller, and therefore the regions of low relative velocity gradually shrink. In the streamwise direction, the collision force, which hinders the growth of the relative velocity, decreases with
 ${\theta _{\boldsymbol{k}}}$ approaching
 ${\rm \pi} /2$, and therefore the relative velocity increases under the action of the gas–particle drag force, as shown in figure 4. The mean free path signified by the dotted line decreases as
 $\phi $ increases since the collision frequency increases with
 $\phi $. The modules of the mean relative velocities within the mean free path, denoted by
 $\langle g\rangle (|{\boldsymbol{r}_s} - {\boldsymbol{r}_l}|< {l_s})$, respectively equal
 $0.93\langle g\rangle $,
 $0.88\langle g\rangle $ and
 $0.78\langle g\rangle $ when
 $\phi = 0.1$,
 $0.2$ and
 $0.3$. With
 $\langle g\rangle (|{\boldsymbol{r}_s} - {\boldsymbol{r}_l}|< {l_s})$, the predictions of (2.13) will be smaller and hence become closer to the simulation results. However, before doing that, the effect of the anisotropy observed in figure 4 on the particle–particle drag force is first discussed.
Geometry of the left part of a bin in two dimensions, which is denoted by  $\Delta A$ and indicated by the shadowed area. Here,
 ${O_1}$ is the origin of a fixed coordinate system, and
 ${O_2}$ is the origin of a spherical coordinate system
 $({\theta _{\boldsymbol{k}}},|{\boldsymbol{r}_s} - {\boldsymbol{r}_l}|,\varphi )$, co-moving with large particles. The z-axis of the spherical coordinate system coincides with the flow direction. The geometry of a bin in three dimensions is obtained by rotating
 $\Delta A$ around the z-axis.

Contour plot of the relative velocity of particle pairs of different size in a polar coordinate system  $({\theta _{\boldsymbol{k}}},|{\boldsymbol{r}_s} - {\boldsymbol{r}_l}|)$. The meanings of
 ${\theta _{\boldsymbol{k}}}$ and
 $|{\boldsymbol{r}_s} - {\boldsymbol{r}_l}|$ are described in figure 3. The subscript z denotes the streamwise direction. The dotted line indicates
 $|{\boldsymbol{r}_s} - {\boldsymbol{r}_l}|= {l_s}$, where
 ${l_s}$ is the mean free path of small particles and calculated by (4.1) and (4.2). Here,
 ${x_s} \approx 0.3$,
 ${d_l}/{d_s} = 2$,
 $\langle R{e_p}\rangle \approx 70.7$ and (a)
 $\phi = 0.1$, (b)
 $\phi = 0.2$, (c)
 $\phi = 0.3$.

By symmetry, the collision forces cancel each other in the directions perpendicular to the flow direction, and therefore only the streamwise component contributes to the particle–particle drag force. The streamwise component of the collision force varies with the polar angle as the function  $\cos {\theta _{\boldsymbol{k}}}$, and consequently the relative velocity also changes as a function of
 ${\theta _{\boldsymbol{k}}}$, as mentioned above. It is necessary to consider the correlation between the two functions in calculating the particle–particle drag force. For example, the relative velocity is large around
 ${\theta _{\boldsymbol{k}}} = {\rm \pi}/2$, but the streamwise component of the collision force in this region is close to zero. Therefore, it can be expected that (2.13) will overestimate the particle–particle drag force by neglecting the anisotropic distribution of the relative velocity. A feasible way to consider the correlation is first to compute the particle–particle drag forces at different polar angles and then sum them up. Assuming the single-particle VDF at each polar angle is Maxwellian, the derivation process of the particle–particle drag force at a specific polar angle is given as follows:
 \begin{align} {\unicode{x1D4BB}_{\!sl}} & ={-} d_{sl}^2\dfrac{{{m_s}{m_l}}}{{{m_s} + {m_l}}}(1 + {e_{sl}}){\chi _{sl}}\iint\!\!\!\int_{\boldsymbol{g}\boldsymbol{\cdot }\boldsymbol{k} > 0} {{f_s}{f_l}{{(\boldsymbol{g}\boldsymbol{\cdot }\boldsymbol{k})}^2}\boldsymbol{k}\,\textrm{d}\boldsymbol{k}\,\textrm{d}{\boldsymbol{c}_l}\,\textrm{d}{\boldsymbol{c}_s}} \nonumber\\ & ={-} d_{sl}^2\dfrac{{{m_s}{m_l}}}{{{m_s} + {m_l}}}(1 + {e_{sl}})\dfrac{{{\chi _{sl}}{n_s}{n_l}}}{{{{(2{\rm \pi} )}^3}{{({T_s}{T_l})}^{3/2}}}}\iint\!\!\!\int_{\boldsymbol{g}\boldsymbol{\cdot }\boldsymbol{k} > 0}\nonumber\\ &\quad \times {{\textrm{e}^{ - {{[{\boldsymbol{c}_s} - {\boldsymbol{u}_s}({\theta _{\boldsymbol{k}}})]}^2}/(2{T_s}) - {{[{\boldsymbol{c}_l} - {\boldsymbol{u}_l}({\theta _{\boldsymbol{k}}})]}^2}/(2{T_l})}}{{(\boldsymbol{g}\boldsymbol{\cdot }\boldsymbol{k})}^2}\boldsymbol{k}\,\textrm{d}\boldsymbol{k}\,\textrm{d}{\boldsymbol{c}_l}\,\textrm{d}{\boldsymbol{c}_s}} . \end{align}
Note that  ${\boldsymbol{u}_s}$ and
 ${\boldsymbol{u}_l}$ vary with
 ${\theta _{\boldsymbol{k}}}$ in this equation. By the integral method employed in Glansdorff (Reference Glansdorff1962) and Zhao & Wang (Reference Zhao and Wang2020), the above equation can be transformed into
 \begin{align} {{\unicode{x1D4BB}}_{\!sl}} = C\int {{\textrm{e}^{-({T_s} + {T_l})/(2T_s T_l){{(\boldsymbol{G} - \langle \boldsymbol{G}\rangle )}^2}}}\,\textrm{d}\boldsymbol{G}} \iint_{\boldsymbol{g}\boldsymbol{\cdot }\boldsymbol{k} > 0} {{\textrm{e}^{ - {{[\boldsymbol{g} - \langle \boldsymbol{g}\rangle ({\theta _{\boldsymbol{k}}})]}^2}/(2({T_s} + {T_l}))}}{{(\boldsymbol{g}\boldsymbol{\cdot }\boldsymbol{k})}^2}\boldsymbol{k}\,\textrm{d}\boldsymbol{g}\,\textrm{d}\boldsymbol{k}} ,\end{align}
where  $\boldsymbol{G} = ({T_s}{\boldsymbol{c}_l} + {T_l}{\boldsymbol{c}_s})/({T_s} + {T_l})$, and
 $\textrm{d}{\boldsymbol{c}_l}\,\textrm{d}{\boldsymbol{c}_s} = \textrm{d}\boldsymbol{G}\,\textrm{d}\boldsymbol{g}$ according to the Jacobian determinant. Here, C is the constant before the integral sign of (4.3). The integral of
 $\boldsymbol{g}$ is carried out in the spherical coordinates where the z-axis coincides with
 $\boldsymbol{k}$ and is given as
 \begin{align} {{\unicode{x1D4BB}}_{\!sl}} & = C{\left( {\dfrac{{2{\rm \pi} {T_s}{T_l}}}{{{T_s} + {T_l}}}} \right)^{3/2}}\iint_{\boldsymbol{g}\boldsymbol{\cdot }\boldsymbol{k} > 0} {{\textrm{e}^{ - {{g^{\prime 2}}}/(2({T_s} + {T_l}))}}{{(\boldsymbol{g}\boldsymbol{\cdot }\boldsymbol{k})}^2}\boldsymbol{k}\,\textrm{d}\boldsymbol{g}^{\prime}\,\textrm{d}\boldsymbol{k}} \nonumber\\ & = 2{\rm \pi} C{\left( {\dfrac{{2{\rm \pi} {T_s}{T_l}}}{{{T_s} + {T_l}}}} \right)^{3/2}}\int_{\boldsymbol{g}\boldsymbol{\cdot}\boldsymbol{k} > 0} {{\textrm{e}^{ - {{g^{\prime 2}}}/(2(T_s+T_l))}} {{(g\cos {\theta _{\boldsymbol{g}}})}^2}{{g^{\prime 2}}}\sin {\theta _{\boldsymbol{g^{\prime}}}}\,\textrm{d}{\theta _{\boldsymbol{g^{\prime}}}}\,\textrm{d}g^{\prime}\boldsymbol{k}\,\textrm{d}\boldsymbol{k}} .\end{align}
From  $\boldsymbol{g}\boldsymbol{\cdot }\boldsymbol{k} = \textrm{[}\langle \boldsymbol{g}\rangle \textrm{(}{\theta _{\boldsymbol{k}}}\textrm{) + }\boldsymbol{g^{\prime}}]\boldsymbol{\cdot }\boldsymbol{k}$, i.e.
 $g\cos {\theta _{\boldsymbol{g}}} = \langle g\rangle ({\theta _{\boldsymbol{k}}})\cos {\psi _{\boldsymbol{k}}} + g^{\prime}\cos {\theta _{\boldsymbol{g^{\prime}}}}$, we have that
 $\boldsymbol{g}\boldsymbol{\cdot }\boldsymbol{k} > 0$ is equivalent to
 $\cos {\theta _{\boldsymbol{g^{\prime}}}} > - \langle g\rangle ({\theta _{\boldsymbol{k}}})\cos {\psi _{\boldsymbol{k}}}/g^{\prime}$. Here,
 ${\psi _{\boldsymbol{k}}}$ is the angle between
 $\langle \boldsymbol{g}\rangle ({\theta _{\boldsymbol{k}}})$ and
 $\boldsymbol{k}$. Let
 $x = \cos {\theta _{\boldsymbol{g^{\prime}}}}$, (4.5) is changed into
 \begin{align}{{\unicode{x1D4BB}}_{\!sl}} &=
2{\rm \pi} C{\left( {\frac{{2{\rm \pi} {T_s}{T_l}}}{{{T_s} + {T_l}}}}
\right)^{3/2}}\int_D {{e^{ - {{g^{\prime 2}}}/(2({T_s} + {T_l}))}}} [\langle g\rangle {\textrm{(}{\theta
_{\boldsymbol{k}}}\textrm{)}^2}{g^{\prime 2}}{\cos ^2}{\psi
_{\boldsymbol{k}}} + {g^{\prime 4}}{x^2}\nonumber\\ &\quad + 2\langle
g\rangle \textrm{(}{\theta
_{\boldsymbol{k}}}\textrm{)}{g^{\prime 3}}\cos {\psi
_{\boldsymbol{k}}}x]\,\textrm{d}x\,\textrm{d}g^{\prime}\boldsymbol{k}\,
\textrm{d}\boldsymbol{k}.\end{align}
Here, D is the domain of integration. When  $0 < {\psi _{\boldsymbol{k}}} < {\rm \pi}/2$
 \begin{align}D &= \{ - 1 < x <
1,\,0 < g^{\prime} < \langle g\rangle \textrm{(}{\theta
_{\boldsymbol{k}}})\cos {\psi _{\boldsymbol{k}}}\}\nonumber\\ &\quad \cup
\left\{ { - \frac{{\langle g\rangle
\textrm{(}{\theta_{\boldsymbol{k}}})\cos
{\psi_{\boldsymbol{k}}}}}{{g^{\prime}}} < x <
1,\,\langle g\rangle({\theta_{\boldsymbol{k}}})\cos
{\psi_{\boldsymbol{k}}} < g^{\prime} < + \infty }
\right\}.\end{align}
When  ${\rm \pi} /2 < {\psi_{\boldsymbol{k}}} < {\rm \pi}$
 \begin{equation}D = \left\{ { -
\frac{{\langle g\rangle\textrm{(}{\theta_{\boldsymbol{k}}})\cos
{\psi_{\boldsymbol{k}}}}}{{g^{\prime}}} < x < 1, -
\langle g\rangle \textrm{(}{\theta_{\boldsymbol{k}}})\cos
{\psi_{\boldsymbol{k}}} < g^{\prime} < + \infty }
\right\}.\end{equation}
Equation (4.6) can be integrated by parts, and it is found that the results in both situations, i.e.  $0 < {\psi _{\boldsymbol{k}}} < {\rm \pi}/2$ and
 ${\rm \pi} /2 < {\psi _{\boldsymbol{k}}} < {\rm \pi}$, are the same
 \begin{align}
{{\unicode{x1D4BB}}_{\!sl}} & ={-} 2{\rm \pi}
d_{sl}^2\dfrac{{{m_s}{m_l}}}{{{m_s} + {m_l}}}(1 +
{e_{sl}}){n_s}{n_l}({T_s} + {T_l}){\chi _{sl}}\int {\left\{
{\dfrac{1}{{\sqrt {\rm \pi} }}{{\cos
}^2}{\theta_{\boldsymbol{k}}}\,{\textrm{e}^{ - {{[\langle
{g^\ast }\rangle ({\theta_{\boldsymbol{k}}})\cos
{\theta_{\boldsymbol{k}}}]}^2}}}} \right.} \nonumber\\ & \quad +\,
\left[ {\dfrac{{\cos {\theta_{\boldsymbol{k}}}}}{{2\langle
{g^\ast }\rangle ({\theta_{\boldsymbol{k}}})}} + \langle
{g^\ast }\rangle ({\theta_{\boldsymbol{k}}}){{\cos
}^3}{\theta_{\boldsymbol{k}}}} \right]erf[\langle {g^\ast
}\rangle ({\theta _{\boldsymbol{k}}})\cos {\theta
_{\boldsymbol{k}}}]\nonumber\\ & \quad \left. { + \,\dfrac{{A\cos
{\theta_{\boldsymbol{k}}}}}{{2\langle {g^\ast }\rangle
({\theta_{\boldsymbol{k}}})}} + A\langle {g^\ast }\rangle
({\theta_{\boldsymbol{k}}}){{\cos
}^3}{\theta_{\boldsymbol{k}}}} \right\}\sin {\theta
_{\boldsymbol{k}}}\langle {\boldsymbol{g}^\ast }\rangle
({\theta _{\boldsymbol{k}}})\,\textrm{d}{\theta
_{\boldsymbol{k}}},
\end{align}
where the integrand function multiplied by  $d{\theta _{\boldsymbol{k}}}$ is the particle–particle drag force at
 ${\theta _{\boldsymbol{k}}}$. In the above equation,
 $\cos {\psi _{\boldsymbol{k}}}$ is replaced by
 $\cos {\psi _{\boldsymbol{k}}} = A\cos {\theta _{\boldsymbol{k}}}$ since
 $\langle \boldsymbol{g}\rangle ({\theta _{\boldsymbol{k}}}\textrm{)}$ is parallel with
 $\langle \boldsymbol{g}\rangle $. Here,
 $A = \textrm{1}$ when
 $\langle \boldsymbol{g}\rangle ({\theta _{\boldsymbol{k}}}\textrm{)}$ is in the direction of
 $\langle \boldsymbol{g}\rangle $, and
 $A ={-} \textrm{1}$ when
 $\langle \boldsymbol{g}\rangle ({\theta _{\boldsymbol{k}}}\textrm{)}$ is in the opposite direction of
 $\langle \boldsymbol{g}\rangle $.
To compute the particle–particle drag force, the integral in (4.9) is discretized numerically, and the mean of the relative velocity in each discrete interval  $\Delta {\theta _{\boldsymbol{k}}}$ within the range
 $|{\boldsymbol{r}_s} - {\boldsymbol{r}_l}|< {l_s}$, represented by
 $\langle \boldsymbol{g}\rangle \textrm{(}{\theta _{\boldsymbol{k}}},|{\boldsymbol{r}_s} - {\boldsymbol{r}_l}|< {l_s}\textrm{)}$, is substituted into the discrete equation. Figure 5 shows the comparison between predictions and simulation results for all simulation cases in this study. The square points are computed by substituting the mean of the relative velocity within the range
 $|{\boldsymbol{r}_s} - {\boldsymbol{r}_l}|< {l_s}$, i.e.
 $\langle \boldsymbol{g}\rangle \textrm{(}|{\boldsymbol{r}_s} - {\boldsymbol{r}_l}|< {l_s}\textrm{)}$, into (2.13), and therefore do not include the effect of the anisotropy. The predictions by (4.9) are the most accurate with a mean error of
 $8\,\textrm{%}$ (maximum
 $25\,\textrm{%}$), and the prediction by (2.13) with
 $\langle \boldsymbol{g}\rangle $ is the worst with a mean error of
 $61\,\textrm{%}$ (maximum
 $109\,\textrm{%}$). The predictions by (2.13) with
 $\langle \boldsymbol{g}\rangle \textrm{(}|{\boldsymbol{r}_s} - {\boldsymbol{r}_l}|< {l_s}\textrm{)}$ are between the predictions by (2.13) and (4.9) with a mean error of
 $32\,\textrm{%}$ (maximum
 $48\,\textrm{%}$), which indicates that the anisotropy of the relative-velocity distribution cannot be neglected. Note that (4.9) still slightly overestimates the particle–particle drag force. This may be caused by hydrodynamic interactions between particle pairs.
Predictions versus simulation results for the particle–particle drag force of small particles. Circles, squares and triangles respectively represent the predictions calculated by (2.13) with  $\langle \boldsymbol{g}\rangle $, (2.13) with
 $\langle \boldsymbol{g}\rangle (|{\boldsymbol{r}_s} - {\boldsymbol{r}_l}|< {l_s})$ and (4.9) with
 $\langle \boldsymbol{g}\rangle ({\theta _{\boldsymbol{k}}},|{\boldsymbol{r}_s} - {\boldsymbol{r}_l}|< {l_s})$. The dotted line is the bisector line
 $y = x$. The parameter range is shown in table 1.

To apply (4.9) in MFM simulations, the relative velocity within a mean free path of small particles  ${l_s}$, i.e.
 $\langle \boldsymbol{g}\rangle \textrm{(}{\theta _{\boldsymbol{k}}},|{\boldsymbol{r}_s} - {\boldsymbol{r}_l}|< {l_s}\textrm{)}$, must be adequately resolved, which implies that the grid size should be much smaller than
 ${l_s}$. For the case shown in figure 4(c), the mean free path is only
 $1.28{d_{sl}}$, leading to a grid size of a small fraction of a large-particle diameter. It is infeasible to use such a fine grid in MFM simulations mainly due to the huge computational cost. With this in mind, the relative velocity
 $\langle \boldsymbol{g}\rangle $ in (2.13) is replaced by an effective relative velocity, denoted as
 $\alpha \langle \boldsymbol{g}\rangle $, in order to make the predictions of (2.13) agree with those of (4.9), that is
 \begin{equation}{{\unicode{x1D4BB}}_{\!sl}}(\alpha \langle \boldsymbol{g}\rangle ) = {{\unicode{x1D4BB}}_{\!sl}}[\langle \boldsymbol{g}\rangle ({\theta _{\boldsymbol{k}}},|{\boldsymbol{r}_s} - {\boldsymbol{r}_l}|< {l_s})].\end{equation}
The factor  $\alpha $ is solved by iteration. With
 $\phi $ increasing, the probability of repeated collisions increases since the particle motion is more restricted. Consequently, the correlation between pre-collision velocities becomes stronger, and accordingly, the factor
 $\alpha $ decreases, as seen in figure 6. The effect of
 ${x_s}$ on
 $\alpha $ is twofold. First, the effect of
 ${x_s}$ is the same as the effect of
 $\phi $ because the total particle number density increases with
 ${x_s}$. Second, as
 ${x_s}$ increases, the collisions between small particles become more frequent, and small particles relax more quickly. This is because the collisions between like particles help a post-collision pair to recover their statistically stationary velocities. If the correlation between pre-collision velocities is mainly controlled by the relaxation process of small particles, the correlation becomes weaker and therefore
 $\alpha $ increases. As shown in figure 6, the factor
 $\alpha $ decreases with
 ${x_s}$, which indicates the first effect dominates the correlation between pre-collision velocities. Note that the particle diameter ratio and the Reynolds number have a minor effect on
 $\alpha $. The factor
 $\alpha $ is approximately fitted by a linear function of
 $\phi $ and
 ${x_s}$, which is given as
 \begin{equation}\alpha ={-} 1.363\phi - 0.3875{x_s} + 1.089.\end{equation}
The predictions of (2.13) with  $\alpha \langle \boldsymbol{g}\rangle $ where
 $\alpha $ is computed by (4.11) are close to that of (4.9), and deviate from simulation results by
 $10\,\textrm{%}$ on average (
 $23\,\textrm{%}$ maximum).
Variation of the factor  $\alpha $, defined by (4.10), with the total solid volume fraction
 $\phi $ at different volume fractions of small particles
 ${x_s}$. The error bar characterizes the standard deviation derived from the cases of different particle diameter ratios and particle Reynolds numbers. The dotted lines are the fitting curves given by (4.11).

5. Model assessment
In order to assess the performance of the model proposed in this study, we implement the model
 \begin{align}
{\boldsymbol{\unicode{x1D4BB}}_{\!ij}} & ={-} 2{\rm \pi}
d_{ij}^2\dfrac{{{m_i}{m_j}}}{{{m_i} + {m_j}}}(1 +
{e_{ij}}){n_i}{n_j}({T_i} + {T_j}){\chi _{ij}}\left[
{\dfrac{1}{{\sqrt {\rm \pi} }}\left( {\dfrac{1}{2} +
\dfrac{1}{{4{\alpha^2}{{\langle {g^\ast }\rangle }^2}}}}
\right)\,{\textrm{e}^{ - {\alpha^2}{{\langle {g^\ast
}\rangle }^2}}}} \right.\nonumber\\ & \quad \left. { + \left(
{\dfrac{{\alpha \langle {g^\ast }\rangle }}{2} +
\dfrac{1}{{2\alpha \langle {g^\ast }\rangle }} -
\dfrac{1}{{8{\alpha^3}{{\langle {g^\ast }\rangle }^3}}}}
\right)erf(\alpha \langle {g^\ast }\rangle )} \right]\alpha
\langle {\boldsymbol{g}^\ast }\rangle \nonumber\\ & \quad \alpha
={-} 1.363\phi - 0.3875{x_s} + 1.089,
\end{align}
in MFIX-MFM and perform MFM simulations. The cases of  $\phi = 0.1\sim 0.3$,
 ${x_s} \approx 0.3$,
 ${d_l}/{d_s} = 2$ and
 $\langle R{e_p}\rangle \approx 70.7$ are chosen. For comparison, the input parameter settings and boundary conditions are consistent with the PR-DNSs. Assuming the gas is air and the gravitational acceleration equals
 $9.81\ \textrm{m}\ {\textrm{s}^{ - 2}}$, the input parameters in lattice units are converted into those in physical units and listed in table 2. The gas–particle drag force is calculated by the model of Beetstra et al. (Reference Beetstra, van der Hoef and Kuipers2007), which is appropriate for bidisperse suspensions that are inertial and homogeneous. Benyahia (Reference Benyahia2008) compared the predictions of several kinetic theories with molecular dynamic data and found the kinetic theory of Iddir & Arastoopour (Reference Iddir and Arastoopour2005) is the most accurate one. Consequently, the kinetic theory of Iddir & Arastoopour (Reference Iddir and Arastoopour2005) is adopted in the present study. The grid size of
 $2.5{d_l}$ is chosen, and it has been found that the domain-averaged quantities do not change as the grid size decreases to
 $0.5{d_l}$.
The input parameter settings for MFM simulations. Here, g is the gravitational acceleration, and  $\Delta p$ is the pressure drop across the entire domain, which is used to drive the flow; e and
 ${C_f}$ represent the coefficient of restitution and the friction coefficient, respectively; t is the total simulation time.

The relative velocity (a), particle–particle drag force of small particles and gas–particle drag force are shown as functions of the total solid volume faction. Here, the relative velocity is non-dimensionalized by the Sauter mean diameter and kinematic viscosity to give the particle Reynold number, and the gas–particle drag force is normalized by the Stokes drag force. The abbreviations ZW, IA and S denote the models of Zhao & Wang (Reference Zhao and Wang2021), Iddir & Arastoopour (Reference Iddir and Arastoopour2005) and Syamlal (Reference Syamlal1987), respectively.

Besides the model of this study and Zhao & Wang (Reference Zhao and Wang2021), the models of Syamlal (Reference Syamlal1987) and Iddir & Arastoopour (Reference Iddir and Arastoopour2005) are also tested. Note that when  $\alpha = 1$, (5.1) degenerates to the model of Zhao & Wang (Reference Zhao and Wang2021), i.e. (2.13). The models of Syamlal (Reference Syamlal1987) and Iddir & Arastoopour (Reference Iddir and Arastoopour2005) are respectively given as
 \begin{gather}{\boldsymbol{\unicode{x1D4BB}}_{\!ij}} ={-} d_{ij}^2\frac{{{m_i}{m_j}}}{{{m_i} + {m_j}}}(1 + {e_{ij}}){n_i}{n_j}{\chi _{ij}}\left( {\frac{{\rm \pi} }{2} + \frac{{{{\rm \pi} ^2}{C_f}}}{8}} \right)\langle g\rangle \langle \boldsymbol{g}\rangle \textrm{,}\end{gather}
 \begin{gather}{\boldsymbol{\unicode{x1D4BB}}_{\!ij}} ={-} \frac{{\sqrt {\rm \pi} d_{ij}^2}}{4}\frac{{{m_i}{m_j}}}{{{m_i} + {m_j}}}(1 + {e_{ij}}){n_i}{n_j}{\chi _{ij}}{\left( {\frac{1}{{{T_i}{T_j}}}} \right)^{3/2}}{R_2}\langle \boldsymbol{g}\rangle \textrm{,}\end{gather}
 \begin{gather}{R_2} = \frac{1}{{2A_{ij}^{3/2}D_{ij}^2}} + \frac{{3B_{ij}^2}}{{A_{ij}^{5/2}D_{ij}^3}} + \frac{{15B_{ij}^4}}{{A_{ij}^{7/2}D_{ij}^4}} + \cdots ,\end{gather}
 \begin{gather}{A_{ij}} = \frac{{{T_i} + {T_j}}}{{2{T_i}{T_j}}},\quad {B_{ij}} = \frac{{{m_j}{T_j} - {m_i}{T_i}}}{{2({m_i} + {m_j}){T_i}{T_j}}},\quad {D_{ij}} = \frac{{m_i^2{T_i} + m_j^2{T_j}}}{{2{{({m_i} + {m_j})}^2}{T_i}{T_j}}}.\end{gather}
In (5.2), the model of Syamlal (Reference Syamlal1987),  ${C_f}$ denotes the friction coefficient and equals zero in the present study. And in (5.3), the model of Iddir & Arastoopour (Reference Iddir and Arastoopour2005), the terms including the gradients of the particle number density and granular temperature are neglected because the studied suspensions are homogeneous. In addition, the granular temperature in the paper of Iddir & Arastoopour (Reference Iddir and Arastoopour2005) includes the particle mass, while the granular temperature in this paper, i.e.
 ${T_i}$, does not.
Figures 7(a), 7(b) and 7(c) respectively plot the dimensionless relative velocity, the particle–particle drag force and the gas–particle drag force as functions of  $\phi $. For convenience, the abbreviations ZW, IA and S are introduced to respectively represent the models of Zhao & Wang (Reference Zhao and Wang2021), Iddir & Arastoopour (Reference Iddir and Arastoopour2005) and Syamlal (Reference Syamlal1987). As shown in figure 7(a,b), model S highly underestimates the particle–particle drag force due to neglecting the granular temperature. Consequently, the relative velocity predicted by model S is much higher than that of PR-DNSs. As discussed in this paper, model ZW overpredicts the particle–particle drag force by neglecting the correlation between pre-collision velocities and hence underpredicts the relative velocity. The particle–particle drag force predicted by model IA is reasonably good for
 $\phi = 0.1$ and
 $0.2$ but too high for
 $\phi = 0.3$. In the derivation process of Iddir & Arastoopour (Reference Iddir and Arastoopour2005), the Taylor expansion is applied to the Maxwell distribution function and some simplifications are made, such as the module of the relative velocity
 $|{\boldsymbol{c}_i} - {\boldsymbol{c}_j}|$ replaced by
 $|{\boldsymbol{C}_i} - {\boldsymbol{C}_j}|$. The readers can refer to the paper of Zhao & Wang (Reference Zhao and Wang2020) for more details. In fact, model IA should be the same as model ZW if no approximation is made. A comparison between the predictions of model IA and those of model ZW shows that the approximations made by Iddir & Arastoopour (Reference Iddir and Arastoopour2005) are inaccurate. Hence the good agreement of model IA for
 $\phi = 0.1$ and
 $0.2$ is just a coincidence. The model proposed in this study shows good agreement for the particle–particle drag force but underpredicts the relative velocity for
 $\phi = 0.1$ and
 $0.2$. The reason for this underestimate is due to the inaccuracy of the gas–particle drag model. As shown in figure 7(c), the model of Beetstra et al. (Reference Beetstra, van der Hoef and Kuipers2007) overpredicts the gas–particle drag force of large particles for
 $\phi = 0.1$ and
 $0.2$. Since the particle velocity increases with the gas–particle drag force, the large-particle velocity is overestimated, leading to an underestimated relative velocity. This is also the reason why the particle–particle drag forces predicted by model ZW and model IA gradually approach PR-DNSs as
 $\phi $ decreases while the relative velocities do not show this trend. At
 $\phi = 0.3$, where the model of Beetstra et al. (Reference Beetstra, van der Hoef and Kuipers2007) is accurate, the relative velocity predicted by the present model is in good agreement with PR-DNSs, verifying the accuracy of the model proposed in this study.
6. Conclusion
In this work, bidisperse gas–particle suspensions containing smooth particles are simulated by a set of fully resolved methods to examine and improve the particle–particle drag relation derived from KTGF. The computational domain is a small and fully periodic cube that corresponds to a grid in fine MFM simulations. Three total solid volume fractions of  $0.1$,
 $0.2$ and
 $0.3$ are chosen. The particle Reynolds number ranges from
 $6.7$ to
 $123.8$, and in this range the Stokes number is high so that the lubrication force has a neglectable effect. Under these conditions, the microstructure of the suspensions approaches binary hard-sphere fluids. It is found that the relation derived from the KTGF predicts the collision frequency well but highly overestimates the particle–particle drag force with a mean error of
 $61\,\textrm{%}$ (maximum
 $109\,\textrm{%}$). This is caused by the fact that the pre-collision velocities of colliding particles are not entirely independent of each other. The particle pair that has just collided is likely to collide again after being bounced back by other particles. The interval between the two successive collisions is so short that the post-collision velocities of the first collision cannot relax completely, leading to the pre-collision relative velocity of the second collision being statistically smaller than the domain-averaged relative velocity. Therefore, the KTGF-based relation overestimates the particle–particle drag force when the domain-averaged relative velocity is used.
Considering that a post-collision small particle is bounced back after travelling a mean free path on average, this work proposes to use the relative velocity within spherical shells centred on the centres of large particles and with an outer radius of a mean free path of small particles, to compute the particle–particle drag force. The relative velocity within this local region varies as  ${\theta _{\boldsymbol{k}}}$, the angle between the vector connecting a particle pair and the flow direction, and its mean is smaller than the domain-averaged relative velocity. In order to consider the anisotropic distribution of the relative velocity, the particle–particle drag forces at different
 ${\theta _{\boldsymbol{k}}}$ are first calculated and then summed up. The predictions of this new methodology are in good agreement with simulation results with a mean error of
 $8\,\textrm{%}$ (maximum
 $25\,\textrm{%}$). It is noted that the relative velocity in such a local region cannot be resolved even in fine MFM simulations. For this reason, the effective relative velocity is introduced and fitted as a function of the total solid volume fraction and the volume fraction of small particles based on the predictions of the new methodology. The relation of Zhao & Wang (Reference Zhao and Wang2021) with this effective relative velocity, i.e. (5.1), can be used in MFM simulations for predictive purposes. It is found by comparing the results of MFM simulations against PR-DNSs that (5.1) shows a significant improvement compared with existing relations in the literature and can give accurate predictions for the relative velocity.
In the present study, the particle surface is assumed to be smooth. However, many particles encountered in nature and industry are frictional. Friction between particles contributes to the particle–particle drag force in two aspects. First, the frictional force is part of the particle–particle drag force when the collision is oblique and the line connecting the particle pair is not parallel with the flow direction. Second, friction enhances energy dissipation. Consequently, the granular temperature decreases, and so does the particle–particle drag force. The relation of Syamlal (Reference Syamlal1987) only includes the first aspect by neglecting the granular temperature. It is a non-trivial task to include both two aspects into the particle–particle drag force in a mathematically rigorous way. This is left for future work.
Acknowledgements
We are grateful to the support by the HPC Platform Xi'an Jiaotong University.
Funding
This work was supported by the financial support by the National Natural Science Foundation of China (Grant Nos. 21978228, 51906196).
Declaration of interests
The authors report no conflict of interest.
Appendix A. The effect of domain size on the particle–particle drag force
To examine the effect of the domain size on the particle–particle drag force, suspensions of  $\phi = 0.2$,
 ${x_s} \approx 0.1$,
 ${d_l}/{d_s} = 1.6$ and
 $\langle R{e_p}\rangle \approx 38.3$ are simulated. The edge length of the computational domains ranges from
 $5{d_l}$ to
 $10{d_l}$. It is mentioned in § 3 that, for the case of
 $\phi = 0.3$ and
 $\langle R{e_p}\rangle \approx 113.5$, the maximum deviation at the gird size of
 ${d_s}/12$, relative to the results at the gird size of
 ${d_s}/20$, is just
 $5.7\,\textrm{%}$. For the case studied in this section, the deviations should be smaller since the required grid resolution decreases as
 $\phi $ or
 $\langle R{e_p}\rangle $ decreases. Therefore, the gird size of
 ${d_s}/12$ is adopted to save computational costs. Figure 8(a) presents the granular temperature and the relative velocity, both in dimensionless form, as functions of
 $L/{d_l}$, which is the ratio of the domain size to the large-particle diameter. It can be seen that, as
 $L/{d_l}$ increases, the trend of the relative velocity is unclear, but the granular temperatures of both small and large particles slowly increase. The increase of the granular temperature with domain size was first pointed out theoretically by Caflisch & Luke (Reference Caflisch and Luke1985) and later evidenced by the simulation results of Ladd (Reference Ladd1996). The reason for this increase is still under debate and beyond the scope of this work. The readers can refer to the review of Guazzelli & Hinch (Reference Guazzelli and Hinch2011) for more information. It should be noted that the suspensions in the previous studies are dilute and in the Stokes regime. The results presented here indicate that the increase of the granular temperature also occurs in dense suspensions at moderate Reynolds numbers.
(a) The relative velocity (right axis) and the granular temperature (left axis), in dimensionless form, are plotted as functions of the domain size. (b) The simulated and predicted values of the particle–particle drag force experienced by small particles as functions of the domain size. The error bars in this and the following figure represent the standard deviation for five cases with different initial particle configurations.

The particle–particle drag force as a function of  $L/{d_l}$ is shown in figure 8(b). The simulated particle–particle drag force barely changes with
 $L/{d_l}$ because the increment of the granular temperature is minimal. Both the relation of Zhao & Wang (Reference Zhao and Wang2021) and the present method using the relative velocity within a mean free path, i.e.
 $\langle \boldsymbol{g}\rangle ({\theta _{\boldsymbol{k}}},|{\boldsymbol{r}_s} - {\boldsymbol{r}_l}|< {l_s})$, overestimate the particle–particle drag force, and the overestimation is more severe in the case of
 $L/{d_l} > 7$. In the case of
 $L/{d_l} \le 7$, the prediction errors are respectively
 $55\,\textrm{%}$ and
 $12\,\textrm{%}$ for Zhao & Wang (Reference Zhao and Wang2021) and this study, and in the case of
 $L/{d_l} > 7$, the prediction errors are respectively
 $65\,\textrm{%}$ and
 $17\,\textrm{%}$, showing a marked improvement.
The increase of the prediction error with the domain size is caused by the inhomogeneity induced by instability. To find the evidence of inhomogeneity, two measures of the particle configuration are calculated and compared with the theoretical values. The first measure is the contact value of the radial distribution function and is used to quantify the short-range structure. It is found that, in the current range of  $L/{d_l}$, the simulated contact value agrees very well with the formula of Lebowitz (Reference Lebowitz1964), i.e. (2.15), indicating that no short-range change occurs. The second measure is the structure factor between small and large particles and is defined by
 \begin{equation}{S_{sl}}(\boldsymbol{\kappa }) = \left\langle {\frac{1}{{\sqrt {{N_s}{N_l}} }}\sum\limits_{m = 1}^{{N_s}} {\sum\limits_{n = 1}^{{N_l}} {{\textrm{e}^{I\boldsymbol{\kappa }\boldsymbol{\cdot }({\boldsymbol{r}_{sm}} - {\boldsymbol{r}_{ln}})}}} } } \right\rangle ,\end{equation}
where  $\boldsymbol{\kappa }$ and I denote the wave vector and the imaginary unit, respectively. Since the instability occurs first for the largest wavelength (the smallest wavenumber) possible, the structure factors of
 $\kappa = 2{\rm \pi} /L$ are reported
 \begin{equation}{\theta _\parallel } = {S_{sl}}(2{\rm \pi} \,{\boldsymbol{e}_z}/L),\quad {\theta _ \bot } = [{S_{sl}}(2{\rm \pi} \,{\boldsymbol{e}_x}/L) + {S_{sl}}(2{\rm \pi} \,{\boldsymbol{e}_y}/L)]/2.\end{equation}
In this equation,  ${\theta _\parallel }$ and
 ${\theta _ \bot }$ are respectively the structure factors in the streamwise and spanwise directions, and the set of
 $\{ {\boldsymbol{e}_x},{\boldsymbol{e}_y},{\boldsymbol{e}_z}\} $ is the basis of a Cartesian coordinate system. The structure factors
 ${\theta _\parallel }$ and
 ${\theta _ \bot }$ are also used by Koch & Sangani (Reference Koch and Sangani1999) to identify inhomogeneous structures. Figure 9 shows the simulated values of
 ${\theta _\parallel }$ and
 ${\theta _ \bot }$ as functions of
 $L/{d_l}$. Also shown are the values for a binary hard-sphere distribution, calculated by the theoretical formula of Ashcroft & Langreth (Reference Ashcroft and Langreth1967). The theoretical formula is not shown here due to its complex form, and the readers can refer to the original paper of Ashcroft & Langreth (Reference Ashcroft and Langreth1967) and the paper of Bressel, Wolter & Reich (Reference Bressel, Wolter and Reich2015) for more information. As shown in figure 9, the simulated values of
 ${\theta _ \bot }$ are in good agreement with the theoretical values, which means that the distribution of the relative position between small and large particles on the horizontal plane is homogeneous. The simulated values of
 ${\theta _\parallel }$ increase with
 $L/{d_l}$ and obviously deviate from the theoretical values when
 $L/{d_l} > 7$, indicating the critical length scale of the onset of instability for the simulated case is approximately
 $7{d_l}$. When clusters are developed, the distributions of the relative velocity and the granular temperature in space are not generally homogeneous. For example, their values are small in a cluster but large at the surface of a cluster (Liu & Hrenya Reference Liu and Hrenya2018). Therefore, using domain-averaged quantities to calculate the particle–particle drag force is not appropriate. It can be seen from figure 8(b) that our method is more robust than that of Zhao & Wang (Reference Zhao and Wang2021) in the current range of domain size. This may be attributed to the use of the relative velocity in a local region, the distribution of which should be less affected by the instability.
The structure factors of  $\kappa = 2{\rm \pi} /L$ are given as functions of the domain size. Here,
 ${\theta _\parallel }$ and
 ${\theta _ \bot }$ are the structure factors in the streamwise and spanwise directions, respectively. For reference, the structure factor predicted by Ashcroft & Langreth (Reference Ashcroft and Langreth1967) for a binary hard-sphere fluid is given by circles. The slight fluctuation of the theoretical values is caused by the minor change of
 ${x_s}$.