INTRODUCTION
The short wavelength (extreme ultraviolet (EUV)/soft X-ray) radiation enables us to achieve a higher resolution than in the case of visible or ultraviolet (UV) radiation. This is extremely important for biological applications (imaging of sub-cellular structures), for X-ray lithography (aiming at higher degree of integration in microprocessors, memories, etc. with smaller and smaller elements), as well as for dense plasma diagnostics (e.g., for radiography/interferometry/shadowgraphy, where in parallel to high resolution, nearly solid state critical density for these wavelengths plays an important role). Another feature of EUV/soft X-ray radiation is its high energy quanta: the individual quanta of this radiation can induce such processes that with visible/near UV quanta, only as double- or multi-photon ones would be possible. Among such processes are photoluminescence, photoexcitation/photoionization, inner-shell processes, etc. Another application could be found in biology, where single photon radiation damage can be studied. Moreover, in the case of amplified emission/lasing, the radiation divergence is small; the sample can be placed at a much larger distance from the source, which enables a sufficient additional protection against particles emitted from there.
Considering discharge-based radiation sources in EUV/soft X-ray region, first we have to mention hot-spots of classical Z-pinches (Bernal & Bruzzone, Reference Bernal, Bruzzone and Sadowski2001). Unfortunately, their localization and the time of their appearance are unpredictable, which limits their applicability. Much better are X-pinches — exploding crossed wires in vacuum (Safronova et al., Reference Safronova, Kantsyrev, Fedin, Yilmaz, Hoppe, Nalajala, Douglass, McBride, Mitchell, Maxson, Hammer and Chittenden2006; Liu et al., Reference Liu, Zou, Wang, He and Zeng2008a, Reference Liu, Zou, Wang, Zeng and He2008b). Their overloading place and time are quite reproducible; however, they are “point sources” only — unsuitable for amplification of radiation. From lasing point of view, the best are capillary discharges (Kolacek, Reference Kolacek, Schmidt, Prukner, Sunka, Frolov, Straus, Martinkova, Krokhin, Guskov and Merkulev2003), which can be very stable (due to proximity of wall), which have already shown a strong amplification (up to saturation) — especially on Ne-like Ar (λ = 46.9 nm), but which failed in attempts to shorten their wavelength (Tomasel et al., Reference Tomasel, Rocca, Shlyaptsev and Macchietto1997; Frati et al., Reference Frati, Seminario and Rocca2000; Eberl et al., Reference Eberl, Wagner, Jacoby, Tauschwitz and Hoffmann1997; Wagner et al., Reference Wagner, Eberl, Frank, Hartmann, Hoffmann and Tkotz1996) with one exception — an amplification on hydrogen-like carbon (λ = 18.2 nm) supplied into the capillary by ablation of capillary walls, which is irreproducible. Methods of amplification at shorter wavelength, amplification conditions, and an early stage of our experiments have been extensively discussed (Kolacek et al., Reference Kolacek, Schmidt, Prukner, Frolov and Straus2008). Here, it is worth repeating that the most perspective is the excitation pumping scheme, which for shorter wavelengths requires plasma from some metal (Pd, Ag, Cd, In, Sn) vapors with abundance of Ni-like ions. Despite there are methods, how to feed metal vapors in the capillary (Kolacek et al., Reference Kolacek, Schmidt, Prukner, Frolov and Straus2008), due to metal deposit remaining on a solid capillary wall, it is preferred to use a capillary with liquid — ever fresh — wall, which is created during wire explosion in water (Kolacek et al., Reference Kolacek, Maenchen and Schamiloglu2005). Originally, it was expected that a potential threat of channel fast expansion will be mitigated by a local liquid compression (to the GPa pressure range) by linearly focused cylindrical shock wave. However, at present, it seems that such threat is unsubstantiated.
A recent paper (Clerouin et al., Reference Clerouin, Renaudin, Laudernet, Noiret and Desjarlais2005) describes different behavior of conductivity at low densities for high (3×10⁴ K) temperatures in an Encient a Plasma Isochore (EPI) facility in France. Their explanation of metal-nonmetal transition (based on quantum molecular dynamics simulations) was later successfully applied to the description of exploding wires in vacuum.
Contrary, the exploding wire in water never has a low density environment. Our wire is relatively thick (Ø0.2 mm), highly conducting (Ag), and the current rise-rate is sufficiently high (>4×10¹¹ A/s). Due to that the current is fully skinned (flows in a thin layer at the wire surface). As soon as the wire surface is heated to slightly above 100°C, water at the outer side of the wire surface starts to boil creating a thin layer of water vapor, which increases extremely the local pressure, but which also well separates/isolates the wire and the water. The thickness of water vapor layer is given by a dynamic equilibrium: as soon as more water is evaporated, the pressure steeply increases and the water condense again — and contrarily. In the later stage, there is a strong thermal electron emission into the vapor, but because of a strong local magnetic field, and because of nearly solid-state vapor density, the plasma is weakly ionized; moreover, it is strongly collisional with a high recombination rate. For the similar reason, the photoionization is also inefficient. Therefore, the current flowing through the water-vapor-layer is very small, and its contribution to the total current is negligible. Probably changed balance of this process is responsible for transition to high-power discharges with life-time longer than solid/liquid state of the wire. The electro-thermodynamic processes in the wire at low power limit are modeled as a first approximation.
MODELING
The current starts to flow along the surface of the wire. If the characteristic time of the process is short in comparison with the current-diffusion-time, we call this the skinned current. The current diffusion in a cylindrically symmetric case is governed by equation
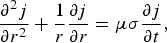
where j is the current density in the wire, μ is the permittivity, and σ is the conductivity — variable according to local temperature in the wire. For numerical calculations, the wire is divided into cylindrical layers with the central radius r i and of the thickness Δr, while the process is divided into time intervals centered at t j and of the length Δt. Then Eq. (1) can be re-written
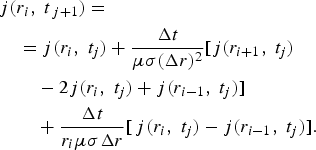
In each new time interval, the new current density distribution in inner layers is calculated using Eq. (2), transformed to total layer-currents, which are added, and the difference from the total experimental current is input into the outer layer as a current/current-density increment. From the current in each layer, and its resistance, the local dissipated power is calculated. The new local temperature is determined from the calorimetric equation (which includes the phase transitions) and from the equation of thermal diffusion

where T is the temperature, and α is the coefficient of thermal diffusion. Similarly, as in the foregoing case, this equation can be re-written for numerical calculation
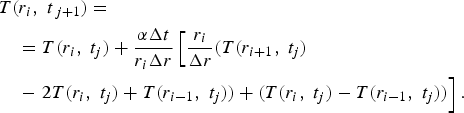
The new temperature serves for determination of new layer-resistivities and conductivities for the next step of the calculations.
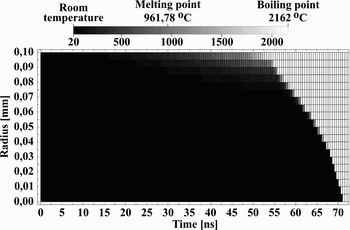
The result of modeling of the time development of temperature field in the wire cross-section for our experiment (discharge current amplitude 40 kA, discharge current half-period 200 ns, Ag wire Ø200 µm×32 mm) is shown in the Figure 1.
Time development of the temperature field. Horizontal axis gives time since the current onset, vertical axis gives Ag wire radius, the gray-scale of temperature is shown above.

EXPERIMENT
Apparatus
Our apparatus CAPEX-U (Fig. 2) consists of a Marx generator with erected capacity 12.5 nF, erected voltage 600 kV, and stored energy 2.25 kJ, fast capacitor 12.7 nF with characteristic impedance 1.7 Ω, and laser-triggered spark gap separating the load (exploding wire) from the above described driving part. The driving current amplitude can be as high as ~120 kA and its quarter-period is ≈100 ns; its waveform is measured by the Rogowski coil.
Apparatus CAPEX-U with water-filled experimental chamber for wire explosion in water.

The exploding wire is placed in a water-filled experimental chamber (Ø400 × 100 mm) with a possibility to generate pulse multi-streamer discharge at its inner cylindrical surface. Such discharge initiates cylindrical pressure wave that propagates toward the chamber axis; if its amplitude is sufficient, it transforms into a shock wave, which is capable to increase the pressure locally in its focus (at the axis) up to GPa region (Kolacek, 2008).
Experiments with Long Wire
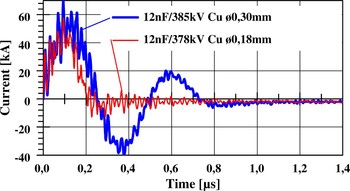
Our first experiments were performed with two modules of experimental chamber joined together (total length 20 cm); in which 200 mm long wires were exploded. The current flowing through wires of various diameters indicated that the energy in our device is just sufficient for wire evaporation, but insufficient for heating, and maintenance of a plasma channel. Therefore, immediately after the wire evaporation, the plasma channel is closed by the surrounding water, and the remaining charge is slowly discharged through water due to its finite conductivity (Fig. 3).
(Color online) Current through 200 mm long wire exploding in water; thinner wire (red curve) evaporates sooner than the thicker one (blue curve).

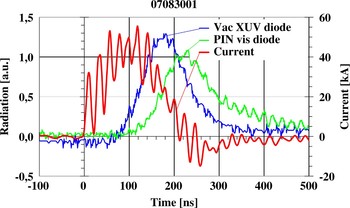
Simultaneously, the axial radiation output (patent pending) was solved. The chamber was extended in the axial direction by pneumatically controlled vacuum valve and about 1 m long evacuated drifting tube. At the end of this tube, both the vacuum photodiode with gold photocathode and the PIN diode for visible range were placed. Simultaneously, the current flowing through the exploding wire was detected by the Rogowski coil. Since a small viewing aperture is opened — only for narrow beam of paraxial rays, the initial corona glowing around the wire is not visible (Fig. 4). Only as soon as the wire is evaporated and turned in a plasma channel (inclusive its relatively colder ends), the radiation can pass through the aperture, and be registered by the detectors. However, in this moment (near the current maximum), it is already strongly heated, and it radiates exclusively in the XUV/soft X-ray region. Only a few tens of nanoseconds later, when the plasma channel starts to cool-down, also the visible radiation appears, and lasts longer than the radiation in the soft X-ray region. At that time, it was to our knowledge for the first time, when XUV/soft X-ray radiation from the discharge/exploding wire in water was measured. This simultaneous measurement gives also the evidence that the detected radiation comes from the inner part of experimental chamber. If it had come from the end (facing) part of the wire only, the visible radiation would have appeared the first.
(Color online) Signal of vacuum XUV photodiode with gold photocathode (blue solid line) and signal of PIN diode for visible range (green line); both detectors are placed at the end of axial evacuated drifting tube. Signal of Rogowski coil (red) indicates the current through the exploding wire. The Cu exploding wire has Ø0.18 mm.

Experiments with Short Wire
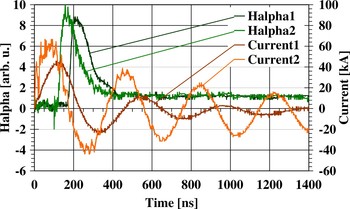
After the first experiments and the rough estimates, it was clear that for the stored energy, a much smaller mass has to be used. Therefore, the experimental chamber was reduced to one module only (100 mm in length), and the wire was shortened from 200 mm to 20 mm, while the rest was substituted by a brass rod Ø5×80 mm. In this case, the stored energy was sufficient for evaporation of Ø0.2 × 20 mm Ag wire, and for heating and maintenance of plasma channel. In Figure 5, it is visible that the shot with higher current amplitude has a shorter current half-period — probably because of smaller plasma inductance due to broader discharge channel. Moreover, at these shots, a plastic light-guide was fixed in the wire vicinity to collect and transmit radially emitted visible radiation; this radiation was filtered by Hα-line filter and registered by a photomultiplier (see also Fig. 5).
(Color online) Current and appropriate Hα-line intensity measured by photomultiplier with Hα-line filter.

A non-zero signal on this wavelength indicates that around the wire a layer of water vapor is created, in which some molecules are destroyed to hydrogen and oxygen atoms that are excited. According to simplified model (presented in this paper in the section on Modeling), the surface of the wire is heated to 100°C in 17 ns, and to 200°C in 24 ns. On the other hand, the Hα-line signal appears 120 ns (at 60 kA current amplitude) or 170 ns (at 40 kA current amplitude) after the current onset. This delay can be explained partially by retarded heating of the wire surface due to increased pressure and/or due to water-cooling, which results in later creation of water-vapor layer and partly by some relaxation time, necessary for disintegration of water-vapor molecules and excitation of their atoms. For better agreement a refined model is desirable.
However, a non-zero signal on Hα-line wavelength can be interpreted also as a part of the black-body radiation of the heated wire. For this purpose, another plastic light-guide to previously used plastic light-guide was added, which collected and transmitted the axially emitted visible radiation. Radiation from both light-guides was spectrally resolved (by Jobin-Yvon HR 320 visible spectrograph) and detected (by PCO Sensicam scientific CCD camera) — see Figure 6, lower part. The upper part of the Figure 6 contains binned spectra and the fitted profiles.
(Color online) Hα-line radiation collected and transported through a plastic light-guide, dispersed by Jobin Yvon HR320 spectrograph and detected by PCO Sensicam CCD camera: upper spectrum in the lower part of the Figure — collected in the radial direction, lower spectrum in the lower part of the Figure — collected in the axial direction. Upper part of the Figure gives binned spectra and the fitted profiles.

Therefore, it is proved that in our experiments (contrary to similar experiments performed in Technion — Israel Institute of Technology (Haifa, Israel) — see Fedotov, Reference Fedotov2008) a thin layer of water vapors is created around the exploding wire, which creates an extreme local pressure, and reduces significantly an energy flow from wire to water.
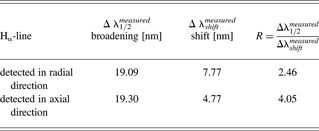
The Hα-line is extremely broad (19.1 nm for the radially collected emission, 19.3 nm for the axially collected one), and shifted (7.77 nm for the radial collection, 4.77 nm for the axial one). The main broadening is probably the impact broadening by neutral perturbers (Van der Waaĺs interaction characterized by an inverse power law ~C 6/r 6 (C 6 being a constant of interaction, r being the distance of perturbers)). Then the spectral line has so called Lorentz- or dispersion-profile (see e.g., Traving, Reference Traving and Lochte-Holtgreven1968))

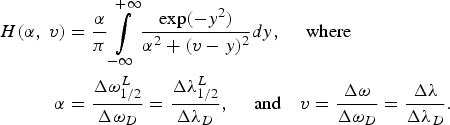
where Δω1/2L is the Lorentz profile full width at half maximum (FWHM), ΔωshiftL is the Lorentz profile shift. According to Lindholm-Foley collision theory, the ratio R =Δω1/2L/ΔωshiftL = Δλ1/2L/ΔλshiftL is for Van der Waals interaction equal to 2.75; according to Margenau is the same parameter R = 2.78. The measured broadenings and the shifts of Hα line in our experiments are summarized in the Table 1. The wavelength calibration was performed with the help of Hg lamp and He-Ne laser. While for Hα line detected in a radial direction, the ratio R is in reasonable agreement with values calculated for Van der Waals interaction, and the Lorentz-profile fits the measured curve quite well (see Fig. 6), the R for the axial direction differs too much from the theoretical value, and also the fitted Lorenz-profile is not a suitable approximation. Therefore, it is supposed that the radially detected profile depicts mainly very bright phase with initial processes on the wire-water boundary, when a dense cold water-vapor layer around the wire is created, where the main type of interaction is Van der Waals one. Contrary, the axial detection does not see this process, because it is shielded by the aperture; hence, the axially detected profile depicts the later, less bright phase, when the shock wave propagates away from the place of its birth, the local pressure falls down, and the channel starts to increase its temperature. Therefore, the resulting profile is a convolution of the Lorentz-profile (5) — reflecting e.g., Van der Waals broadening and the Gaussian-profile
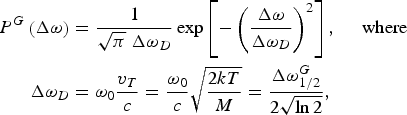
(reflecting Doppler broadening). This is a well-known Voigt function H(α, v)
The broadenings and the shifts of Hα line in our experiments
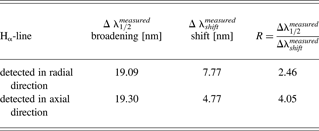
In the case of axial detection, the Lorentz broadening was determined from the shift of spectral line (the measured shift Δλshiftmeasured = 4.77 nm was multiplied by the theoretical value of R = 2.75, which yields Δλ1/2L = 13.12 nm). The remaining broadening was attributed to the Doppler one. The resulting Voigt curve is also shown in Figure 6 and it evidently approximates better the experimental profile than a simple Lorentz curve.
DISCUSSION
Knowledge of the width of the Lorentz curve in the case of Van der Waals broadening enables us to calculate the particle density n and the pressure p (=nkT), k being the Boltzmann constant, T being the absolute temperature. According to already mentioned Lindholm-Foley collision theory, the profile width (FWHM) ω1/2L at Van der Waals broadening (in ω scale) is (Traving, Reference Traving and Lochte-Holtgreven1968)
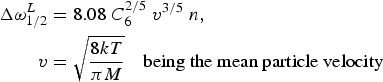
n being a particle density, and C 6 being an already mentioned constant of interaction. This constant is calculated for each transition separately with the help of quantum mechanics, namely

where C 6,j, and C 6,j′ are interaction constants for j and j′ energy levels. For our purpose, the simplest Rydberg formula was used

where Z is the ion charge (for neutral particles Z is defined to be 1), χi is the ionization potential in eV (for hydrogen χi = 1312 eV), χj is the excitation potential of j level in eV (for hydrogen χ1 = 10.2 eV, χ2 = 12.09 eV, …). Therefore, for Balmer-alpha transition C 6, Balmer-alpha = 3.16×10⁻³⁰ and from (8) it is possible to calculate n. Substitution of the line broadening observed at radially collected radiation gives particle density n ~ 2 × 1021 cm−3 ~ 2 × 1027 m−3, which results in pressure p ~ 6.4 × 10⁷ Pa ~ 632 atm.
Similarly, substitution into (8) of the part of broadening attributed to the Lorentz one at axially collected radiation yields the particle density lower than in previous case: n ~ 7.4×1019 cm−3 ~7.4×1025 m−3; however, the remaining broadening — attributed to the Doppler one — is as high as 3 nm, which gives temperature 3.5 keV. That indicates that the pressure reaches locally value as high as p ~ 4×10¹⁰ Pa ~ 4×10⁵ atm. Obviously, another composition of broadening mechanisms can give substantially different and probably more acceptable results.
CONCLUSION
The main aim of this paper is to study processes at wire explosion in water and find factors that limit fast energy deposition into the system. Namely, sufficiently high and fast energy deposition enables to create abundance of Ni-like ions of active element (Ag in our case), and, moreover, a population inversion on two of its energy levels.
This paper deals with explosion of “thick” wire in water, when skin effect dominates. In this case, the wire diameter is so large that the current does not succeed to diffuse to the wire axis prior to melting and evaporating the periphery wire-layers. The periphery layers are heated: as soon as the temperature of the adjacent water layer reaches 100°C, water evaporates and creates water-vapor-layer, which retards thermal diffusion to water, increases locally the pressure, which increases not only a boiling point of water, but also melting and boiling points of metal, and influence also other material constants. In other words — only such amount of water is evaporated, which is allowed by the local pressure increase. Our simplified model respects radial and temporal changes of material “constants” (e.g., conductivity), but these changes are function of temperature only (mainly because their dependence on pressure is not known). That is obviously one of reasons, why — according to model — wire-surface temperature 100°C is reached in 17 ns and 200°C in 24 ns, while the onset of Hα-line emission is observed well after 100 ns; an additional reason may be that the water-vapor-layer remains cold and unexcited well after its creation. Our measurements of Hα-line profile confirm that in our experiments a water vapor layer is created, which generates enormous increase of pressure. This is indirectly confirmed by a clearly visible self-absorption dip at the profile maximum, despite the water vapor layer is probably very thin. However, our numerical results should be taken with an extreme caution — mainly because of uncertainty of interaction constant C 6. Besides that the interpretation of axially registered radiation takes into account two broadening mechanisms only (Van der Waals and Doppler ones). In reality, in this later stage, the Stark broadening will also be present, but we miss any idea what fraction of the total broadening should be attributed to it. Anyhow, any other broadening mechanism will reduce the fraction attributed to the Doppler broadening, and, hence, it will reduce values of temperature and pressure found in the previous section.
In general — the smaller amount of active substance is heated, the higher temperature can be reached. That is why we reduced the wire length (from 200 mm to 20 mm) and that is why we prepare reduction of wire diameter (from 200 or 300 µm to 25 µm). However, we have to be aware that further reduction in length can increase the role of “end effects” and than further reduction in diameter can bring us to a “thin” wire limit: in this case, the current very soon starts to flow through the whole cross-section. Nearly, simultaneously the wire starts to melt and starts to boil in the whole cross-section. During boiling a metal-vapor bubbles appear in the whole volume, conductivity drops down, and the current starts to flow through the wire corona (in the water-vapor region). (Similar situation appears during wire explosion in vacuum.) Since this moment, the metallic region is not ohmically heated any more, and the only heating is that by adiabatic compression, which, in the case of dense core, has very limited effect.
In the near future, a numerical model should be refined to answer what power input is sufficient for creation of abundance of Ni-like ions (necessary for excitation pumping of EUV laser on metal vapor). Simultaneously, EUV radiation emitted along the wire axis should be spectrally analyzed to compare the metal-vapor-plasma temperature with that predicted by the model. This work is in progress.
ACKNOWLEDGMENT
The experimental part of this work was performed under auspices and with the support of the Grant Agency of the Academy of Sciences CR (contracts KAN300100702 and KJB100430702), the theoretical part of this work was supported by the Ministry of Education, Youth, and Sports of the Czech Republic (contracts LA08024 and LC528).