1 Introduction
The interaction of an electromagnetic pulse with the electronic spins in metallic or magnetic nano-objects has been the object of intense investigations, both theoretical and experimental, over the past few decades (Bigot & Vomir Reference Bigot and Vomir2013). It is well known that spin effects can play a decisive role in nanometric systems, most notably the Zeeman effect (coupling the spin to an external magnetic field) and the spin–orbit interaction (coupling the spin to the orbital motion of the electron). In particular, the ultrafast loss of magnetization observed in ferromagnetic nano-objects (Beaurepaire et al. Reference Beaurepaire, Merle, Daunois and Bigot1996; Bigot, Vomir & Beaurepaire Reference Bigot, Vomir and Beaurepaire2009; Bigot & Vomir Reference Bigot and Vomir2013) has been linked to various spin-dependent mechanisms, although its fundamental origin is still being debated. Metallic and magnetic nano-objects have many potential technological applications, which include to biology and medicine where they can be used to absorb electromagnetic energy and release it as heat to destroy cancer cells (hyperthermia) (Mehdaoui et al. Reference Mehdaoui, Tan, Meffre, Carrey, Lachaize, Chaudret and Respaud2013). In plasma physics, polarized electron beams of high spin polarization can now be created and precisely manipulated in the laboratory (Wu et al. Reference Wu, Ji, Geng, Yu, Wang, Feng, Guo, Wang, Qin and Yan2019, Reference Wu, Ji, Geng, Thomas, Büscher, Pukhov, Hützen, Zhang, Shen and Li2020; Nie et al. Reference Nie, Li, Morales, Patchkovskii, Smirnova, An, Nambu, Matteo, Marsh and Tsung2021). Recently, numerical simulations of spin-polarized electron beams interacting with strong laser pulses were performed by Wen, Keitel & Bauke (Reference Wen, Keitel and Bauke2017); Wen, Tamburini & Keitel (Reference Wen, Tamburini and Keitel2019).
From a fundamental point of view, modelling the $N$ -body dynamics of a system of particles possessing both charge and spin represents an ambitious theoretical and computational challenge. Several approaches have been proposed in recent decades to tackle this difficult problem, which rely either on hydrodynamic equations (Moldabekov, Bonitz & Ramazanov Reference Moldabekov, Bonitz and Ramazanov2018) or on wave-function-based methods such as density functional theory (DFT) (Krieger et al. Reference Krieger, Dewhurst, Elliott, Sharma and Gross2015).
Here, we will consider a possible alternative that relies on the use of the phase space models inspired from classical plasma physics, where the system is governed by a probability distribution function that evolves according to a kinetic equation (Manfredi, Hervieux & Hurst Reference Manfredi, Hervieux and Hurst2019). The quantum equivalent of the classical distribution function can be obtained from Wigner's phase space representation of quantum mechanics. In this representation, which is completely equivalent to the more standard Schrödinger or Heisenberg representations, the state of a quantum system can be represented by a function $f$ of the phase space variables. The Wigner function evolves according to an integro-differential equation that reduces, in the classical limit, to the Vlasov equation. The Wigner function can be used to compute averages as in the classical case, but should not be considered as a proper probability distribution, because it can take negative values.
If one retains the spin degrees of freedom, the Wigner distribution function becomes a $2 \times 2$ matrix, whose elements represent the spin-up and spin-down components, as well as entangled states (Arnold & Steinrück Reference Arnold and Steinrück1989). The corresponding semiclassical matrix spin Vlasov equation, coupled to Maxwell's equations, constitutes a viable mean-field model where the electron orbital motion is treated classically, while the spin is a fully quantum variable (Hurst et al. Reference Hurst, Morandi, Manfredi and Hervieux2014; Hurst, Hervieux & Manfredi Reference Hurst, Hervieux and Manfredi2017). This approach was recently used to study the generation of spin currents in ferromagnetic thin films (Hurst, Hervieux & Manfredi Reference Hurst, Hervieux and Manfredi2018).
A different, but equivalent, approach consists in defining a scalar distribution function that evolves in an extended phase space $({\boldsymbol x},{ {{\boldsymbol p}}}, {\boldsymbol s})$ , where the spin is a further variable (in addition to the position and the momentum) described by a vector on the unit-radius sphere (Marklund, Zamanian & Brodin Reference Marklund, Zamanian and Brodin2010; Zamanian, Marklund & Brodin Reference Zamanian, Marklund and Brodin2010a; Zamanian et al. Reference Zamanian, Stefan, Marklund and Brodin2010b; Asenjo et al. Reference Asenjo, Zamanian, Marklund, Brodin and Johansson2012). The geometric structure of this scalar spin Vlasov model has been highlighted by Marklund & Morrison (Reference Marklund and Morrison2011).
Both approaches (extended phase space and matrix Wigner function) are mathematically equivalent. From a computational point of view, the extended phase space method is more easily simulated using particle-in-cell (PIC) methods, because the corresponding distribution function is transported along classical trajectories in the extended phase space. In contrast, the matrix Wigner function method is more naturally amenable to grid-based Vlasov codes, because the corresponding distribution function only depends on the six variables of the ordinary phase space.
In this work, we will develop and validate a PIC code for the self-consistent spin Vlasov–Maxwell (spin-VM) equations in the extended phase space. The adopted model is semiclassical, in the sense that the orbital electron motion is treated in a classical fashion, while the spin dynamics is fully quantum. The electron spin intervenes in the dynamics via the Zeeman effect and a precession term, which arise from the coupling of the spin with a self-consistent or external magnetic field. These are the first non-relativistic corrections to the spin-less dynamics.
Despite the plentiful theoretical developments, numerical works on the simulation of spin effects in plasmas are relatively scarce. Cowley, Kulsrud & Valeo (Reference Cowley, Kulsrud and Valeo1986) were perhaps the first authors to perform computer simulations of polarized electrons in a plasma using a semiclassical kinetic approach. More recently, Brodin, Holkundkar & Marklund (Reference Brodin, Holkundkar and Marklund2013) developed a PIC code accounting for the magnetic dipole force and the magnetization currents associated with the electron spin. Their work does not follow the extended phase space approach adopted here, but rather considers two separate spin-up and spin-down populations for the electrons, which is less general (this is known as the collinear approximation in condensed matter physics). In a similar context, Tonge, Dauger & Decyk (Reference Tonge, Dauger and Decyk2004) and Dauger, Decyk & Dawson (Reference Dauger, Decyk and Dawson2005) have extended classical PIC methods to the quantum regime (but without spin) using an approach based on Feynman path integrals. Very recently, PIC simulation methods for particles with spin were developed and validated by Li et al. (Reference Li, Decyk, Miller, Tableman, Tsung, Vranic, Fonseca and Mori2021) for applications to laser–plasma interactions.
Further, to reduce the dimensionality of the problem, we consider a simplified model widely used to study laser–plasma interactions (Ghizzo et al. Reference Ghizzo, Bertrand, Shoucri, Johnston, Fijalkow and Feix1990; Huot et al. Reference Huot, Ghizzo, Bertrand, Sonnendrücker and Coulaud2003; Li, Sun & Crouseilles Reference Li, Sun and Crouseilles2020) and assume that all quantities depend spatially only on the longitudinal co-ordinate $x$ (the direction of propagation of the incident electromagnetic wave). We also make the hypothesis that the electron distribution function can be written in the form:

where $f(t, x, p_x, {\boldsymbol s}) = \int F(t, x, {\boldsymbol p}, {\boldsymbol s}) \,\mathrm {d}{\boldsymbol p}_\perp$ and ${\boldsymbol p} = (p_x, {\boldsymbol p}_\perp ) = (p_x, p_y, p_z)$
 . Equation (1.1) is equivalent to stating that the electrons are cold in the perpendicular plane. Note that this ansatz is exact, in the sense that, if satisfied by the initial condition, it is preserved along the time evolution of the Vlasov–Maxwell equations. By using this approximation, the extended phase space is reduced from nine dimensions to five (one in space, one in velocity and three for the spin).
The Poisson structure proposed by Marklund & Morrison (Reference Marklund and Morrison2011) lays the bases to construct a geometric PIC method (Qin et al. Reference Qin, Liu, Xiao, Zhang, He, Wang, Sun, Burby, Ellison and Zhou2015; Xiao et al. Reference Xiao, Qin, Liu, He, Zhang and Sun2015; He et al. Reference He, Sun, Qin and Liu2016; Burby Reference Burby2017; Kraus et al. Reference Kraus, Kormann, Morrison and Sonnendrücker2017; Morrison Reference Morrison2017) for the spin-VM equations. The geometric PIC method adopted here is based on a compatible finite-element approximation of the electromagnetic fields, combined with a particle approximation of the distribution function. Following Kraus et al. (Reference Kraus, Kormann, Morrison and Sonnendrücker2017), we have chosen spline spaces, which is a family of compatible finite elements in the sense that this approach enables a natural derivation of discrete versions of the differential operators. The so-obtained finite-dimensional system of ordinary differential equations (ODEs) possesses a non-canonical Poisson structure. Subsequently, one has to implement a time discretization for this large ODE system. This is performed by decomposing the discrete Hamiltonian into several subsystems (Crouseilles, Einkemmer & Faou Reference Crouseilles, Einkemmer and Faou2015; He et al. Reference He, Qin, Sun, Xiao, Zhang and Liu2015; Li et al. Reference Li, He, Sun, Niesen, Qin and Liu2019) and using a time-splitting method. It turns out that each of the subsystem can be solved exactly in time, which means that their composition is still a Poisson map and high-order splitting schemes can thus be easily constructed.
The resulting spin-PIC code is tested on a well-studied problem in the physics of laser–plasma interactions, namely stimulated Raman scattering (SRS). The SRS describes the decay of an incident electromagnetic (em) wave into a scattered em wave and a plasma (Langmuir) wave, through a parametric instability. First, we benchmark our code against analytical results and former simulations carried out in the spin-less regime. Then we exploit the full spin Vlasov–Maxwell model to study the effect of the electron spin polarization on the Raman instability.
The rest of the paper is organized as follows. In § 2, the spin Vlasov models are presented together with their Poisson bracket formulation. In § 3, the geometric electromagnetic PIC (GEMPIC) framework (Kraus et al. Reference Kraus, Kormann, Morrison and Sonnendrücker2017) is recalled and extended to our spin context. In § 4, the Hamiltonian time-splitting technique is described, and finally in § 5,several numerical simulations of the spin-dependent Raman scattering are presented and discussed. Finally, we draw our conclusions in § 6.
2 Spin Vlasov–Maxwell equations
2.1 General formalism
Here, we recall the basics of the spin Vlasov–Maxwell system in the extended phase space (Marklund et al. Reference Marklund, Zamanian and Brodin2010; Zamanian et al. Reference Zamanian, Marklund and Brodin2010a; Marklund & Morrison Reference Marklund and Morrison2011; Manfredi et al. Reference Manfredi, Hervieux and Hurst2019), satisfied by the scalar electron distribution function:

and the self-consistent electromagnetic fields $({\boldsymbol E}, {\boldsymbol B}): (t, {\boldsymbol x})\mapsto ({\boldsymbol E}, {\boldsymbol B})(t, {\boldsymbol x})\in \mathbb {R}^3\times \mathbb {R}^3$ . The spin Vlasov–Maxwell equations read as

In the original paper on the scalar spin Vlasov equation (Zamanian et al. Reference Zamanian, Marklund and Brodin2010a), one further term was present, which has the form of a modified quantum magnetic dipole term:

In subsequent works by the same authors, this term was often ignored because of the semiclassical approximation made there (Brodin et al. Reference Brodin, Marklund, Zamanian, Ericsson and Mana2008, Reference Brodin, Marklund, Zamanian and Stefan2011; Brodin & Stefan Reference Brodin and Stefan2013). This can be justified by assuming that variations of $f$ in spin space are of moderate size (for a more detailed discussion, see Zamanian et al. Reference Zamanian, Marklund and Brodin2010a; Brodin et al. Reference Brodin, Marklund, Zamanian and Stefan2011). It should also be pointed out that this modified quantum dipole term contains derivatives in both real and spin space, thus making the PIC algorithm much more involved. For these reasons, such an extra term is neglected in the present developments and will be left to future works on this topic.
The coupling between the Vlasov and Maxwell equations is ensured by the current and the density $({\boldsymbol J}, \rho ) : (t, {\boldsymbol x})\mapsto ({\boldsymbol J}, \rho )(t, {\boldsymbol x})\in \mathbb {R}^3\times \mathbb {R}_+$ , defined respectively as

Here, $q = -e$ is the electron charge, $\mu _e = {q\hbar }/{2m}$
 is the Bohr magneton, $\hbar$
 is the Planck constant, $m$
 is the electron mass, $n_0$
 is the fixed ion density, and $\epsilon _0, \mu _0$
 denote the permittivity and the permeability of vacuum (which satisfy $\epsilon _0 \mu _0 = c^{-2}$
 , with $c$
 being the speed of light). We further note that, in this model, the spin vector ${\boldsymbol s}$
 is dimensionless and has fixed length, i.e. $|{\boldsymbol s}| = 1$
 or ${\boldsymbol s} \in \mathbb {S}^2$
 . Hence, the effective phase space is actually 8-dimensional. However, to preserve the geometric structure that will be used in the forthcoming sections, we will consider that ${\boldsymbol s} \in \mathbb {R}^3$
 .
In the above Vlasov equation (2.2), the first three terms are the standard terms present in the spin-less case, the next term [$\boldsymbol {\nabla }({\boldsymbol s}\boldsymbol {\cdot } {\boldsymbol B})$ ] is the Zeeman effect and the last term (${\boldsymbol s} \times {\boldsymbol B}$
 ) represents the spin precession in the magnetic field. In (2.4), the second term in the current represents the curl of the internal magnetization owing to the electron spin. Further details can be found in the paper by Manfredi et al. (Reference Manfredi, Hervieux and Hurst2019).
We shall use normalized units, denoted by a tilde and defined as follows:

where we introduce the electron plasma frequency, the plasma skin depth and the scaled Planck constant:

The dimensionless version of (2.2) reads as

where we remove the tilde to simplify the notation. The above dimensionless version of the spin Vlasov–Maxwell model will be used throughout this work.
It has been shown by Marklund & Morrison (Reference Marklund and Morrison2011) that (2.7) enjoys a non-canonical Poisson structure that enables us to rewrite this complex system in a more compact way. Let us denote $\mathcal{M}=\{(f, {\boldsymbol E},{\boldsymbol B})|\,\boldsymbol {\nabla }\boldsymbol {\cdot }{\boldsymbol B}=0\}$ as the infinite dimensional manifold. The system (2.7) can be expressed using the Poisson bracket introduced by Marklund & Morrison (Reference Marklund and Morrison2011). For two functionals $(\mathcal {F}, \mathcal {G})$
 acting on ${\mathcal {M}}$
 , we consider the following Poisson bracket, which is the sum of the Vlasov–Maxwell bracket (Marsden & Weinstein Reference Marsden and Weinstein1982) and a bracket describing spin effects:

Here, $[\boldsymbol {\cdot },\boldsymbol {\cdot }] _{\boldsymbol {xp}}$ denotes the Lie bracket for two functions of $({\boldsymbol x},{\boldsymbol p})$
 . It was proven by Marklund & Morrison (Reference Marklund and Morrison2011) that the bracket (2.8) is indeed a Poisson bracket. With the Hamiltonian functional defined as follows:

the spin Vlasov–Maxwell system (2.7) can be written in a compact way, using $\mathcal {Z}:=(f,\boldsymbol {E},\boldsymbol {B})\in \mathcal {M}$ :

where $\{\boldsymbol {\cdot } , \boldsymbol {\cdot }\}$ is given by (2.8). This system is supplemented with an initial condition ${\mathcal {Z}}(t=0)={\mathcal {Z}}_0$
 .
2.2 Reduced spin Vlasov–Maxwell equations
Here, following Ghizzo et al. (Reference Ghizzo, Bertrand, Shoucri, Johnston, Fijalkow and Feix1990), we derive a reduced spin Vlasov–Maxwell model by considering the case of a plasma interacting with an electromagnetic wave propagating in the longitudinal $x$ direction and assuming that all fields depend spatially on $x$
 only. Choosing the Coulomb gauge $\boldsymbol {\nabla } \boldsymbol {\cdot } \boldsymbol A =0$
 , the vector potential ${\boldsymbol A}$
 lies in the perpendicular (transverse) plane, i.e. ${\boldsymbol A} = { (0, A_y, A_z) = }(0, {\boldsymbol A}_\perp$
 ). Using ${\boldsymbol E} = -\boldsymbol {\nabla } \phi - \partial _t {\boldsymbol A}$
 , we then obtain, using the notations ${\boldsymbol E} = (E_x, E_y, E_z) =(E_x, {\boldsymbol E}_\perp )$
 :

This prescription implies that the electric field is mainly electromagnetic in the transverse plane and mainly electrostatic in the longitudinal direction.
We then consider a distribution function of the form: $\delta (\boldsymbol {p}_\perp - \boldsymbol {A}_\perp ) f(t, x, p_x, \boldsymbol {s})$ , where $\boldsymbol {p}=(p_x,p_y,p_z)=(p_x,\boldsymbol {p}_\perp )$
 is the linear momentum and $\boldsymbol {p}- \boldsymbol {A}$
 is the canonical momentum. The above assumption on the distribution function is tantamount to prescribing that the plasma is cold in the transverse plane. After integration with respect to $\boldsymbol {p}_\perp$
 , the relevant extended phase space is reduced to five dimensions (instead of nine dimensions for the general case). The longitudinal variable $p_x$
 will be simply denoted by $p$
 in the rest of this paper.
The reduced spin Vlasov–Maxwell system satisfied by the electron distribution function $f(x, p, {\boldsymbol s}, t)$ ($x, p \in \mathbb {R}$
 and ${\boldsymbol s} \in \mathbb {R}^3$
 ), the electric field ${\boldsymbol E}(t, x) = (E_x, {\boldsymbol E}_\perp )(t, x) = (E_x, E_y, E_z)(t, x)$
 and the vector potential ${\boldsymbol A}(t, x) = (A_x, {\boldsymbol A}_\perp )(t, x) = (0, A_y, A_z)(t, x)$
 can be written as

This reduced spin Vlasov–Maxwell system also possesses a non-canonical Poisson structure. For any two functionals $\mathcal {F}$ and $\mathcal {G}$
 depending on the unknowns $f, {\boldsymbol E}$
 and ${\boldsymbol A}_\perp$
 , the Poisson bracket reads as

whereas the Hamiltonian functional, composed of the sum of kinetic, electric, magnetic and Zeeman (spin-dependent) energies, is defined by

Thus, the reduced spin Vlasov–Maxwell system of (2.12) can be reformulated as

where $\mathcal {Z}=(f, E_x,E_y,E_z,A_y,A_z)$ denotes the unknowns of the system, $\{\boldsymbol {\cdot }, \boldsymbol {\cdot } \}$
 is defined by (2.13) and the Hamiltonian $\mathcal {H}$
 is given by (2.14). In this work, periodic boundary conditions will be considered in the $x$
 and ${\boldsymbol s}$
 directions ($x\in [0, L], L>0, {\boldsymbol s}\in \mathbb {R}^3$
 ), and vanishing boundary condition in $p \in \mathbb {R}$
 . An initial condition ${\mathcal {Z}}(t=0)={\mathcal {Z}}_0=(f_0, {\boldsymbol E}_{0}, {\boldsymbol A}_{\perp , 0})$
 supplements the system. The Poisson bracket (2.13) can be derived from (2.8) using chain rules of functional derivatives based on a similar change of unknowns proposed by Li et al. (Reference Li, Sun and Crouseilles2020).
3 GEMPIC formalism for the reduced spin Vlasov–Maxwell system
In the framework introduced by Kraus et al. (Reference Kraus, Kormann, Morrison and Sonnendrücker2017), the Vlasov–Maxwell equations are discretized through a standard particle-in-cell ansatz for the distribution function and compatible finite elements for the electromagnetic fields. Then, the semi-discretization is obtained by inserting the ansatz into the Hamiltonian (2.14) and the Poisson bracket (2.13) of the reduced spin Vlasov–Maxwell equations. In this section, we will apply and detail the strategy for our spin Vlasov–Maxwell system (2.12).
Following Kraus et al. (Reference Kraus, Kormann, Morrison and Sonnendrücker2017), we consider the components of the electromagnetic fields separately, and we consider $E_x, B_y, B_z$ as 1-forms and $E_y, E_z, A_y, A_z$
 as 0-forms. The 0-forms and 1-forms are discretized in finite element spaces $V_0 \subset H^1$
 and $V_1 \subset L^2$
 , respectively ($H^1$
 denotes the Sobolev space). There exists a commuting diagram (see (
)) for the involved functional spaces in one spatial dimension (with periodic boundary conditions), between continuous spaces in the upper line and discrete subspaces in the lower line. The projectors $\varPi _0$ and $\varPi _1$
 must be constructed carefully to assure the diagram is commuting (Kraus et al. Reference Kraus, Kormann, Morrison and Sonnendrücker2017).

The basis for each of the finite dimensional spaces $V_0, V_1$ , with dim $V_k = N_k$
 (k=0, 1) is denoted as $\{ \varLambda ^0_j\}_{j=1,\ldots ,N_0}$
 and $\{ \varLambda ^1_j\}_{j=1,\ldots ,N_1}$
 . The dual bases of $V_0$
 and $V_1$
 are $\{\varSigma ^0_j\}_{j=1,\ldots , N_0}$
 and $\{\varSigma ^1_j\}_{j=1,\ldots , N_1}$
 , respectively, i.e. $\int \varSigma ^k_i \varLambda ^k_j \,\mathrm {d} x = \delta _{i, j}, k = 0, 1$
 .
In this paper, we choose B-splines as the basis functions, and $N_0 = N_1 = M$ . The spatial domain $[0, L]$
 is discretized by a uniform grid:

The B-splines basis functions $\{\varLambda ^0_j\}_{j=1,\ldots ,N_0}$ and $\{\varLambda ^1_j\}_{j=1,\ldots , N_1}$
 for $V_0=$
 span$\{\{\varLambda ^0_j\}_{j=1,\ldots ,N_0}\}$
 and $V_1=$
 span$\{\{\varLambda ^1_j\}_{j=1,\ldots ,N_1}\}$
 are given by

and

The important relation between $\varLambda ^1$ and $\varLambda ^0$


can be reformulated as

where $\mathbb {C}$ is a matrix of size $N_1 \times N_0 = M \times M$
 , given by

Then, each element of the finite-dimensional spaces $V_0$ and $V_1$
 can be expanded on their respective basis functions. For the electric field components $(E_x, E_y, E_z)\in L^2 \times H^1\times H^1$
 , these are approximated by $(E_{x, h}, E_{y, h}, E_{z, h})\in V_1\times V_0\times V_0$
 according to the following representation

whereas for the vector potential components $(A_y, A_z)\in H^1\times H^1$ , these are approximated by $(A_{y,h}, A_{z,h}) \in V_0\times V_0$
 according to

Regarding the distribution function $f(t, x, p, \boldsymbol {s})$ , we use the following representation

where $\omega _a$ , $x_a$
 , $p_a$
 and $\boldsymbol {s}_a$
 denote respectively the weight, the position, the momentum (velocity) and the spin co-ordinates of the $a$
 -th particle.
3.1 Derivation of the discrete Poisson bracket
Using the above approximation of the electromagnetic fields (3.8)–(3.9) and of the distribution function (3.10), we shall construct a discrete geometric structure (discrete Poisson bracket and discrete Hamiltonian) from which the equations of motion will be derived. Specifically, discrete functional derivatives are derived based on the discrete representation of the unknowns (3.8)–(3.9) (see Appendix A for more details), which are inserted into the continuous Poisson bracket (2.13) to derive the discrete Poisson bracket.
We introduce some notations to make the expressions simpler. First, we introduce the discrete time-dependent unknowns for the electromagnetic fields:

and for the particles (position, velocity and spin):

Moreover, we will need some matrix notations to take into account the fields–particles coupling:

Finally, we introduce the weight matrix and some matrices related to the spin particles:

Any functional ${\mathcal {F}}$ of a continuous representation of the approximated fields or distribution function ($f_h, E_{x,h}, E_{y, h}, E_{z, h}, A_{y,h}, A_{z,h}$
 ) is now considered as a new function $F$
 of the discrete unknowns (particles unknowns ${\boldsymbol {X}}, {\boldsymbol {P}}, {\boldsymbol {S}}$
 , and fields finite-element coefficients ${\boldsymbol {e}}_x, {\boldsymbol {e}}_y, {\boldsymbol {e}}_z, {\boldsymbol {a}}_y, {\boldsymbol {a}}_z$
 ), i.e.:

This representation enables us to replace all functional derivatives in (2.13) with their discrete counterparts (see Appendix A for more details). We then obtain the semi-discrete Poisson bracket:

By rearranging the terms, we are able to obtain the following finite-dimensional Poisson bracket:

where ${\boldsymbol u} = ({\boldsymbol X}, {\boldsymbol P}, {\boldsymbol S}, {\boldsymbol e}_x, {\boldsymbol e}_y, {\boldsymbol e}_z, {\boldsymbol a}_y, {\boldsymbol a}_z)^{\mathrm {T}}$ and the matrix $\mathbb {J}({\boldsymbol u})$
 is defined by

The following Theorem states that the bracket defined by (3.17)–(3.18) is indeed a Poisson bracket.
Proof. See Appendix B.
3.2 Discrete Hamiltonian and equations of motion
The discrete Hamiltonian is obtained by inserting the representation of the unknowns (3.8), (3.9) and (3.10) into the Hamiltonian (2.14). With ${\boldsymbol u} = ({\boldsymbol X}, {\boldsymbol P}, {\boldsymbol S}, {\boldsymbol e}_x, {\boldsymbol e}_y, {\boldsymbol e}_z, {\boldsymbol a}_y, {\boldsymbol a}_z)^{\mathrm {T}}$ , we have

Using the notations (3.11), (3.12) and (3.13) introduced in the preceding section, the above formula can be written more compactly as

From the discrete Poisson bracket (3.17)–(3.18) and the discrete Hamiltonian (3.20), the equations of motion then read as

Specifically, we obtain the following equations of motion:

where

and finally for $\frac {\partial H}{\partial {\boldsymbol S}}$ (recalling ${\boldsymbol {S}} = ({\boldsymbol s}_{1}, {\boldsymbol s}_{2}, \ldots , {\boldsymbol s}_{a}, \ldots , {\boldsymbol s}_{N_p})^{\mathrm {T}}\in \mathbb {R}^{3N_p}$
 ), we get for the spin variables of the $a$
 -th particle,

4 Hamiltonian splitting method
Once the semi-discretization is performed, the resulting Poisson system has to be integrated in time. Here, a Hamiltonian splitting method (Crouseilles et al. Reference Crouseilles, Einkemmer and Faou2015; Li et al. Reference Li, He, Sun, Niesen, Qin and Liu2019) is adopted, in which the solution is obtained as compositions of exact solutions of Hamiltonian subsystems. Hence, such resulting schemes are Poisson integrators in the sense of Hairer, Lubich & Wanner (Reference Hairer, Lubich and Wanner2002). Moreover, as we will see, each substep is explicit in time, and can be used to derive higher-order methods, which takes into account some specific commutator relations (Hairer et al. Reference Hairer, Lubich and Wanner2002; Casas et al. Reference Casas, Crouseilles, Faou and Mehrenberger2017). By splitting the discrete Hamiltonian $H$ given by (3.20) into the following four parts

where

we are led to solve the four corresponding Hamiltonian subsystems

where ${\boldsymbol u} = ({\boldsymbol X}, {\boldsymbol P}, {\boldsymbol S}, {\boldsymbol e}_x, {\boldsymbol e}_y, {\boldsymbol e}_z, {\boldsymbol a}_y, {\boldsymbol a}_z)^{\mathrm {T}}$ and the corresponding solution flows are denoted by $\varphi _t^{[H_p]}$
 , $\varphi _t^{[H_A]}, \varphi _t^{[H_s]}$
 and $\varphi _t^{[H_E]}$
 . Then, numerical solutions of (3.21) can be obtained, for instance, as a first-order Lie splitting or a second-order Strang splitting:

Let us also remark that higher-order splitting schemes can be easily constructed by a suitable composition of the subflows $\varphi _t^{[H_*]}$ (see Hairer et al. Reference Hairer, Lubich and Wanner2002; Casas et al. Reference Casas, Crouseilles, Faou and Mehrenberger2017). It is worth mentioning that each subflow $\varphi _t^{[H_*]}$
 can be solved exactly, which will be detailed in the following subsections.
4.1 Subsystem $H_p$

The subsystem corresponding to $H_p = ({1}/{2}){\boldsymbol P}^{\mathrm {T}}\mathbb {W}{\boldsymbol P}$ is $\dot {\boldsymbol u} = \mathbb {J}({\boldsymbol u})\boldsymbol {\nabla }_{\boldsymbol u} H_p$
 , or specifically

For this subsystem, we only need to compute ${\boldsymbol X}, {\boldsymbol {e}}_x$ at time $t$


Remark 4.1 Multiplying $\mathbb {C}^{\mathrm {T}}\mathbb {M}_1$ from the left with $\dot {\boldsymbol e}_x = -\mathbb {M}_1^{-1}\mathbb {\varLambda }_1({\boldsymbol X})^{\mathrm {T}}\mathbb {W}{\boldsymbol P}$
 , we get

As $\mathbb {\varLambda }_1({\boldsymbol X})\mathbb {C} = \partial _x\mathbb {\varLambda }_0({\boldsymbol X})$ , we get $\mathbb {C}^{\mathrm {T}} \mathbb {M}_1 \dot {\boldsymbol e}_x(t) = - \partial _x \mathbb {\varLambda }_0({\boldsymbol X})^\mathrm {T} \mathbb {W} {\boldsymbol P}$
 and using $\dot {\boldsymbol X} = {\boldsymbol P}$
 , we have

with $\mathbb {1}_{N_p}$ the vector of size $N_p$
 composed of $1$
 . Then, the discrete Poisson equation $\mathbb {C}^\mathrm {T} \mathbb {M}_1 {\boldsymbol e}_x(t) = - { \mathbb {\varLambda }_0({\boldsymbol X})^\mathrm {T}} \mathbb {W} \mathbb {1}_{N_p}$
 is always satisfied if it holds initially.
4.2 Subsystem $H_A$

The subsystem corresponding to $H_A$ is

In this subsystem, ${\boldsymbol X}, {\boldsymbol S}, {\boldsymbol e}_x, {\boldsymbol a}_y, {\boldsymbol a}_z$ are unchanged. In the following, we will use the identities defined in (3.13) and (3.23)

Then, for each component of ${\boldsymbol P}=(p_1, \ldots , p_a, \ldots , p_{N_p})$ , an explicit Euler integrator becomes exact because ${\boldsymbol a}_y(t)={\boldsymbol a}_y(0)$
 and ${\boldsymbol a}_z(t)={\boldsymbol a}_z(0)$
 ,

For the transverse electric field, we get

Remark 4.2 Formula (4.10) turns matrix–vector multiplications into vector–vector multiplications, which will significantly reduce the computational cost.
4.3 Subsystem $H_s$

The subsystem of ODEs corresponding to $H_s = {\mathfrak{h}} \,{\boldsymbol a}_z^{\mathrm {T}}\mathbb {C}^{\mathrm {T}}{\mathbb {\varLambda }}_1({\boldsymbol {X}})^{\mathrm {T}}\mathbb {W} {\boldsymbol S}_y - {\mathfrak{h}}\, {\boldsymbol a}_y^{\mathrm {T}}\mathbb {C}^{\mathrm {T}}{\mathbb {\varLambda }}_1({\boldsymbol {X}})^{\mathrm {T}}\mathbb {W} {\boldsymbol S}_z$ is

For this subsystem, we first solve $\dot {\boldsymbol S} = {({1}/{{\mathfrak{h}}})}\mathbb {S}({\partial H_{s}}/{\partial {\boldsymbol S}})$ . For the $a$
 -th particle, we have

where $Y_a = {\boldsymbol a}_y^{\mathrm {T}}\mathbb {C}^{\mathrm {T}}{\boldsymbol \varLambda }^1(x_a)$ , $Z_a = {\boldsymbol a}_z^{\mathrm {T}}\mathbb {C}^{\mathrm {T}}{\boldsymbol \varLambda }^1(x_a)$
 , ${\boldsymbol \varLambda }^1(x_a) = (\varLambda ^1_1(x_a), \ldots , \varLambda ^1_{N_1}(x_a))^{\mathrm {T}}$
 . Let us define the vector ${\boldsymbol r}_a = (0, Z_a, -Y_a) \in \mathbb {R}^3$
 , then the Rodrigues formula gives the following explicit solution for (4.14)

where $I$ is the $3\times 3$
 identity matrix.
Next, we integrate in time the equation on the transverse electric field to get (using $\dot {\boldsymbol X}=0$ )

where we recall ${\boldsymbol S}_{i}(\tau ) = (s_{1,i}, \ldots , s_{a,i}, \ldots , s_{N_p,i})^{\mathrm {T}}\in \mathbb {R}^{N_p}, \ i \in \{y, z\}$ , see (3.12). We then have to integrate in time the spin variable. This is done using (4.15)

Now we focus on the impulsion variable ${\boldsymbol P}$ . Using the fact that $\dot {\boldsymbol X}= {\boldsymbol 0}, \ \dot {\boldsymbol a}_y =\dot {\boldsymbol a}_z={\boldsymbol 0}$
 , we integrate in time each component of ${\boldsymbol P}$
 to get

4.4 Subsystem $H_E$

The subsystem corresponding to $H_E =({1}/{2}){\boldsymbol e}_x^{\mathrm {T}}\mathbb {M}_1{\boldsymbol e}_x + ({1}/{2}){\boldsymbol e}_y^{\mathrm {T}}\mathbb {M}_0{\boldsymbol e}_y + ({1}/{2}){\boldsymbol e}_z^{\mathrm {T}}\mathbb {M}_0{\boldsymbol e}_z$ is

Because $\dot {{\boldsymbol X}}={\boldsymbol 0}, \ \dot {\boldsymbol e}_x={\boldsymbol 0}$ , the equation on ${\boldsymbol P}$
 can be solved easily

Similarly, the transverse vector potential can be computed exactly in time:

5 Numerical simulations of stimulated Raman scattering with polarized electrons
This part is devoted to numerical simulations of a laser–plasma model using the geometric PIC method detailed in the preceding sections. Laser–plasma interactions play a decisive role in many areas of plasma physics, most notably inertial fusion and plasma accelerators. Recently, the interaction of an intense laser pulse with a polarized electron beam was studied numerically using PIC methods (Wen et al. Reference Wen, Keitel and Bauke2017, Reference Wen, Tamburini and Keitel2019). In these works, different models were developed based either on classical considerations or on the semiclassical limit of the Dirac Hamiltonian in the Foldy–Wouthuysen representation. The emission of radiation from the electrons was taken into account via the Landau–Lifshitz force.
One of the most topical problems in laser–plasma interactions is the efficient acceleration of charged particles (electrons) by large-amplitude longitudinal plasma waves. An efficient way to create such large-amplitude plasma waves involves the SRS mechanism (Forslund, Kindel & Lindman Reference Forslund, Kindel and Lindman1975), which can be viewed as a parametric instability. During SRS, an incident electromagnetic wave decays into a scattered electromagnetic wave and a Langmuir (plasma) wave, which is responsible for the electron acceleration (see figure 1). Our purpose is to investigate the effect of the electron spin on the SRS instability.
Schematic view of the geometry of the laser–plasma interaction during stimulated Raman scattering.

As the full system is rather complex, we will proceed step by step. First, we consider the SRS problem without spin, which was studied in several past works using a grid-based (Eulerian) Vlasov code (Ghizzo et al. Reference Ghizzo, Bertrand, Shoucri, Johnston, Fijalkow and Feix1990; Huot et al. Reference Huot, Ghizzo, Bertrand, Sonnendrücker and Coulaud2003; Li et al. Reference Li, Sun and Crouseilles2020). As Eulerian codes are particularly stable and accurate over the entire phase space, we will use them as a benchmark for our PIC simulations. The benchmark will be carried out in the spin-less case, for which an Eulerian code is available. Second, we consider the spin Vlasov–Maxwell model studied in § 2.2, but remove the effect of the plasma on the propagation of the electromagnetic wave. This amounts to assuming that the wave propagates freely (as in a vacuum) and interacts with the plasma, but the plasma does not impact the propagation of the wave. In contrast, the longitudinal nonlinearity owing to Poisson's equation is maintained. In this case, an approximate solution of the spin dynamics can be obtained analytically, which enables us to validate the numerical simulations. Finally, we simulate the complete spin-dependent model (2.12) and study the influence of the various physical parameters: amplitude of the electromagnetic wave, temperature, initial electron polarization and scaled Planck constant.
5.1 SRS without spin
We consider the model put forward by Ghizzo et al. (Reference Ghizzo, Bertrand, Shoucri, Johnston, Fijalkow and Feix1990), Huot et al. (Reference Huot, Ghizzo, Bertrand, Sonnendrücker and Coulaud2003) and Li et al. (Reference Li, Sun and Crouseilles2020), which corresponds to our (2.12) where the spin dependence has been removed. The distribution function $f(t, x, p)$ and the electromagnetic fields $(E_x, {\boldsymbol E}_\perp , {\boldsymbol A}_\perp )(t, x)$
 obey the equations

As an initial condition for $f$ , we use a perturbed Maxwellian

so that the initial longitudinal electric field is $E_{x} (t=0, x) = ({\alpha }/{k_e})\sin (k_ex)$ . Here, $\alpha$
 and $k_e$
 are the amplitude and the wave number of the perturbation, respectively, and $v_{\textrm {th}}$
 is the electron thermal speed. For the transverse fields, we consider an electromagnetic wave with circular polarization:

where $k_0$ is the wave number and $E_0$
 is the amplitude of the transverse electric field. We use periodic boundary conditions with spatial period $L=4{\rm \pi} /k_e$
 . The circular polarization is chosen because it is likely to have maximum impact on the electron spin, which will be considered in the next two subsections.
In the SRS instability, the incident electromagnetic wave $(\omega _0, k_0)$ drives two waves inside the plasma: a scattered electromagnetic wave $(\omega _s, k_s)$
 and an electron plasma wave $(\omega _e, k_e)$
 , where $\omega$
 and $k$
 denote respectively the frequency and wave number of each wave. These waves are matched according to the conditions (conservation of energy and momentum):

with $\omega _{0,s}^2=1+k_{0,s}^2$ and $\omega _e^2=1+3 v_{\textrm {th}}^2 k_e^2$
 .
A schematic view of this configuration is shown in figure 1.
Following Ghizzo et al. (Reference Ghizzo, Bertrand, Shoucri, Johnston, Fijalkow and Feix1990), we take the following values for the physical parameters of the plasma and the wave (recall that frequencies are normalized to $\omega _p$ , velocities to $c$
 , wave numbers to $\omega _p/c$
 and electric fields to $\omega _pmc/e$
 ):

Using the matching conditions (5.4a,b), this yields:

As a reference value, we take for the amplitude of the incident wave $E_\textrm {ref} = 0.325$ . The actual values used in the simulations will be in the range $0.25E_\textrm {ref} \le E_0 \le 2E_\textrm {ref}$
 . In all cases, the quiver velocity $v_{osc} = E_0/\omega _0$
 is smaller than unity, which ensures that the present non-relativistic approximation is valid.
To check the accuracy of our PIC code in the spin-less regime, we also developed a grid-based Eulerian code (see Li et al. (Reference Li, Sun and Crouseilles2020) for more details). For the PIC code, the numerical parameters are $N_x=512, N_{\textrm {part}}=5\times 10^5, \Delta t=0.01$ , whereas for the grid code, we take $N_x=128, N_{v}=128, \Delta t=0.01$
 . Both codes preserve the total energy with a relative error less than $0.05\,\%$
 .
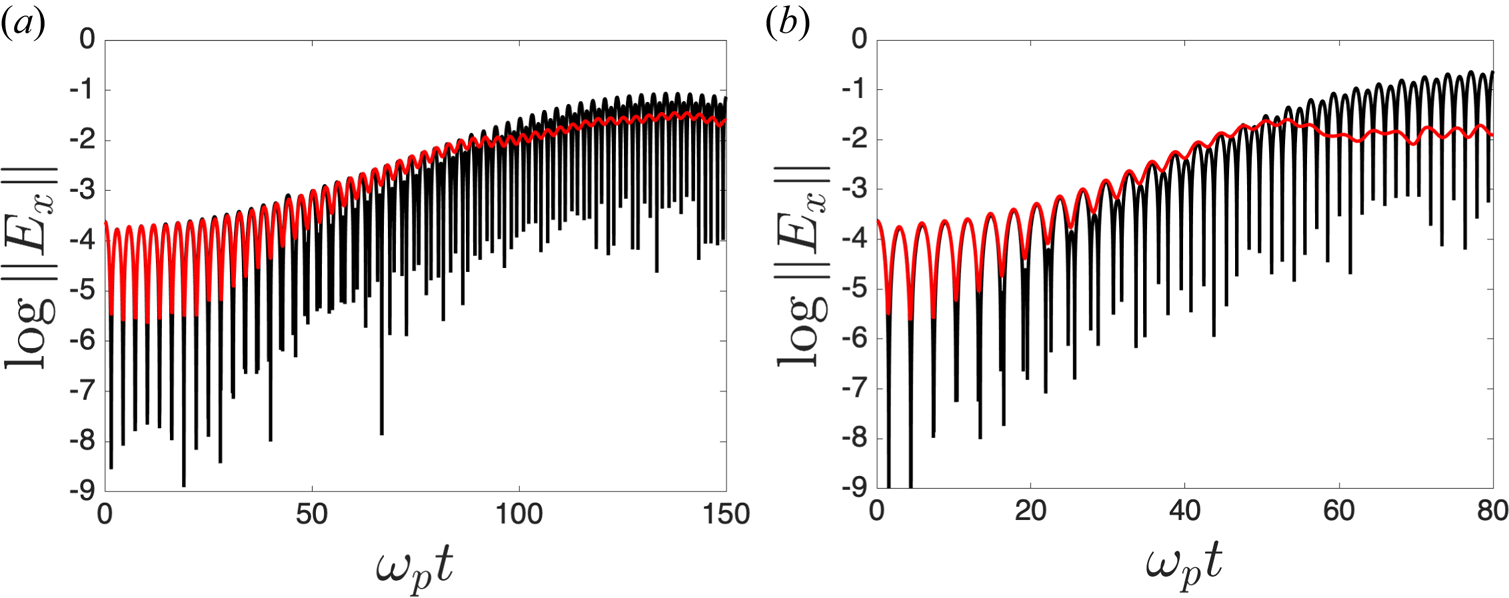
In figure 2, we plot the time evolutions of the longitudinal electric field norm

(on a semi-$\log _e$ scale) for two values of the incident wave amplitude ($E_0=0.325$
 and $E_0=0.65$
 ). The initial conditions are the same for both codes, but the PIC code displays a higher level of initial fluctuations (noise) that is inherent to the numerical method. This is also why we had to take a somewhat high initial perturbation ($\alpha =0.02$
 ), so that it is significantly larger than the noise level. We can observe a relatively good agreement between these two numerical methods in the linear phase. The observed growth rate ($\gamma \approx 0.03$
 for $E_0=0.325$
 and $\gamma \approx 0.06$
 for $E_0=0.65$
 ) is proportional to the amplitude $E_0$
 and close to the value expected from the linear theory ($\gamma \approx 0.04$
 , see Ghizzo et al. Reference Ghizzo, Bertrand, Shoucri, Johnston, Fijalkow and Feix1990).
SRS simulations without spin. Time evolution of the amplitude of the longitudinal electric field norm $\|E_x(t)\|$ on a semi-$\log _e$
 scale. We compare the results of the Eulerian grid code (black curves) and the PIC code (red curves) for two values of the initial amplitude of the electromagnetic wave. We investigate (a) $E_0=E_\textrm {ref}=0.325$
 (observed slope in the linear regime: $\gamma \approx 0.03$
 ) and (b) $E_0=2E_\textrm {ref}=0.65$
 ($\gamma \approx 0.06$
 ).

5.2 Spin-dependent model without wave self-consistency
In this part, we study the propagation of a circularly polarized wave into a plasma which does not retroact on the wave. Hence, the electromagnetic wave propagates as if it was in a vacuum. In this case, there is no SRS instability.
With the notations of § 2.2, the model we consider here reads as

where $\mathcal {Z} = (\,f, E_x, E_y, E_z, A_y, A_z)$ , $\{{\cdot }, {\cdot } \}$
 is the bracket defined in (2.13) and $\tilde {\mathcal {H}}$
 is the Hamiltonian defined as

which means that the term ${\boldsymbol A}_\perp \boldsymbol {\cdot } {\partial {\boldsymbol A}_\perp }/{\partial x} {\partial f}/{\partial p}$ disappears from the Vlasov equation in (2.12), and the terms $A_y \int _{\mathbb {R}^4} f \,\mathrm {d}p\,\mathrm {d}{\boldsymbol s}$
 , $A_z \int _{\mathbb {R}^4} f \,\mathrm {d}p\,\mathrm {d}{\boldsymbol s}$
 disappear from the Maxwell equations in (2.12). In this case, the electromagnetic wave is not coupled to the plasma and can be determined exactly by solving the corresponding Maxwell equations for $E_y$
 and $E_z$
 . In contrast, the longitudinal nonlinearity is kept in the model, hence $E_x$
 is a solution of Poisson's equation. The resulting reduced system preserves the geometric structure of the full system.
The initial condition on the distribution function is as follows (see Appendix D):

i.e. it is the product of the initial spin-less distribution function (5.2) times a spin-dependent part. Hence, the spin variables are initially uncorrelated with the positions and velocities of the particles. The spin-dependent part should be fully quantum mechanical, and is therefore obtained from the $2 \times 2$ density matrix for spin-1/2 fermions, with the additional assumption that the spin must be directed either parallel or antiparallel to the $z$
 axis (Manfredi et al. Reference Manfredi, Hervieux and Hurst2019) (collinear approximation). More details are given in Appendix D. The variable $\eta$
 represents the degree of polarization of the electron gas: $\eta =0$
 for an unpolarized gas and $\eta =1$
 for a fully polarized gas. Here, we use $\eta =0.5$
 and ${\mathfrak{h}}=0.00022$
 . This value of the scaled Planck constant corresponds to a dense electron gas of density $n_0=10^{31} \ \textrm {m}^{-3}$
 and temperature $k_B T = 100 \ \textrm {eV}$
 . All other parameters take the same values as in the spin-less case treated in § 5.1.
Neglecting the spatial dependence of the magnetic fields, an approximate closed equation for the dynamics of the macroscopic spin ${\boldsymbol S}(t) = \int \boldsymbol {s} f \,\mathrm {d} x \,\mathrm {d}p \,\mathrm {d}\boldsymbol {s}\in \mathbb {R}^3$ can be obtained by integrating the Vlasov equation (2.12) in $(x,p,\boldsymbol {s})$
 . We get the following ODE system:

with $\boldsymbol {B} = (0, -\partial _x A_z, \partial _x A_y)^\mathrm {T}$ . Considering a circularly polarized electromagnetic wave, the magnetic field is (still neglecting spatial effects) $\boldsymbol {B}(t) = (0, B_0 \sin (\omega _0 t), -B_0 \sin (\omega _0 t)$
 , with $B_0=E_0 k_0/\omega _0$
 . In the regime $B_0/\omega _0 \ll 1$
 (i.e. when the Larmor precession frequency $eB_0/m$
 is much smaller than the laser frequency), it can be shown that the spin ${ S_z(t)}$
 oscillates with a frequency $\omega _\textrm {spin}=B_0^2/(2\omega _0)$
 (see Appendix C for details).
Here, this solution will be compared with the evolution of ${\boldsymbol S}(t)$ obtained from the numerical solution of the spin Vlasov–Maxwell equations. As the retroaction terms were removed from the Vlasov equation, there is no SRS instability. Then, the magnetic field of the incident wave remains approximately constant in amplitude, thus justifying the use of (5.11) as a valid approximation.
We use the same physical parameters as in § 5.1 and define the reference magnetic field of the incident wave as

We have that $B_\textrm {ref}/\omega _0 = 0.123 k_0/\omega _0 \approx 0.11$ . We will use values up to $B_0=2B_\textrm {ref}$
 so that the condition $B_{0}/\omega _0 \ll 1$
 is always satisfied, albeit marginally.
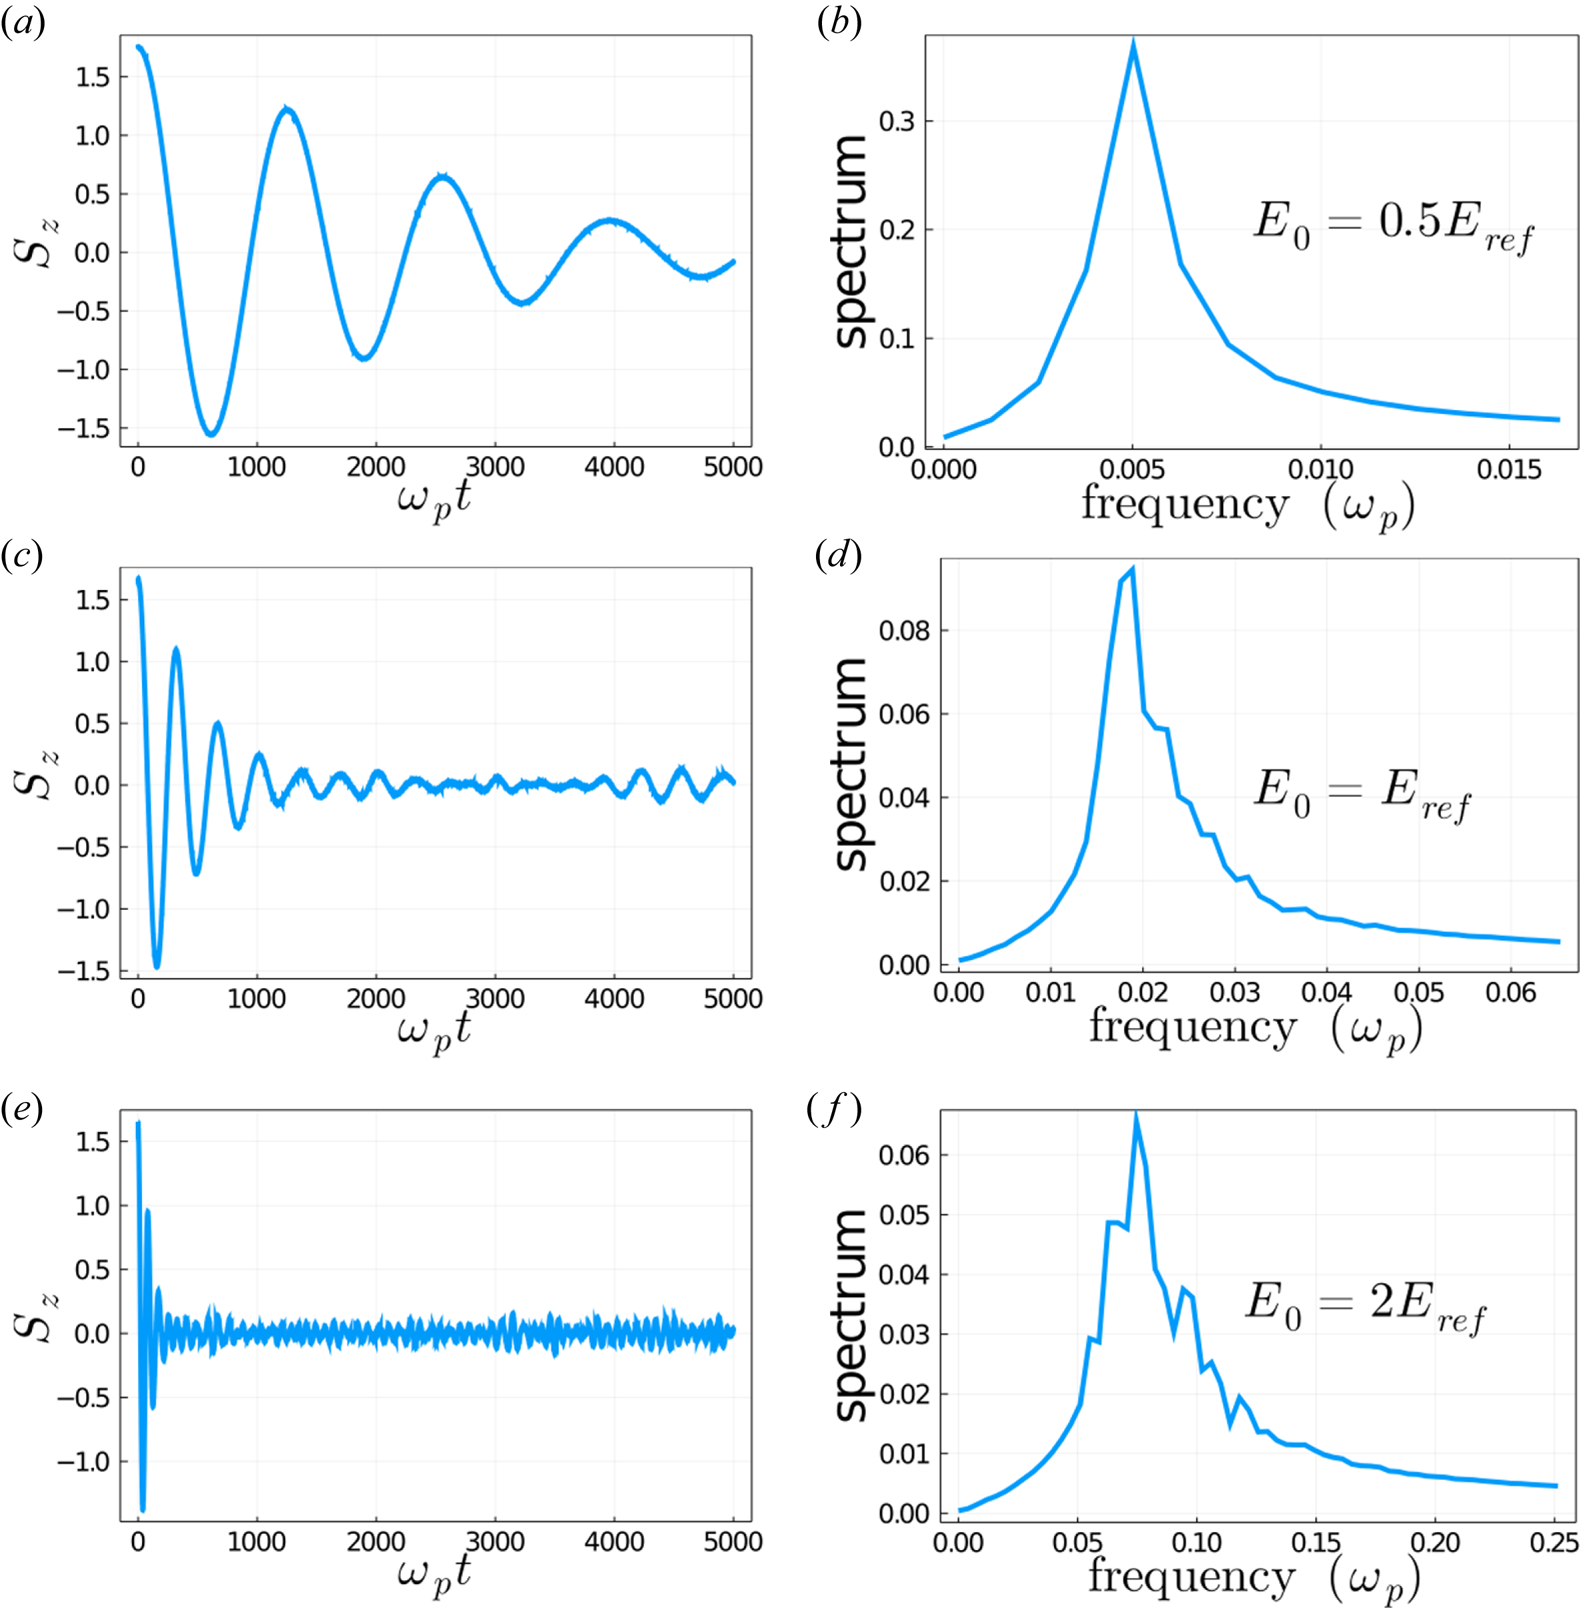
In figure 3, we plot the time evolution of the $z$ component of the macroscopic spin vector $S_z(t) = \int s_z f \,\mathrm {d} x \,\mathrm {d}p \,\mathrm {d}\boldsymbol {s}$
 and its frequency spectrum (the frequencies are expressed in units of $2{\rm \pi} /T$
 , where $T$
 is the final simulation time) for three different values of $E_0$
 (and hence $B_0$
 ): $E_0 =0.5E_\textrm {ref}$
 , $E_0 =E_\textrm {ref}$
 and $E_0 =2E_\textrm {ref}$
 . Here, ${ {S}}_z$
 displays a damped oscillatory behaviour with a spectrum that is well-localized around a single frequency. This dominant frequency is close to the theoretical value $\omega _\textrm {spin}=B_0^2/(2\omega _0)$
 , which yields $\omega _\textrm {spin}=0.0043, \, 0.018$
 and $0.068$
 for the three cases considered here. In particular, the quadratic scaling between $\omega _\textrm {spin}$
 and $B_0$
 is well respected.
Spin-dependent model without wave self-consistency for three values of the incident wave amplitude: $E_0 =0.5E_\textrm {ref}$ (a,b), $E_0 =E_\textrm {ref}$
 (c,d) and $E_0 =2E_\textrm {ref}$
 (e, f). (a,c,e) Time history of ${ {S}}_z(t)$
 (time is in units of $\omega _p^{-1}$
 ). (b,d, f) Corresponding frequency spectrum in units of $\omega _p$
 . The expected values of the spin precession frequencies are (from a,b to e, f) $\omega _\textrm {spin}=0.0043, \, 0.018$
 and $0.068$
 .

The observed damping is likely to arise from phase mixing in the phase space and its rate also increases rapidly with $E_0$ . The effect of the temperature on the damping will be studied in more details in the next subsection.
5.3 Full spin-dependent model
In this section, we consider the full spin Vlasov–Maxwell model (2.12) and study the influence of several physical parameters on the spin dynamics. In particular, we will analyse the effect of the incident wave amplitude, the electronic temperature, the initial spin polarization and the scaled Planck constant. The remaining physical parameters are those of § 5.1.
We will consider two types of initial conditions for the distribution function. The first (labelled ‘Wigner’) is the one already used in the preceding subsection, see (5.10), and corresponds to a quantum density matrix for an ensemble of spins directed parallel to the $z$ axis. The second initial condition (labelled ‘Dirac’) corresponds to an ensemble of classical spins all having directions along the $z$
 axis; it does not correspond to any quantum state and is used here only to illustrate more clearly the loss of spin polarization in the electron gas.
5.3.1 Wigner initial condition
The initial condition is the Maxwell–Boltzmann distribution of (5.10), whose derivation is detailed in Appendix D. The physical parameters are the same as in our reference case described in § 5.1. The electromagnetic fields are initialized as in (5.3). The numerical parameters are as follows: $\Delta t=0.04, N_p=2\times 10^4, N_x=128$ .
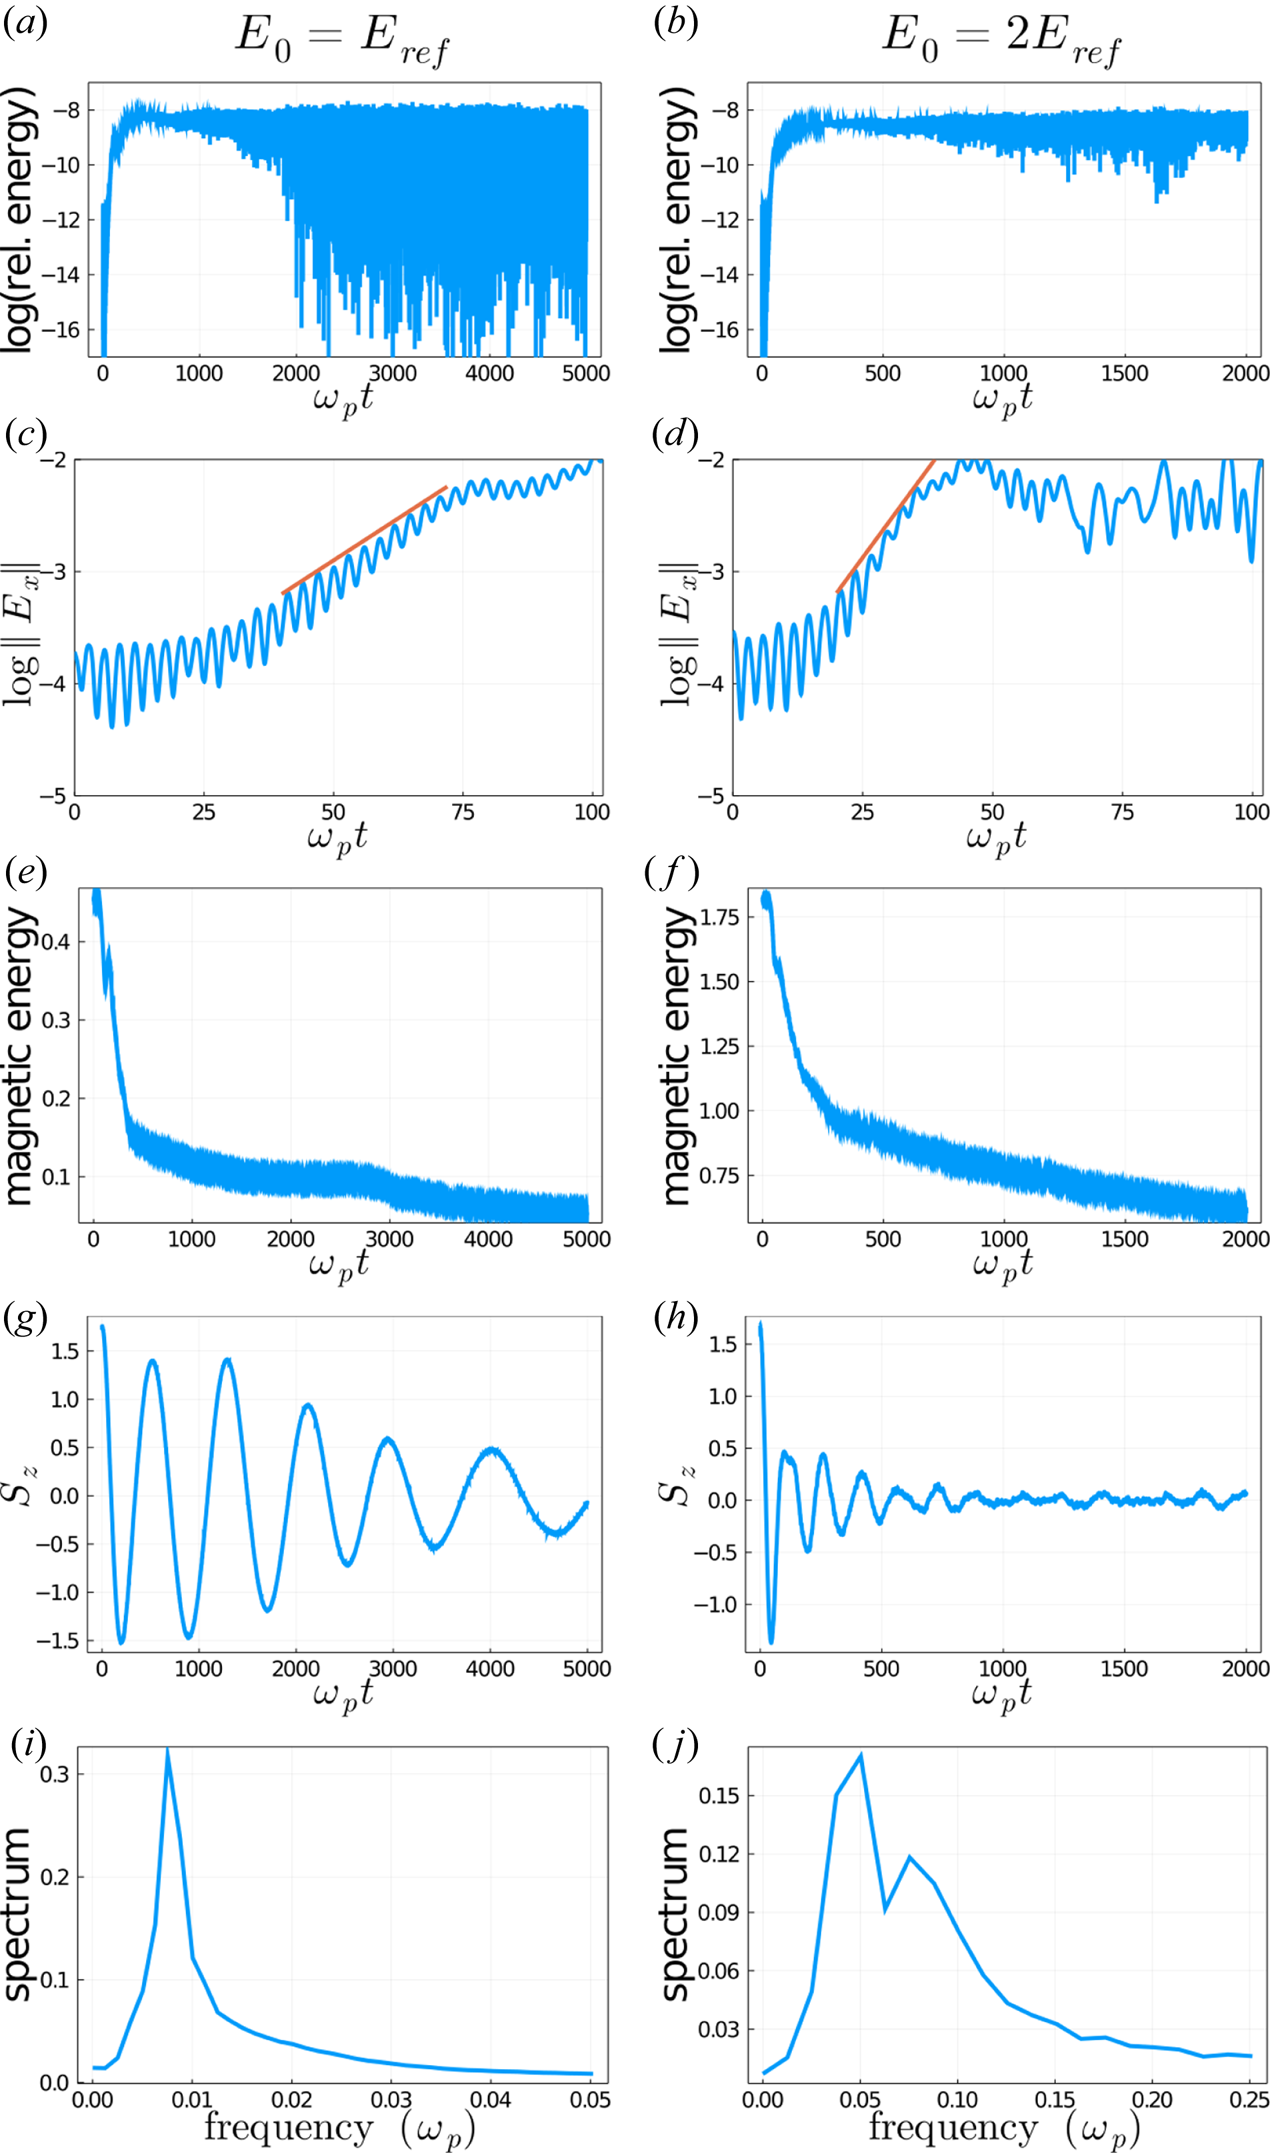
Laser field amplitude. In figure 4, we study the influence of the incident wave amplitude $E_0$ , using ${\mathfrak{h}}=0.00022$
 . The two columns in the figure refer to two values of $E_0$
 : $E_\textrm {ref}$
 on the left and $2E_\textrm {ref}$
 on the right. Conservation of the total energy is good for the PIC code standards, with an error on the relative energy $|{\mathcal {E}}_\textrm {tot} (t)-{\mathcal {E}}_\textrm {tot} (0)|/{\mathcal {E}}_\textrm {tot} (0)$
 of approximately $3\times 10^{-4}$
 . This good conservation property arises from the fact that our algorithm is a fully discrete structure-preserving method.
Full spin-dependent model. We illustrate the influence of the amplitude $E_0$ of the incident wave for (a,c,e,g,i) $E_0=E_\textrm {ref}$
 and (b,d, f,h,j) $E_0= 2E_\textrm {ref}$
 . (a,b) Time history of the the relative total energy $|{\mathcal {E}}_\textrm {tot} (t)-{\mathcal {E}}_\textrm {tot} (0)|/{\mathcal {E}}_\textrm {tot} (0)$
 (on a semi-$\log _e$
 scale). (c,d) Time history of the longitudinal electric field norm $\|E_x\|$
 (on a semi-$\log _e$
 scale); the red straight lines have slopes 0.03 (c) and 0.06 (d). (e, f) Magnetic energy $({1}/{2}) \int |B|^2 {\textrm {d} x}$
 . (g,h) Time history of the spin component ${ {{S}}}_z(t)$
 . (i, j) Frequency spectrum of ${ {{S}}}_z$
 .

The instability rate, measured from the growth of the longitudinal electric field amplitude $\|E_x(t)\|$ , is very similar to that observed in the spin-less simulations, namely $\gamma =0.03$
 ($E_0=E_\textrm {ref}$
 ) and $\gamma =0.06$
 ($E_0=2E_\textrm {ref}$
 ).
The instability has a strong impact on the spin dynamics. In particular, the $z$ component of the macroscopic spin ${ {S}}_z(t) = \int s_z f \,\mathrm {d} x \,\mathrm {d}p \,\mathrm {d}\boldsymbol {s}$
 is damped much more efficiently in the large-amplitude case (right column), where the instability develops faster and saturates at a higher level. The frequency spectrum of ${ {S}}_z(t)$
 displays in both cases a well-defined peak. There is a factor of approximately 5.5 between the spin precession frequencies observed for $E_0=E_\textrm {ref}$
 and $E_0=2E_\textrm {ref}$
 . This is slightly larger that the quadratic scaling with $E_0$
 predicted by our simple model $\omega _\textrm {spin}=B_0^2/(2\omega _0)$
 (see § 5.2 and Appendix C for further details). However, one must recall that this expression was derived under the assumption of an incident wave of constant amplitude $E_0$
 . Here, in contrast, the amplitude is modulated in time, which then affects the quadratic scaling.
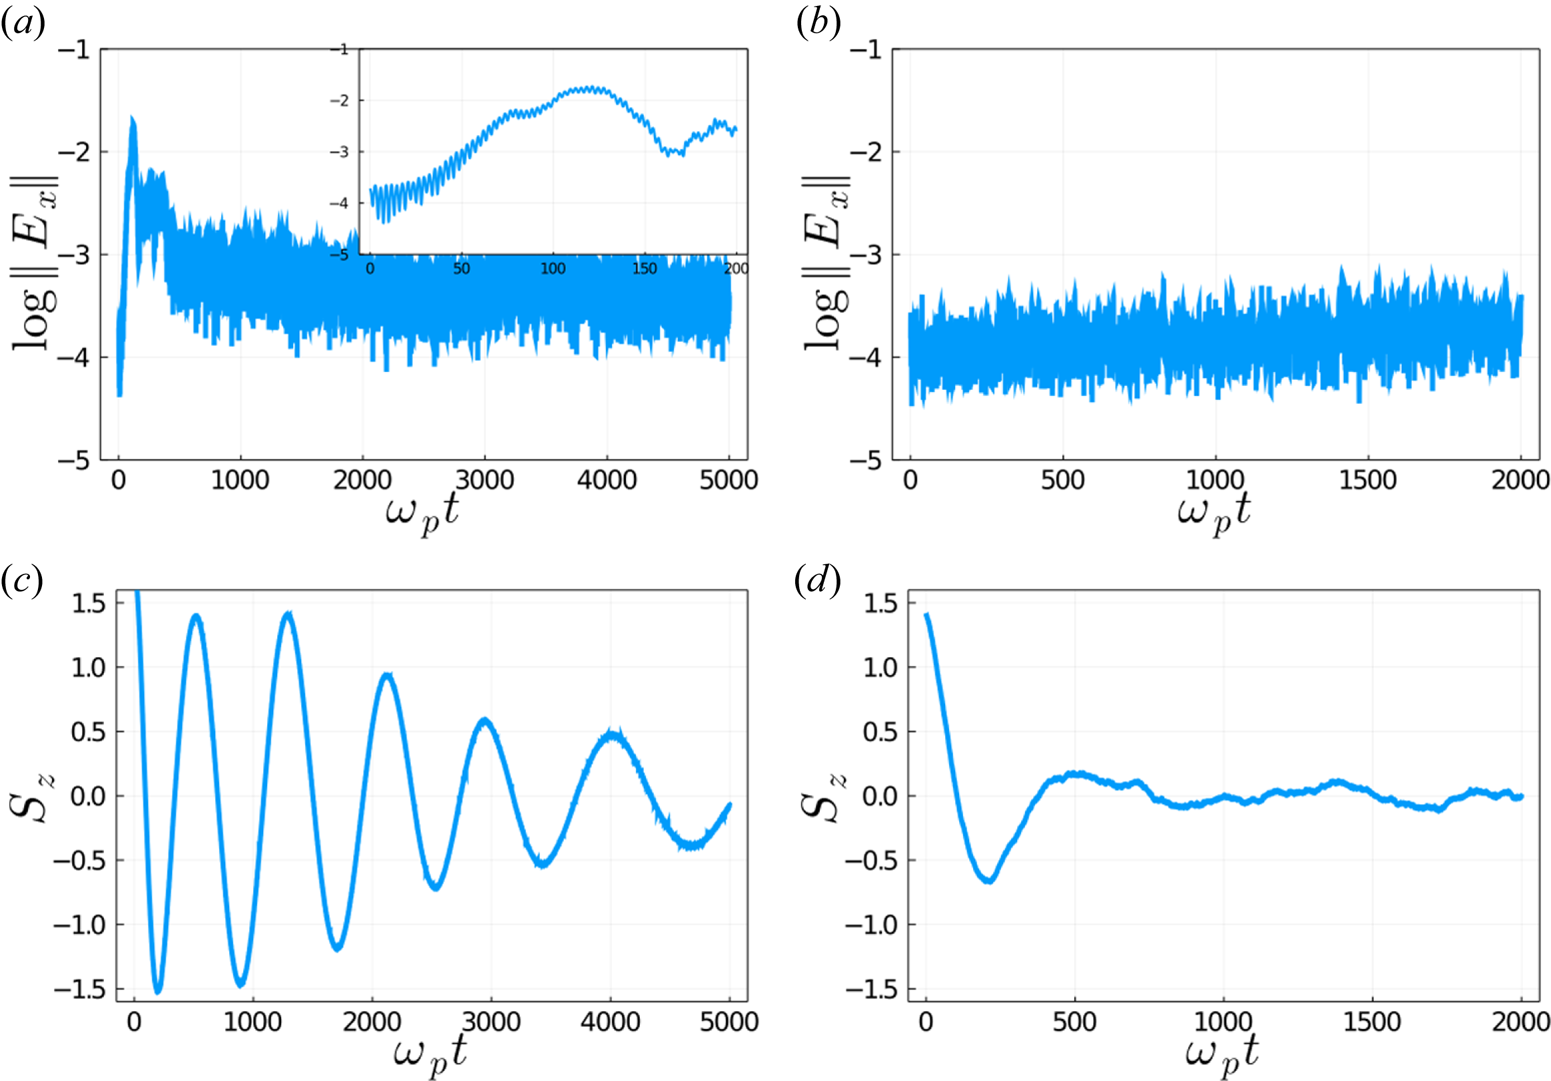
Thermal effects. Next, we study the influence of the temperature by considering two values of the thermal speed: $v_{\textrm {th}}=0.17$ (as in the previous results of figure 3) and $v_{\textrm {th}}=0.51$
 , while the field amplitude is fixed to $E_0=E_\textrm {ref}$
 and ${\mathfrak{h}}=0.00022$
 . The wave number $k_e$
 also changes, as it is dependent on the temperature ($k_e=1.22$
 and $k_e=1.46$
 , for the low-temperature and high-temperature cases, respectively), but the matching conditions of (5.4a,b) are still satisfied with $k_0=2k_e$
 and $\omega _0^2=1+k_0^2$
 .
The simulation results are shown in figure 5. In the high-temperature case, the instability is clearly suppressed, nevertheless, the spin is damped much faster than in the ‘cold’ case. Furthermore, we checked that when no laser pulse is present at all (i.e. $E_0 = 0$ , not shown here), no loss of the polarization is observed.
Full spin-dependent model. Influence of the electron temperature using two values of the thermal speed: $v_{\textrm {th}}=0.17$ (a,c) and $v_{\textrm {th}}=0.51$
 (b,d). For both cases, the field amplitude is $E_0=E_\textrm {ref}$
 . Here, (a,b) show the time history of the longitudinal electric field norm (on a semi-$\log _e$
 scale) and (c,d) show the time history of the spin component ${ {{S}}}_z(t)$
 . The inset in (a) displays a zoom of the longitudinal electric field evolution in the time range $\omega _p t \in [0, 200]$
 , which shows the development of the linear instability.

This is an intriguing result. First, it reveals that the laser pulse is mandatory to induce some loss of polarization. When the laser wave amplitude $E_0$ is sufficiently high and the plasma is sufficiently cold, the SRS instability is triggered, and this induces a loss of spin polarization in the electron gas. This loss of polarization is faster for larger wave amplitudes (figure 4). For warmer plasmas, the SRS instability is suppressed, but depolarization still occurs owing to temperature effects (figure 5). Nevertheless, the presence of the electromagnetic wave is still necessary to observe this ‘thermal’ loss of polarization.
Such depolarization mechanisms are akin to the ultrafast demagnetization observed in metallic nanostructures irradiated with femtosecond laser pulses (Beaurepaire et al. Reference Beaurepaire, Merle, Daunois and Bigot1996; Bigot et al. Reference Bigot, Vomir and Beaurepaire2009; Bigot & Vomir Reference Bigot and Vomir2013).
Scaled Planck constant and initial polarization. In figure 6, the time history of $S_z(t)$ is displayed for $\eta =0.5$
 and different values of the scaled Planck constant: ${\mathfrak{h}}=0.00022, 0.05, 0.1$
 and 0.2. The influence of ${\mathfrak{h}}$
 on the spin dynamics is rather modest and becomes appreciable only for values that are approaching unity. The main observable effect is an increase of the oscillation period with the scaled Planck constant.
Full spin-dependent model. Influence of ${\mathfrak{h}}$ on ${ {{S}}}_z(t)$
 : (a) ${\mathfrak{h}}=0.00022$
 ; (b) ${\mathfrak{h}}=0.05$
 ; (c) ${\mathfrak{h}}=0.1$
 ; (d) ${\mathfrak{h}}=0.2$
 . For all cases, the initial spin polarization is $\eta =0.5$
 .

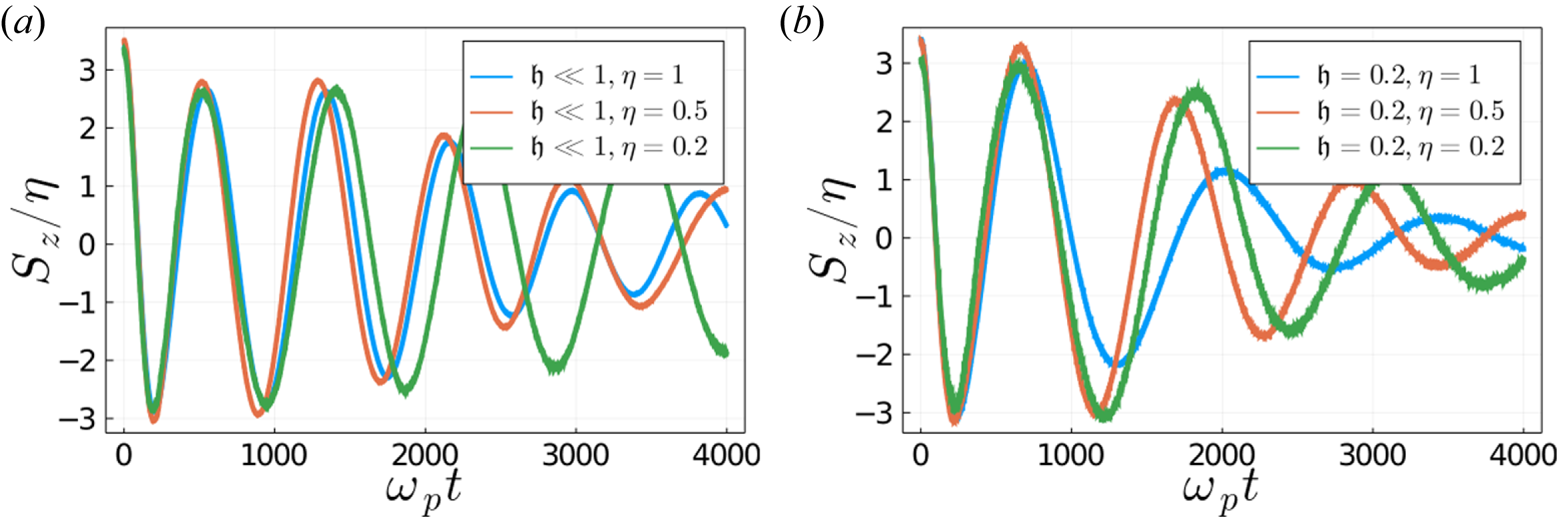
Figure 7 shows the influence of the initial electron polarization ($\eta =0.2, 0.5$ and 1) for two different values of the scaled Planck constant, ${\mathfrak{h}}=0.00022$
 and ${\mathfrak{h}}=0.2$
 . The initial value of the macroscopic spin ${ {{S}}}_z$
 is given by ${ {{S}}}_z(t=0)=L\langle s_z \rangle =L\eta /3\approx 3.42\eta$
 , see also Appendix D. Hence, to compare results with different values of $\eta$
 , we plot the quantity ${ {{S}}}_z(t)/\eta$
 . At low ${\mathfrak{h}}$
 , the effect of $\eta$
 is weak. In contrast, for large ${\mathfrak{h}}$
 , a larger initial polarization is associated with a stronger damping of the macroscopic spin.
Full spin dependent model. Influence of the initial polarization $\eta$ for two values of the scaled Planck constant ${\mathfrak{h}}$
 . We plot the ratio ${ {{S}}}_z(t)/\eta$
 , which is initially independent of $\eta$
 , for (a) ${\mathfrak{h}}=0.00022, \eta =0.2, 0.5,\ \textrm {and}\ 1$
 ; (b) ${\mathfrak{h}}=0.2, \eta =0.2, 0.5, \ \textrm {and} \ 1$
 .

Spin dynamics. To investigate the microscopic spin dynamics in more detail, we have divided the interval of values taken by the spin component $s_z \in [-1,+1]$ into 200 bins each with a size of 0.01. We call $N(s_z)$
 the number of particles having the spin component $s_z$
 in an interval around $s_z$
 , and $N_p$
 is the total number of particles. In figure 8(a–k), we show the histograms of $N(s_z)/N_p$
 as a function of $s_z$
 at different times. The electron distribution at $t=0$
 is linear in $s_z$
 , as shown in (5.10) and in Appendix D. In this case, the electron gas is initially fully polarized along the positive $z$
 direction so that the distribution goes from $N(s_z)/N_p=0$
 for $s_z=-1$
 to $N(s_z)/N_p=1$
 for $s_z=1$
 .
Full spin-dependent model. Histograms of $s_z$ at different times, for a case with ${\mathfrak{h}}=0.00022, v_{\textrm {th}}=0.17, \eta =1$
 . From (a–k): $\omega _p t=0, 100, 200, 300, 400, 500, 600, 1000, 1500, 3000$
 and 4000. Here, $N(s_z)$
 is the number of particles having the $z$
 spin component in an interval around $s_z$
 and $N_p$
 is the total number of particles. The frame (l) shows the time history of the global spin component ${ {{S}}}_z(t)$
 . The red dots correspond to the times of the different histograms displayed in (a–k).

For instance, one can see that at $\omega _p t=200$ (figure 8c), the spin direction has completely reversed, which indicates that the global spin now points along the negative $z$
 direction. In contrast, at $\omega _p t=1500$
 (figure 8i), the distribution is flat, which indicates that the global spin is close to zero. The slope of the spin distribution decreases progressively with time, thus revealing some amount of damping. This behaviour is confirmed by the time history of the global spin component ${ {{S}}}_z(t)$
 , shown in figure 8(l).
5.3.2 Dirac initial condition
We consider the following initial condition for the distribution function:

which corresponds to an ensemble of classical spins which are all directed along the positive $z$ axis. This distribution does not have a clear quantum mechanical meaning, as it does not correspond to any actual Wigner function or density matrix. However, it is useful to perform some numerical simulations with this initial condition, as it enables us to better highlight the dynamics of the spin of the particles on the unit sphere.
The parameters of the electromagnetic fields are the same as those in § 5.1, with $E_0=E_\textrm {ref}$ and ${\mathfrak{h}}=0.00022$
 . In figures 9 and 10, we show the spins $\boldsymbol {s}$
 of the electrons at different instants $t$
 , together with the time history of the global spin components ${ {{S}}}_y(t)$
 and ${ {{S}}}_z(t)$
 , for two values of the thermal speed $v_{\textrm {th}}=0.17$
 (figure 9) and $v_{\textrm {th}}=0.51$
 (figure 10). At $t=0$
 , the spin variables of all particles are localized at the north pole of the sphere, as indicated by the single red dot in the initial condition.
Full spin-dependent model with Dirac initial condition and $v_{\textrm {th}}=0.17$ . Panels (a–i): distribution of the spins on the unit sphere at times $\omega _p t=0, 100, 200, 300, 400, 500, 600, 1000$
 and 1500. Panels ( j,k) show the time history of ${ {{S}}}_y(t)$
 and ${ {{S}}}_z(t)$
 , the red dots correspond to the times of the different snapshots displayed in (a–i).

Full spin-dependent model with Dirac initial condition and $v_{\textrm {th}}=0.51$ . Panels (a–i): distribution of the spins on the unit sphere, at times $\omega _p t=0, 100, 200, 300, 400, 500, 600, 1000$
 , and 1500. Panels ( j,k) show the time history of ${ {{S}}}_y(t)$
 and ${ {{S}}}_z(t)$
 , the red dots correspond to the times of the different snapshots displayed in (a–i).

First, we remark that the spin vector of each particle remains on the unit sphere: $|\boldsymbol {s}_a(t)|=1, \forall a=1, \ldots , N_p$ and $\forall t>0$
 . This is of course the case for the continuous model, but it is worth emphasizing that our numerical scheme is capable of capturing this important geometric property exactly.
At later times, the spin distribution broadens and explores most of the surface of the sphere. For $v_{\textrm {th}}=0.17$ , the distribution moves around the surface of the sphere but remains rather localized on it. This is in line with the evolution of the global spin components ${{{S}}}_{y,z}(t)$
 (figure 9j–k), which oscillate with little damping. For $v_{\textrm {th}}=0.51$
 , the distribution covers the surface of the sphere more uniformly, although the motion is not completely ergodic, and some ring-shaped structures are still visible at times $\omega _p t \gtrsim 1000$
 . This is also consistent with the corresponding evolution of the spin components $S_{y,z}(t)$
 (figure 10j–k), which are more heavily damped than in the low-temperature case.
6 Conclusion
Spin effects in plasmas have been studied extensively during the last two decades (for a recent review, see (Manfredi et al. Reference Manfredi, Hervieux and Hurst2019)). From an experimental point of view, polarized electron beams can now be created and precisely manipulated in the laboratory (Wu et al. Reference Wu, Ji, Geng, Yu, Wang, Feng, Guo, Wang, Qin and Yan2019, Reference Wu, Ji, Geng, Thomas, Büscher, Pukhov, Hützen, Zhang, Shen and Li2020; Nie et al. Reference Nie, Li, Morales, Patchkovskii, Smirnova, An, Nambu, Matteo, Marsh and Tsung2021). Most theoretical works report on various analytical developments aimed at including ever more sophisticated effects, such as relativistic corrections or spin–orbit coupling. However, few efforts have been devoted to the development of numerical methods that are suitable for simulating spin-polarized plasmas in realistic situations. The main objective of the present study was to implement an accurate numerical code for plasmas where the spin of the electrons plays a non-negligible role.
Just like for ordinary plasmas, numerical methods for spin-polarized plasmas also come from two main families: Eulerian (grid-based) and Lagrangian (particle-based). This distinction is even more pertinent for spin plasmas. Indeed, the relevant quantum evolution equations can be formulated in terms of a Wigner distribution function, which characterizes a quantum state in the classical phase space. The Wigner function for a particle with spin can be written either as a $2\times 2$ matrix in the ordinary phase space ${ (\boldsymbol {x}, \boldsymbol {p})}$
 or, equivalently, as a scalar function in an extended phase space ${ (\boldsymbol {x}, \boldsymbol {p}, \boldsymbol {s})}$
 where the spin $\boldsymbol {s}$
 is now an independent variable. Naturally, Eulerian methods are better adapted to the matrix form of the Wigner distribution function, whereas PIC methods are more suitable for the extended phase space representation (Manfredi et al. Reference Manfredi, Hervieux and Hurst2019).
In the semiclassical limit, the Wigner equation becomes a Vlasov-like equation that incorporates spin effects. In this approximation, the electron motion is described by classical trajectories, while the spin is treated as a fully quantum variable.
Here, we have developed a geometric PIC method for the spin Vlasov–Maxwell system, based on a non-canonical Hamiltonian structure (Marklund & Morrison Reference Marklund and Morrison2011) that preserves some of the main properties of the continuous equation (Kraus et al. Reference Kraus, Kormann, Morrison and Sonnendrücker2017). This approach is coupled to a Hamiltonian splitting for the time discretization, which ensures long-time robustness, very good total energy conservation and exact preservation of certain invariants (Poisson constraint or $|\boldsymbol {s}_a|=1$ ).
The PIC code has been tested on a standard laser–plasma problem, namely the stimulated Raman scattering of an electromagnetic wave interacting with an underdense plasma. In this case, the electrons of the plasma are spin-polarized, with different degrees of polarization. We have studied the influence of several physical parameters (temperature, electromagnetic field amplitude, quantum effects, $\ldots$ ) on the Raman instability. The main result is that an initially polarized electron gas can lose its polarization through a combination of thermal effects and the Raman instability. These results may be interesting for current and future laser–plasma experiments that make use of polarized electron beams (Wu et al. Reference Wu, Ji, Geng, Thomas, Büscher, Pukhov, Hützen, Zhang, Shen and Li2020; Nie et al. Reference Nie, Li, Morales, Patchkovskii, Smirnova, An, Nambu, Matteo, Marsh and Tsung2021), and also in condensed matter physics for the understanding of the ultrafast demagnetization observed in magnetic materials irradiated with femtosecond laser pulses (Bigot & Vomir Reference Bigot and Vomir2013).
Acknowledgements
The authors wish to thank P. Navaro (CNRS, Rennes) for his help in the code development. Much of this work has been done during the one year stay of the author Y.L. in Rennes which was supported by a scholarship from Academy of Mathematics and Systems Science, Chinese Academy of Sciences. Y.S. is supported by the National Natural Science Foundation of China No. 11771436.
Editor Francesco Califano thanks the referees for their advice in evaluating this article.
Declaration of interests
The authors report no conflict of interest.
Appendix A. Computation of the functional derivatives
Here we give some details on the discrete functional derivatives. We also refer to the work of Kraus et al. (Reference Kraus, Kormann, Morrison and Sonnendrücker2017) for a more general context. The main point is to consider any functional $\mathcal {F}$ of the semi-discretized unknown $E_{x, h}, E_{y, h}, \ldots$
 as a function $F$
 of the coefficients ${\boldsymbol e}_x, {\boldsymbol e}_y, \ldots$
 . Thus, as $E_{x, h}(t) = \sum _{i=1}^{N_1}e_{x,i}(t)\varLambda _{i}^1(x)$
 , any functional $\mathcal {F}[E_{x,h}]$
 will be considered as a function $F({\boldsymbol e}_x)$
 . We then have the discrete functional derivatives by using the calculations in Kraus et al. (Reference Kraus, Kormann, Morrison and Sonnendrücker2017),

Similarly, for the other fields, we have

Regarding the distribution function $f$ , we assume a particle-like distribution function for $N_p$
 particles,

Additionally, a functional of the distribution function $\mathcal {F}[f]$ can be considered as a function of the particle phase space trajectories $F({\boldsymbol {X}}, {\boldsymbol {P}}, {\boldsymbol {S}})$
 . From Kraus et al. (Reference Kraus, Kormann, Morrison and Sonnendrücker2017), we have

Appendix B. Proof of Theorem 3.1
This section is devoted to the proof of Theorem 3.1. Because the matrix (3.18) is clearly skew symmetric, we only need to verify the Jacobi identity (the dependence on ${\boldsymbol u}$ of $\mathbb {J}$
 will be omitted for clarity)

As the Poisson matrix $\mathbb {J}=\mathbb {J}({\boldsymbol u})$ depends only on ${\boldsymbol X}$
 and ${\boldsymbol S}$
 , we only need to sum $\ell$
 over $1 \le \ell \le N_p$
 and $2N_p+1 \le \ell \le 5N_p$
 . There are two cases we need to consider.
(i) Two of $i,j,k \in \mathbb {Z}$
lie in $[N_p+1, 2N_p]$, and the other one lies in $[5N_p+1, 5N_p+N_1]$. We take the case that $N_p+1 \le i,j \le 2N_p$ and $5N_p+1 \le k \le 5N_p+N_1$ as an example. In this case, (B1) becomes
(B2)\begin{equation} \sum_{\ell=1}^{N_p}\left( \frac{\partial \mathbb{J}_{jk}}{\partial u_{\ell}}\mathbb{J}_{\ell i}+ \frac{\partial \mathbb{J}_{ki}}{\partial u_{\ell}}\mathbb{J}_{\ell j}\right) = 0. \end{equation}As $\mathbb {J}_{jk}$ in the above depends only on $x_{j-N_p}$, $\mathbb {J}_{ki}$ depends only on $x_{i-N_p}$, so the left-hand side of the above identity becomes
(B3)\begin{equation} \frac{\partial \mathbb{J}_{jk}}{\partial u_{j-N_p}}\mathbb{J}_{(j-N_p)i} + \frac{\partial \mathbb{J}_{ki}}{\partial u_{i-N_p}}\mathbb{J}_{(i-N_p)j}. \end{equation}When $i\neq j$, $\mathbb {J}_{(j-N_p)i} = 0$ and $\mathbb {J}_{(i-N_p)j} = 0$, then the quantity (B3) is zero. When $i = j$, we have $\mathbb {J}_{(j-N_p)i} = \mathbb {J}_{(i-N_p)j}$ and ${\partial \mathbb {J}_{jk}}/{\partial u_{j-N_p}} = -({\partial \mathbb {J}_{ki}}/{\partial u_{i-N_p}})$, then the quantity (B3) is also zero which ends the proof.(ii) When $2N_p + 1 \le i,j,k \le 5N_p$
, we only need to sum $\ell$ over $2N_p+1 \le \ell \le 5N_p$. In this case, (B1) is easy to verify.


Appendix C. Derivation of the spin precession frequency
We consider the following ODE system:

with $\boldsymbol {B}(t, x)=(0, B_0\sin (\omega _0 t), -B_0\cos (\omega _0 t))$ (which corresponds to a circularly polarized incident wave). With the normalization $\bar {t}=B_0 t$
 and $\varepsilon =B_0/\omega _0$
 , which is assumed to be small, we obtain the following system:

The system can then be rewritten as $\dot {\boldsymbol {u}} = F(\bar {t}/\varepsilon , \boldsymbol {u})$ , where ${\boldsymbol u} = {\boldsymbol {S}}$
 and $F(\boldsymbol {\cdot }, \boldsymbol {u})$
 is $2{\rm \pi}$
 -periodic. Introducing the augmented unknown $U(\bar {t}, \tau =\bar {t}/\varepsilon ) = \boldsymbol {u}(t)$
 , the system is recast into

We can perform a decomposition of this PDE: $U(\bar {t}, \tau ) = U_0(\bar {t}) + U_1(\bar {t}, \tau )$ , where $U_0(\bar {t}) = \varPi U(\bar {t}, \boldsymbol {\cdot })$
 , the operator $\varPi$
 being the average on $[0, 2{\rm \pi} ]$
 . Inserting the decomposition into (C3) leads to

The asymptotic limit $\varepsilon \to 0$ is obtained by inserting the approximation obtained from the second equation $U_1 = \varepsilon \partial _\tau ^{-1}(I-\varPi ) F({\cdot }, U_0) + {O}(\varepsilon ^2)$
 into the first equation. It becomes

First, we compute $U_1$

Then, (C5) becomes

The first component does not depend on time and the asymptotic model for the two last components $u(t)=(U_{0, y}(t), U_{0, z}(t))^T$ then read, in the original time variable $t=\bar {t}/B_0$


with $J$ as the symplectic matrix. The solution then reads (using $\varepsilon = B_0/\omega _0$
 )

whose frequency is $\omega = \frac {B_0^2}{2\omega _0}$ .
Appendix D. Spin-dependent initial condition
The spin Vlasov model adopted here is a semiclassical approximation whereby the mechanical motion (position and momentum) is treated classically, while the spin degrees of freedom are fully quantum variables. Hence, the spin-dependent part of the initial distribution function should be determined using the rules of quantum mechanics for spin-1/2 fermions. We will do this by making use of Wigner functions (representation of quantum mechanics in the classical phase space). The derivation closely follows that of Manfredi et al. (Reference Manfredi, Hervieux and Hurst2019).
For spin-${1/2}$ particles, the relevant Wigner function $\mathcal {F}$
 is a $2\times 2$
 matrix:

where the symbols $\uparrow , \downarrow$ denote respectively the spin-up and spin-down components. It is convenient to project the matrix $\mathcal {F}$
 onto the Pauli basis set

where $\boldsymbol { \sigma } = (\sigma _x, \sigma _y, \sigma _z)$ is the vector of the $2 \times 2$
 Pauli matrices

$\sigma _{0}$ is the $2 \times 2$
 identity matrix, and

The scalar distribution function in the extended phase space $f({\boldsymbol x},{\boldsymbol p}, {\boldsymbol s})$ is related to the matrix Wigner function through (Marklund et al. Reference Marklund, Zamanian and Brodin2010; Manfredi et al. Reference Manfredi, Hervieux and Hurst2019):

In the so-called collinear approximation, the spin is directed either parallel or antiparallel to the $z$ axis, so that only the diagonal terms in (D1) survive. Using (D4), we get: $F_0=f^{\uparrow \uparrow } + f ^{\downarrow \downarrow }$
 , $F_z=f^{\uparrow \uparrow } - f ^{\downarrow \downarrow }$
 and $F_x=F_y=0$
 . Using these expressions, it is easy to show that

For a Maxwell–Boltzmann equilibrium, $F_0$ is a standard Maxwellian distribution, and one can prove that $F_z (\boldsymbol {p})= \eta F_0(\boldsymbol {p})$
 , where $\eta \in [0,1]$
 is a number that characterizes the degree of polarization of the electron gas (Manfredi et al. Reference Manfredi, Hervieux and Hurst2019). Hence, one can write:

We also note that, using the distribution (D7), the average values of the spin components are:

The global spin components used in the main text are then: $S_i(t) = L \langle s_i\rangle$ , with $i=(x,y,z)$
 , where $L$
 is the length of the periodic computational box.