Implications
The critical evaluation of livestock genetic resources is important in enabling agriculture and food industries to respond to future changes in consumers needs. One of the main outcomes of the research reviewed in the paper is the evaluation of the contributions of a large and quite diverse sample of European pig breeds to this species genetic diversity. The results reviewed provide guidance in evaluating and managing genetic diversity along the recommendations of the Rio Convention on Biological Diversity, as well as opportunities for the pig industry to maintain and improve their genetic resources. The paper provides results that could assist in generating new hypotheses and stimulating further innovative research.
Introduction
The current state of the pig genetic resources in Europe is characterised by the existence of many local breeds, mostly rare, and a few intensively selected breeds of international status (e.g. Large White, Landrace, Piétrain, etc.). Such a situation makes it of particular interest to assess the level of genetic diversity that is present in Europe, in order to preserve genetic variation for traits likely to be the targets of current or future selection programmes. With this aim in mind, collaborative programmes were launched with the support of the European Commission (EC) in the early 90s. A large set of European pig breeds was sampled and genetic markers used to assess diversity. The purpose of this paper is to outline the history and scope of various European programmes following earlier studies of genetic polymorphisms in the pig. The results obtained in the partitioning of diversity, within and among the breeds sampled, will be reviewed, and the relationships among breeds evidenced will be discussed. The emphasis in these investigations is on the exploitation of DNA marker information, which raises the important issue of marker neutrality and the relevance of molecular variation for quantitative trait diversity. Finally, lessons and opportunities offered will be briefly discussed.
European programmes
Research on genetic polymorphisms in farm animals has a long history. For many years, it has been limited to blood groups, later followed by starch gel electrophoresis of proteins, so-called biochemical polymorphisms. A review of the pig genetic polymorphisms in the early 80s can be found in Ollivier and Sellier (Reference Ollivier and Sellier1983). In the early 90s, DNA sequence variation started being intensively investigated and detailed porcine genetic maps were established, mainly including microsatellites (MS) but also allowing accurate mapping of several blood group and biochemical polymorphisms (Ollivier et al., Reference Ollivier, Caritez and Foulley2001a).
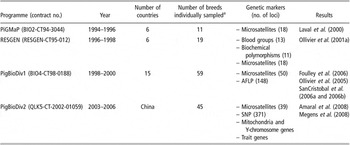
The use of genetic markers for comparing breeds of pigs started in the late 60s (Major, Reference Major1968; Dinklage and Gruhn, Reference Dinklage and Gruhn1969). It is also worth recalling the extensive literature devoted to comparing domestic breeds to wild pigs from various continents, with a view to trace the possible origin of our present breeds. The shift of emphasis towards genetic diversity could only come with the development of efficient molecular genetic tools. A major contribution to the making of genetic maps was made through the Pig Gene Mapping Project (PiGMaP) supported by the EC over the period of 1991–96 (Archibald et al., Reference Archibald, Haley and Brown1995). In the second phase of this project, a pilot study on genetic diversity was undertaken following the recommendations made by a working group convened by FAO (Barker et al., Reference Barker, Hill, Bradley, Nei, Fries and Wayne1993–1998). The results obtained in this study, covering 18 MS markers, were published by Laval et al. (Reference Laval, Iannuccelli, Legault, Milan, Groenen, Giuffra, Andersson, Niessen, Jorgensen, Geldermann, Foulley, Chevalet and Ollivier2000).
Based on the experience gained in PiGMaP, a new programme was launched by the EC in 1998, entitled ‘Characterisation of genetic variation in the European pig to facilitate the maintenance and exploitation of biodiversity’ (in brief PigBioDiv). The main objective of PigBioDiv was to evaluate genetic diversity, considering both commercial populations and local breeds, by providing the reference data necessary to estimate within-breed as well as between-breed genetic variability. This was achieved by sampling 50 individuals from different breeds and lines, and determining diversity at DNA level. The emphasis was on standard DNA marker technologies, such as simple sequence repeat (so-called MS) and amplification of fragment length polymorphism (AFLP), and on the use of high throughput genotyping devices (for details of the project see: Groenen et al., Reference Groenen, Joesten, Boscher, Amigues, Rattink, Harlizius, van den Poel and Crooijmans2003; Ollivier et al., Reference Ollivier, Amigues and Boscher2003; Plastow et al., Reference Plastow, Siggens, Bagga, Brugmanns, Heuven and Peleman2003). The essential results can be found in SanCristobal et al. (Reference SanCristobal, Chevalet and Haley2006a) for MS, SanCristobal et al. (Reference SanCristobal, Chevalet and Haley2006b) and Foulley et al. (Reference Foulley, van Schriek and Alderson2006) for AFLP, and Ollivier et al. (Reference Ollivier, Alderson and Gandini2005) for an overall analysis of genetic diversity, cumulating MS (PiGMaP and PigBioDiv breeds) and AFLP (PigBioDiv breeds only) information. Some supplementary information can be obtained on a publicly available website (http://www.projects.roslin.ac.uk/pigbiodiv/publications.html).
Pig genetic diversity evaluation was also included among the tasks of another EC-funded programme entitled ‘European gene banking project for pig genetic resources’, in the framework of the EC regulation 1467/94 on genetic resources (RESGEN), over 1996–98 (Ollivier et al., Reference Ollivier, Caritez and Foulley2001a and Reference Ollivier, Labroue, Glodek, Gandini and Delgado2001b). This study made use of some MS results obtained in PiGMaP and PigBioDiv. More recently, a new EC pig biodiversity programme was prepared shortly after the completion of PigBioDiv, including Chinese partners, with the intention of having the European experience extended to China (Blott et al., Reference Blott, Andersson, Groenen, SanCristobal, Chevalet, Cardellino, Li, Huang, Li, Plastow and Haley2003). An overview of the main features of those programmes is presented in Table 1, which clearly shows an increasing coverage over time of both the resources and the genome of the species.
European collaborative programmes on pig biodiversity

AFLP = amplification of fragment length polymorphism; SNP =single nucleotide polymorphism.
aSee list in Table 2.
Genetic and allelic diversity
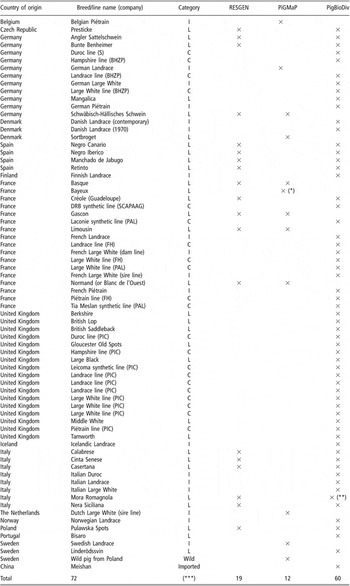
In the diversity programmes of Table 1, a total of 72 breeds were sampled, as listed in Table 2. By combining the PiGMaP and PigBioDiv data, a subset of 68 European domestic breeds was eventually analysed for both within-breed and between-breed diversity. These breeds belonged to three categories, namely local breeds (29 breeds), national varieties of international breeds (18 breeds) and commercial lines from private breeding companies (21 lines). As shown in Table 2, two additional European domestic breeds were sampled but could not be analysed.
List of the European breeds sampled in the collaborative projects of Table 1

The breeding companies are: BundesHybridZuchtProgram (BHZP), France Hybrides (FH), Pen Ar Lan (PAL), Pig Improvement Company (PIC), Schaumann (S) and Société Coopérative Agricole pour l’Assainissement et l’Amélioration Génétique du Cheptel Porcin (SCAPAAG).
The breed categories are: local (L), international (I) or commercial lines (C).
(*) Bayeux not analysed in Laval et al. (Reference Laval, Iannuccelli, Legault, Milan, Groenen, Giuffra, Andersson, Niessen, Jorgensen, Geldermann, Foulley, Chevalet and Ollivier2000).
(**) Mora Romagnola only pool-genotyped for microsatellites.
(***) 31 Local, 18 International, 21 Commercial and 2 Other.
Genetic diversity within breed
The within-breed diversity has been analysed for AFLP and MS. The average expected heterozygosity for each category of breed showed a similar tendency for both markers, namely lower within-breed diversity in local breeds and commercial lines as compared to international breeds. This observation appears to be in keeping with what is known of the average effective size of the breeds and lines of each category, though rather large variations appeared between populations of the same category. Care should therefore be taken when comparing individual breed heterozygosities, given their rather large standard error of estimation. It should also be noted that heterozygosities expected under Hardy–Weinberg equilibrium were being considered, though this assumption could only be statistically tested for MS. There it was rejected (at P < 0.05Footnote 1) for 15 breeds, which mostly showed a deficit of heterozygotes. A well known difficulty with MS, however, is occasional failure of amplification leading to null alleles and to a spurious enhancing of heterozygotes deficit (Chakraborty et al., Reference Chakraborty, De Andrade, Daiger and Budowle1992).
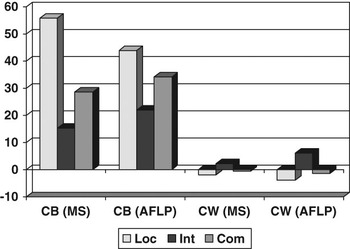
Breed expected heterozygosities were converted into breed contributions to within-breed diversity, allowing a within-breed diversity breakdown over the three categories of breeds defined above (see CWs in Figure 1). Contributions to within-breed diversity must add up to zero over breeds, and thus necessarily include some negative values, since the extinction of a highly homozygous breed raises the average heterozygosity of the remaining ones.
Contribution (%) of each category of breed (Loc: local breed; Int: international breed; Com: commercial line) to between-breed diversity (CB), based on the Weitzman diversity function applied to Reynolds genetic distances (Reynolds et al., Reference Reynolds, Weir and Cockerham1983), and within-breed diversity (CW), based on expected heterozygosity. MS: microsatellites on 68 European domestic breeds; AFLP: amplified fragment length polymorphism on 58 European domestic breeds. Adapted from Ollivier et al. (Reference Ollivier, Alderson and Gandini2005).

Genetic diversity between breeds
When analysing between-breed diversity, individual breed contributions to diversity may be derived from any set of distances. In a context of species conservation, Weitzman (Reference Weitzman1992 and Reference Weitzman1993) showed how to derive a diversity function (V) from a set of genetic distances, in order to evaluate the relative loss of diversity resulting from the extinction of any given species. This loss is taken to represent its contribution to genetic diversity. Weitzman also showed that the algorithm leading to V generates a rooted tree, which may be interpreted as a taxonomic tree, whose branch lengths measure the diversity lost when the corresponding species goes extinct (see next section on taxonomy). The approach has been extended to the situation of livestock breeds diversity by Thaon d’Arnoldi et al. (Reference Thaon d’Arnoldi, Foulley and Ollivier1998), and software has been developed in the framework of PigBioDiv for implementing the calculations, down to the drawing of the taxonomic tree (Derban et al., Reference Derban, Foulley and Ollivier2002–2005).
This method has already been used in most farm animal species and shown to be helpful for setting conservation priorities among endangered breeds, as reviewed by Ollivier and Foulley (Reference Ollivier and Foulley2009). Between-breed diversity was partitioned in that way among the 70 breeds of PigBioDiv, and a breakdown among the three categories could thus be achieved and compared to the corresponding breakdown for within-breed diversity. As shown in Figure 1, the breed categories ranked in a reverse order for between- compared to within-breed diversity, with higher differences between categories for the former. About half of the between-breed diversity could be assigned to the local breeds. Similar examples showing large contributions of ‘native’ breeds have been reported in cattle and sheep (Tapio et al., Reference Tapio, Varv, Bennewitz, Maleviute, Fimland, Grislis, Meuwissen, Miceikine, Olsaker, Viinalas, Vilkki and Kantanen2006). As explained above, some within-breed contributions may be negative. In contrast, the diversity function of Weitzman is a monotonously increasing function of the number of breeds and cannot yield negative contributions.
Comparisons between markers
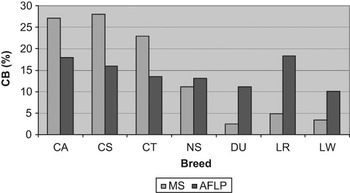
Microsatellites and AFLP are both numerous and dispersed over the pig genome, making them both suitable for biodiversity analyses. Overall genetic diversity in AFLP was considerably below MS: 0.12 v. 0.56 and 0.11 v. 0.23, respectively, for expected heterozygosity and Wright fixation index (FST) (Foulley et al., Reference Foulley, van Schriek and Alderson2006). In spite of these differences in total diversity, the individual breed contributions to both diversities (within and between) were positively correlated between the two markers, which is confirmed by the similarity between the MS and AFLP graphs of Figure 1. The correlations (r = 0.5), however, were moderate and somewhat lower than would be expected if the two markers’ evolutions had been governed mainly by genetic drift. This suggests that the two markers may carry different diversity information (Foulley et al., Reference Foulley, van Schriek and Alderson2006). An illustration is provided by the Italian breeds of PigBioDiv shown in Figure 2. In this subset, the international breeds (Duroc (DU), Landrace (LR) and Large White (LW)) contributed much more to AFLP diversity than to MS diversity, whereas the reverse appeared for the local breeds (Calabrese (CA), Cinta Senese (CS) and Casertana (CT)).
Relative contributions to between-breed diversity (CB defined as in Figure 1) of seven Italian breeds, expressed in % of the sum of their contributions to the European between-breed diversity. MS: microsatellites; AFLP: amplified fragment length polymorphism. Breed codes – CA: Calabrese; CS: Cinta Senese; CT: Casertana; NS: Nera Siciliana; DU: Duroc; LR: Landrace; LW: Large White.

Allelic diversity
The number of alleles per locus, termed allelic richness, is a diversity measure of great interest in conservation genetics. While heterozygosity is related to the immediate response to selection, the long-term response is affected by the number of alleles (see the review of Barker (Reference Barker2001)). Marker allelic richness is also a useful criterion, as shown by the effectiveness of marker-assisted maximisation of the number of marker alleles conserved for retaining the maximum number of neutral and non-neutral alleles (Bataillon et al., Reference Bataillon, David and Schoen1996).
The number of alleles observed in a breed sample depends on sample size (N). Fair comparisons between breeds then require equal sample sizes, or some way of correcting the number observed for sample size. Techniques used in ecology to study species diversity allow making fair comparisons, e.g. by applying the ‘rarefaction’ method. The idea of rarefaction is to estimate allelic richness by the number of alleles expected in a sample of specified size, g, which is the smallest N of all breeds examined at a given locus (El Mousadik and Petit, Reference El Mousadik and Petit1996). Another possibility is to use an ‘extrapolation’ method, proposed by Foulley and Ollivier (Reference Foulley and Ollivier2006), who compared it to rarefaction on the PigBioDiv breeds.
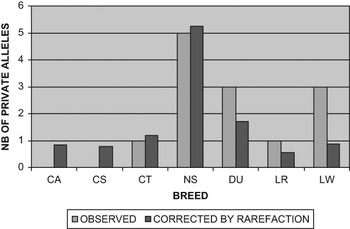
The concept of allelic richness leads to the slightly different concept of allelic diversity, which refers to the existence of alleles specific to some breeds, since a high number of different alleles in a breed does not automatically guarantee their originality. The alleles present in one breed and absent in all others are called ‘private’ alleles. Equivalently to the above definition of breed contribution to genetic diversity, the number of private alleles in a breed is a measure of its contribution to allelic diversity. This number has also to be corrected for sample size. This can be done either through rarefaction or extrapolation. The Italian example given in Figure 3 shows that the number corrected may considerably deviate from the observed number, in either direction. Figure 3 also shows that the Black Sicilian pig (NS), which harbours the largest number of private alleles, is not among the highest contributing breeds to MS diversity in Figure 2. This example illustrates the need to distinguish allelic diversity, where allele uniqueness is at stake, from the classical genetic diversity concept, based on allele frequency. The quasi-independence found between the two types of diversity over the PigBioDiv breeds may apply to other species as well, as suggested by Foulley and Ollivier (Reference Foulley and Ollivier2006).
Number of private alleles in seven Italian breeds (breed codes given in Figure 2): number of alleles ‘private’ relative to the seven breeds considered, totalled over 50 microsatellite loci.

Linkage disequilibrium
Linkage disequilibrium (LD) is a non-random association of genes at different loci, known to decrease rapidly with increasing map distance of the loci considered. Detecting significant LD therefore needs narrowly spaced genetic markers, not available until recently. With an average map distance of 35 cM between neighbouring markers among the 50 MS selected in PigBioDiv (see Table 1 in Groenen et al., Reference Groenen, Joesten, Boscher, Amigues, Rattink, Harlizius, van den Poel and Crooijmans2003), the MS data collected in this study could not be expected to allow any precise evaluation of LD extent in the pig. One of the earliest studies of LD in pigs actually used 15 MS, spaced 5 cM on average, and was able to show significant LDs on two pig chromosomes (Nsengimana et al., Reference Nsengimana, Baret, Haley and Visscher2004). The increasing availability of single nucleotide polymorphisms (SNPs) in domestic animals will open the way to high-density genetic maps comparable to those achieved in humans (Akey et al., Reference Akey, Zhang, Zhang, Li and Shriver2002). A recent comparison of 10 European and 10 Chinese breeds, and a European wild boar, bearing on 371 SNPs, revealed more extended LD in Europe compared to China, with the wild boar in an intermediate position (Amaral et al., Reference Amaral, Megens, Crooijmans, Heuven and Groenen2008). Interestingly, a very highly significant interaction was evidenced between breed and genome region, which might reflect differential selection pressures across genomic regions among breeds.
Taxonomy and breed clustering
In the previous section, it has been shown how genetic distances were used in PigBioDiv to analyse genetic diversity. Another classical use of genetic distances is the drawing of trees, often called phylogenetic trees. The term implicitly refers to evolution theory where diversity arises from speciation, i.e. the division of one ancestor species into two new species. Quite apart from the possible phylogenetic ambiguity of molecular data, as discussed for instance by Smouse (Reference Smouse1998), such a pattern of evolution can hardly apply to farm animal breeds, except in particular short-term situations when one breed (or line) happens to be subdivided into two new ones. Domestic breeds’ evolution cannot, in general, be viewed as the result of a tree-like branching process. The trees drawn must be considered as telling the evolutionary story that best fits the diversity observed but not necessarily as telling the ‘true’ story (Weitzman, Reference Weitzman1992). Quite complex migration–admixture patterns usually prevail and the trees are best viewed as classification tools, showing taxonomies rather than phylogenies. The trees drawn from the PigBioDiv MS and AFLP data showed a typical clustering of the commercial lines around their respective international breed of reference, but no clustering of local breeds with international breeds (Foulley et al., Reference Foulley, van Schriek and Alderson2006; SanCristobal et al., Reference SanCristobal, Chevalet and Haley2006a), in agreement with the local breeds’ ‘uniqueness’ shown in Figure 1.
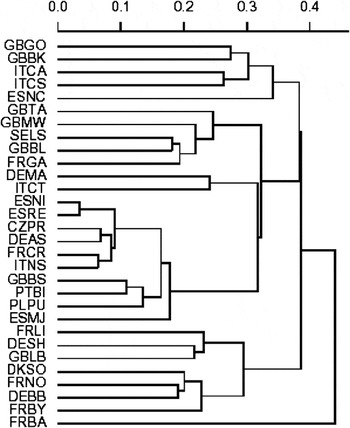
The taxonomy of the 30 local breeds investigated in the European projects is given in Figure 4. This is the rooted tree generated by applying V to this subset of breeds (see previous section). The longest branch is that of the French Basque, the breed contributing most to European between-breed diversity. The graph also shows the non-additivity of individual breed contributions, since the joint contribution of Gloucester Old Spots (GBGO) and Berkshire (GBBK) for example, represented by the abscissa of their node (about 0.3), is much less than the sum of their individual branch lengths.
Weitzman tree of the 30 local breeds of PiGMaP and PigBioDiv, based on Reynolds distances (Reynolds et al., Reference Reynolds, Weir and Cockerham1983) for microsatellites. The breeds (PiGMaP breeds in bold) are from – Czech Republic: CZPR Presticke; France: FRBA Basque, FRBY Bayeux (Breed not considered in the PigBioDiv scientific papers), FRCR Créole (Guadeloupe), FRGA Gascon, FRLI Limousin, FRNO Normand; Germany: DEAS Angler Sattelschwein, DEBB Bunte Bentheimer, DEMA Mangalica, DESH Schwäbisch-Hällisches Schwein; Denmark: DKSO, Sortbroget; Italy: ITCA Calabrese, ITCS Cinta Senese, ITCT Casertana, ITNS Nera Siciliana; Poland: PLPU Pulawska; Portugal: PTBI Bisaro; Spain: ESNC Negro Canario, ESNI Negro Iberico, ESMJ Manchado de Jabugo, ESRE Retinto; Sweden: SELS Linderödssvin; United Kingdom: GBBK Berkshire, GBBL British Lop, GBBS British Saddleback, GBGO Gloucester Old Spots, GBLB Large Black, GBMW Middle White, GBTA Tamworth.

Figure 4 shows no marked geographical clustering of the British, French, German and Italian breeds, in contrast with the Iberian cluster evidenced, which could have been expected from the common origin of the Retinto (RE) and Negro Iberico (NI) breeds. These, in fact, may be seen as two strains of the Iberian breed. To be noted, however, is the distinctive position of the other two Spanish breeds, the Manchado de Jabugo (MJ), known to be somewhat apart from the Iberian group (Martinez et al., Reference Martinez, Delgado, Rodero and Vega-Pla2000), and the Negro Canario (NC), for which there is evidence of some African connection (Juan-Vicente Delgado, personal communication).
Particularly surprising is the close genetic vicinity of breeds originating from two islands as distant as Guadeloupe (FRCR) and Sicily (ITNS). It is also of interest to compare the MS-based clustering of Figure 4 with the history of the world pig breeds as reported in the popular handbook of Porter (Reference Porter1993). In several cases, the documented history of ‘old’ breeds is not supported by the clustering observed. The Créole pig (FRCR), for instance, is quite far away from the Large Black (GBLB), reported as being among its main founding breeds. Similarly, the Polish Pulawska (PLPU), reportedly originating from a cross with GBBK is quite distant from this breed. No trace appears to remain of the reported proximity of the Neapolitan pig, presently represented by the Italian Casertana (ITCT) breed, to several English breeds. This probably reflects the continuously blurred phylogeny of pig breeds as a consequence of complex migration–admixture patterns, varying both in time and space.
Molecular and quantitative trait diversity
Breed diversity is probably the most useful information that can be drawn from a set of genetic distances in a context of conservation. This leaves open the question of the relevance of neutral marker diversity (anonymous) with regard to quantitative trait diversity (functional). One should, however, avoid concluding on the neutrality of the diversity measured from the supposed intrinsic neutrality of the markers used. We know that neutral genes can be affected by selection applied to neighbouring genes, a phenomenon known as gene hitchhiking (Maynard Smith and Haig, Reference Maynard Smith and Haig1974). Selection acts on the whole genome and diversity is generated under the dynamics of multi-locus systems. This situation is in fact exploited, in reverse, in marker-assisted selection procedures using markers close to quantitative trait loci (QTL). Quite extensive QTL maps are now available for most farm animals, including the pig. Due to their adequate coverage of the pig genome, most of the 50 MS used in PigBioDiv have indeed been shown to be linked to a large number of quantitative traits (Ollivier and Foulley, Reference Ollivier and Foulley2009Footnote 2). One would then expect to find some correlation between marker and quantitative trait diversity, particularly for those markers closely linked to QTL and in LD with the latter.
The testing of marker neutrality, however, is a challenging task. This is a field of evolutionary biology which has been extensively investigated for many years, and particularly with the recent advent of genome scans of DNA polymorphisms to elucidate the genetic basis of adaptive divergence in natural populations (reviewed, among others, by Storz, Reference Storz2005). Similarly, the adaptation of domestic breeds to local conditions or to specific production objectives is expected to generate increased between-breed diversity and/or decreased within-breed diversity at those loci underlying the traits under selection, and at nearby neutral marker loci.
Differentiation between populations, as measured by FST, is the basis of the test of selective neutrality proposed by Lewontin and Krakauer (Lewontin and Krakauer, Reference Lewontin and Krakauer1973). The basic argument behind this test is that, under the null hypothesis of neutrality, differentiation at all loci should be the same. The observed variance of FST across marker loci can thus be tested against its expected value under the assumption of neutrality. Several improvements of the test have been proposed (reviewed by Ollivier and Foulley, Reference Ollivier and Foulley2009), essentially for taking into account the pattern of relationship among populations. Robertson’s prediction (Reference Robertson1975) that any ‘structured’ relationship will tend to increase the variance of FST has indeed been confirmed in PigBioDiv. For both MS and AFLP, a lesser departure from neutrality was observed by removing half of the breeds in order to approximate a star-like pattern of phylogeny (Foulley et al., Reference Foulley, van Schriek and Alderson2006). Nevertheless, after correction for this effect, the Lewontin–Krakauer (LK) test showed highly significant departures from neutrality for both markers, particularly large for AFLP. Methods for distinguishing loci under selection from neutral loci require assumptions on the demographic history of the populations and may be sensitive to the model implemented. The above modifications of the LK test preserve its advantage of being a model-free approach based on detecting outlier loci. This type of approach is likely to prevail when a large number of loci will be available, as with the SNP study by Akey et al. (Reference Akey, Zhang, Zhang, Li and Shriver2002) in human populations. Encouraging results have, however, been obtained in a model-based approach using a Bayesian regression method (Beaumont and Balding, Reference Beaumont and Balding2004).
The neutrality tests, based on relative levels of diversity within populations, exploit the reduction of variability around a selected locus due to hitchhiking, a phenomenon called ‘selective sweep’. Schlötterer et al. (Reference Schlötterer, Vogl and Tautz1997) proposed a test based on the variance of repeat number at MS loci. This test, however, may be sensitive to the demography-mutation model assumed. A more robust test can be performed by comparing groups of populations. The test statistic is the log of the ratio of variance in repeat number in two groups (Schlötterer, Reference Schlötterer2002). An application of this test to the PigBioDiv data showed the existence of ‘outlier’ loci with contrasting allele size distributions between groups of breeds, indicative of selective sweeps (Ollivier and Foulley, Reference Ollivier and Foulley2009).
Lessons and opportunities offered
PigBioDiv was one of the ‘demonstration projects’ introduced in the life science and technologies programmes of EC as a ‘mechanism aimed at fostering the adoption of research results in real-life practice’ (Le Dour et al., Reference Le Dour, Nordstedt and Aguilar2000). PigBioDiv’s objective was indeed to demonstrate the applicability of molecular biology tools for evaluating pig genetic diversity. Use was made of two standard marker technologies, and a wide spectrum of pig populations was examined. The activities pursued have been successful in making advances in the basic experimental design, operational modalities and analytical procedures for the broad-scale evaluation of animal genetic resources. The project has also demonstrated how effectively commercial and public sector entities, and research staff can work together. Useful guidelines for future biodiversity projects were thus provided. Some prospects opened by further exploitation of the results will now be briefly discussed.
Methodology
This work has been a source of methodological developments on various classical concepts related to genetic diversity evaluation, such as Wright’s fixation indices, genetic distances and the Weitzman approach to diversity (Ollivier and Foulley, Reference Ollivier and Foulley2005). In particular, the difficulties of analysis of dominant marker data such as AFLP have been thoroughly investigated. For that type of markers, Foulley et al. (Reference Foulley, van Schriek and Alderson2006) could recommend the moment-based approach of Hill and Weir (Reference Hill and Weir2004) instead of the currently used procedures, in order to avoid potentially considerable biases in allele frequency and genetic diversity estimates. Bonin et al. (Reference Bonin, Ehrich and Manel2007) also comment on the considerable differences between the latter results and those obtained with the square root method by SanCristobal et al. (Reference SanCristobal, Chevalet and Haley2006b) on the same data, suggesting that the method of Hill and Weir (Reference Hill and Weir2004) may be particularly helpful in cases of low levels of polymorphism. Further methodological developments can be foreseen for marker-based assignment and kinship estimation. Measuring genetic diversity in farm animals, however, still remains a challenge. Some insight into the multiple facets of this endeavour is given in the review of Ollivier and Foulley (Reference Ollivier and Foulley2009).
Microsatellite individual genotyping
The advantages of MS for evaluating diversity have now been known for a long time. Their abundance, wide dispersion over the genome and highly automated characterisation make them a marker of choice. Difficulties, however, have been recognised in harmonising results from different laboratories, which requires standardisation of allele size. A coding system has been established in PigBioDiv, based on the mean and range of allele size compared to four control samples used in PiGMaP (Ollivier, Reference Ollivier2002).
DNA pool genotyping
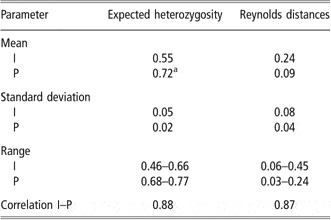
Microsatellite genotyping on DNA pools, known to be a cost-effective means to estimate allele frequencies, was also investigated in PigBioDiv. The need to select markers adapted to this technique (Groenen et al., Reference Groenen, Joesten, Boscher, Amigues, Rattink, Harlizius, van den Poel and Crooijmans2003) and other technical difficulties restricted the typing to 20 out of the 50 markers used in individual typing. The technique is known to produce fluorescence peaks, which are clearly artefacts, as confirmed in this study by the large excess of peaks compared to the number of alleles identified on the same breeds. Consequently, as shown in Table 3, expected heterozygosities were considerably larger and Reynolds distances lower, and both less variable, when based on peak frequencies observed on DNA pools compared to allele frequencies in individual samples from the same 22 breeds. In addition, the correlations in Table 3 show that peak frequencies cannot provide accurate prediction of the standard diversity parameters. Discarding supernumerary peaks, as Megens et al. (Reference Megens, Crooijmans, San Cristobal, Hui, Li and Groenen2008) did on the same data, also led to poor predictions of diversity parameters and markedly lower bootstrap values in breed clustering compared to individual typing. A statistical procedure to estimate allele frequencies (as proposed, for instance, by Skalski et al. (Reference Skalski, Couch, Garher, Weir and Sullivan2006)) appears, therefore, necessary in order to best exploit the information given by DNA pools.
Comparison of expected heterozygosity and Reynolds genetic distances (Reynolds et al., Reference Reynolds, Weir and Cockerham1983) obtained from individual (I) and pooled (P) DNA samples, typed for 20 microsatellites on 22 breeds (adapted from the PigBioDiv final report: Ollivier, Reference Ollivier2002)

a0.77 on 52 European breeds reported by Megens et al. (Reference Megens, Crooijmans, San Cristobal, Hui, Li and Groenen2008).
A pig diversity database
The Roslin Institute was chosen as the ultimate data repository site in PigBioDiv. A database was mounted on the Roslin webserver and the data collected during the project were made available to the participants created at http://www.databases.roslin.ac.uk/pigdbase/
Later on, a publicly available website was created at http://www.projects.roslin.ac.uk/pigbiodiv/publications.html, mentioned previously, for a wider dissemination of the PigBioDiv results, offering innovative opportunities to the pig industry (Roslin Institute, 2005). Rules of access to this information have been defined in an agreement signed by the PigBioDiv parties, and put under the guidance of a specific committee (ConservPig Management Group) representing the interest of all parties. More information on the PigBioDiv results are available upon request to the present Chair of the GroupFootnote 3, or to the author.
Some information on the PigBioDiv2 project (Blott et al., Reference Blott, Andersson, Groenen, SanCristobal, Chevalet, Cardellino, Li, Huang, Li, Plastow and Haley2003) is available at https://mysygen.sygeninternational.com/portal/page?_pageid=95,50664,95_50699&_dad=portal&_schema=PORTAL
A DNA bank
During PigBioDiv, DNA has been collected over a set of 59 populations of pigs, originating from 13 European countries and including one Chinese breed. Part of this DNA has been stored in a duplicated DNA bank, at Roslin (UK) and Toulouse (France) in view of further research. The corresponding genotypes for 50 MS and 148 AFLP loci are stored in the database described earlier. Rules of access to this DNA have been defined by the PigBioDiv parties, and put under the guidance of the above-mentioned ConservPig Management Group. This DNA depository, together with the database including the corresponding sample information, should provide support for further innovative research in the field of domestic animal diversity management.
Acknowledgements
The author wishes to thank Roberta Davoli (Reggio Emilia), Juan-Vicente Delgado (Cordoba), Gustavo Gandini (Milan) and Jean-Louis Foulley (Jouy-en-Josas) for their help in the preparation of this article. Particular thanks should also go to Alan Archibald, Chris Haley and Andy Law (Roslin) for their care of the ‘pigbiodiv’ database. The research was supported by the EU contracts BIO2-CT94-3044, RESGEN-CT95-012 and BIO4-CT98-0188, which are gratefully acknowledged. Comments made by three anonymous referees have also been of great help.