

Introduction
The first synapse in the retina, between photoreceptors and bipolar cells (BCs), creates a functional segregation resulting in On and Off parallel pathways that encode luminance increments and decrements. At this synapse, an excitatory center/inhibitory surround receptive field (RF) organization also is established in the BCs via feedback inhibition from horizontal cells to photoreceptors (Werblin & Dowling, Reference Werblin and Dowling1969; Werblin, Reference Werblin1991; Endeman et al., Reference Endeman, Fahrenfort, Sjoerdsma, Steijaert, Ten Eikelder and Kamermans2012; Thoreson & Mangel, Reference Thoreson and Mangel2012; Wang et al., Reference Wang, Holzhausen and Kramer2014; Vroman & Kamermans, Reference Vroman and Kamermans2015). This center/surround RF organization is relayed from BC to retinal ganglion cell (RGC; Kuffler, Reference Kuffler1953; Lukasiewicz & Werblin, Reference Lukasiewicz and Werblin1990; Rodieck & Stone, Reference Rodieck and Stone1965; van Wyk et al., Reference van Wyk, Wässle and Taylor2009; Werblin, Reference Werblin1991) and augmented by amacrine cell (AC)-mediated inhibitory circuits in the inner retina (Flores-Herr et al., Reference Flores-Herr, Protti and Wässle2001; Eggers et al., Reference Eggers, Mccall and Lukasiewicz2007; Eggers & Lukasiewicz, Reference Eggers and Lukasiewicz2010; Farrow et al., Reference Farrow, Teixeira, Szikra, Viney, Balint, Yonehara and Roska2013; Protti et al., Reference Protti, Di Marco, Huang, Vonhoff, Nguyen and Solomon2014).
A clear and direct role for gamma amino butyric acid (GABAergic) input from wide-field ACs to RGCs to augment the RF surround has been observed across species (frog, Bonaventure et al., Reference Bonaventure, Wioland and Roussel1980; Bonaventure & Wioland, Reference Bonaventure and Wioland1981; tiger salamander, Cook & McReynolds, Reference Cook and McReynolds1998; Roska et al., Reference Roska, Nemeth, Orzo and Werblin2000; rabbit, Buldyrev & Taylor, Reference Buldyrev and Taylor2013; Flores-Herr et al., Reference Flores-Herr, Protti and Wässle2001; Russell & Werblin, Reference Russell and Werblin2010; cat, Kirby & Enroth-Cugell, Reference Kirby and Enroth-Cugell1976). In contrast, glycinergic inputs that usually involve narrow field ACs are more commonly associated with RGC RF center modulation, and/or crossover interactions between the On and Off pathways (O'Brien et al., Reference O'brien, Richardson and Berson2003; Manookin et al., Reference Manookin, Beaudoin, Ernst, Flagel and Demb2008; Münch et al., Reference Münch, Da Silveira, Siegert, Viney, Awatramani and Roska2009; van Wyk et al., Reference van Wyk, Wässle and Taylor2009; Chen et al., Reference Chen, Hsueh, Greenberg and Werblin2010; Nobles et al., Reference Nobles, Zhang, Muller, Betz and Mccall2012; Buldyrev & Taylor, Reference Buldyrev and Taylor2013; Di Marco et al., Reference Di Marco, Protti and Solomon2013; Zhang et al., Reference Zhang, Rompani, Roska and Mccall2014). However, several observations are consistent with a glycinergic modulation of RGC RF surrounds. RGCs lack RF surrounds in the spastic mouse, where the primary defect is a reduction in overall glycinergic synaptic transmission (Stone & Pinto, Reference Stone and Pinto1992). Similarly, blocking glycinergic transmission with strychnine alters cat RGC RF center/surround organization (Caldwell & Daw, Reference Caldwell and Daw1978a; Kirby, Reference Kirby1979). Wide-field GABAergic ACs express glycine receptors (GlyRs) (Weiss et al., Reference Weiss, O'sullivan, Heinze, Chen, Betz and Wässle2008; Majumdar et al., Reference Majumdar, Weiss and Wässle2009) and participate in morphologically identified AC concatenated circuits (Anderson et al., Reference Anderson, Jones, Watt, Shaw, Yang, Demill, Lauritzen, Lin, Rapp, Mastronarde, Koshevoy, Grimm, Tasdizen, Whitaker and Marc2011; Chen et al., Reference Chen, Hsueh and Werblin2011). Our previous observations in GlyR α3 subunit knockout (KO) mice (Nobles et al., Reference Nobles, Zhang, Muller, Betz and Mccall2012) are consistent with GlyR modulation of GABA inputs to ON RGC responses in a serial inhibitory circuit. Together these data show strong but indirect evidence for glycinergic subunit modulation of GABAergic inputs to RGC RF surrounds.
We and others (Stone & Pinto, Reference Stone and Pinto1992; Wässle et al., Reference Wässle, Heinze, Ivanova, Majumdar, Weiss, Harvey and Haverkamp2009; Nobles et al., Reference Nobles, Zhang, Muller, Betz and Mccall2012) have developed and used both GlyRα mutant and KO mice and knockdown strategies (Zhang et al., Reference Zhang, Rompani, Roska and Mccall2014) as substitutes for a lack of subunit selective glycine antagonists. With these approaches, we (Nobles et al., Reference Nobles, Zhang, Muller, Betz and Mccall2012) have shown that GlyRα2 and GlyRα3 inputs enhance the RF ON center excitatory response. In contrast, only GlyRα2 inputs enhance the RF OFF center response.
Here, using the same GlyRα2 and GlyRα3 KO mice and annular stimuli to isolate the RF surround, we addressed the question of GlyR subunit-specific contributions to the RF surround of ON- and OFF-center RGCs. Our results show that GlyRα2 inputs enhance the RF surround of OFF RGCs, and that the RF surround of ON RGCs is not modulated by either GlyRα2 or GlyRα3 inputs.
Materials and methods
Animals
Similar to Nobles et al., Reference Nobles, Zhang, Muller, Betz and Mccall2012, we used four different mouse lines: C57BL/6J wild type (WT) control mice, GlyRα2 KO mice (Glra2 −/−, Young-Pearse et al., Reference Young-Pearse, Ivic, Kriegstein and Cepko2006; Jackson Labs Accession: 007065), or GlyRα3 KO mice (Glra3 −/−, Harvey et al., Reference Harvey, Depner, Wässle, Ahmadi, Heindl, Reinold, Smart, Harvey, Schutz, Bo-Salem, Zimmer, Poisbeau, Welzl, Wolfer, Betz, Zeilhofer and Muller2004) and GlyRα2 and GlyRα3 double KO mice (Glra2/3 −/−, Nobles et al., Reference Nobles, Zhang, Muller, Betz and Mccall2012). All mice were backcrossed onto a C57BL/6J background and maintained at the University of Louisville on a 12:12 h light/dark schedule. All mice in each line were at least 2 and no older than 7 months at the time of recording. Data were collected from both male and female mice. We found no consistent differences based on either age or gender. All experimental procedures conformed to principles regarding the care and use of animals adopted by the American Physiological Society and the Society for Neuroscience. All protocols were approved by the Institutional Animal Care and Use Committee at the University of Louisville.
Surgical preparation
All surgical procedures have been previously published (Sagdullaev & McCall, Reference Sagdullaev and McCall2005; Nobles et al., Reference Nobles, Zhang, Muller, Betz and Mccall2012). Briefly, anesthesia was induced with an intraperitoneal injection of a Ringer's solution containing ketamine and xylazine. In WT mice the induction dose was 127:12 mg/kg. In Glra2 −/− and Glra2/3 −/− mice an increase of 12.5% was required to induce a surgical plane of anesthesia. Anesthesia was maintained throughout the experiments with supplemental subcutaneous injections (50% of initial concentration) administered about every 45 min. The head was secured in a stereotaxic frame (David Kopf Instruments, Tujunga, CA) with ear cups and a bite bar. Body temperature was maintained at 37°C with a feedback controlled heating pad (TC-1000; CWE, Ardmore, PA). Topical Mydfrin (Phenylephrine hydrochloride ophthalmic solution 2.5%) and Mydriacyl (Tropicamide ophthalmic solution 1%; Alcon Labs, Inc., Fort Worth TX.) were applied to dilate the pupils and paralyze accommodation. To prevent drying of the corneas, clear zero-powered lenses (Sagdullaev et al., Reference Sagdullaev, Demarco and Mccall2004) moistened with artificial tears (Akwa Tears, Akorn, Inc., Lake Forest, ILL) were placed over the eyes. A craniotomy was performed anterior to the Bregma suture and the overlying cortex was removed using suction to expose the optic nerve.
Electrophysiology recordings from optic nerve fibers
All experiments were performed at light adapted levels and all recording techniques also have been previously published (Sagdullaev & McCall, Reference Sagdullaev and McCall2005; Nobles et al., Reference Nobles, Zhang, Muller, Betz and Mccall2012). Action potentials were recorded extracellularly from single RGC axons using sharpened tungsten electrodes (final impedance 70–100 MΩ). Action potentials were isolated, amplified (X3+Cell, FHC, Bowdoin, ME), digitized at 15 kHz (Power1401, Cambridge Electronic Design (CED) Cambridge, United Kingdom) and stored for offline analysis. The spiking response was isolated from background, displayed on an oscilloscope (60 MHz, Tektronix Inc., Beaverton, OR) and computer monitor (Spike2, CED) and played over an audio monitor (AM7, Grass Instruments, Quincy, MA).
Responses were analyzed offline using Spike2 software (CED). Spikes were accumulated using a 50 ms bin width, displayed as an averaged post-stimulus time histogram, which was smoothed by fitting it with a raised cosine function with a 50 ms smoothing interval (Sagdullaev & McCall, Reference Sagdullaev and McCall2005).
Quantitative characterization of RGC visual response properties
The position, spatial extent, and RF center sign of each RGC were determined using a handheld light source projected onto a screen located 25 cm from the anterior nodal point of the eye. All quantitative measures of RGC visually evoked responses were evoked by stimuli (VisionWorks; Vision Research Graphics, Durham, NH.) presented a CRT display monitor with a photopic level mean luminance of 20 cd/m2 (Eizo E120 FlexScan FXC7). Stimulus and RF dimensions, described in the text, are presented as μm on the retina unless otherwise noted. The RF center responses of most of the RGCs (98%) in this study have been reported previously (Nobles et al., Reference Nobles, Zhang, Muller, Betz and Mccall2012). In a few RGCs only the RF center responses were characterized and this was the sole basis for exclusion in this study.
Receptive field surround analysis
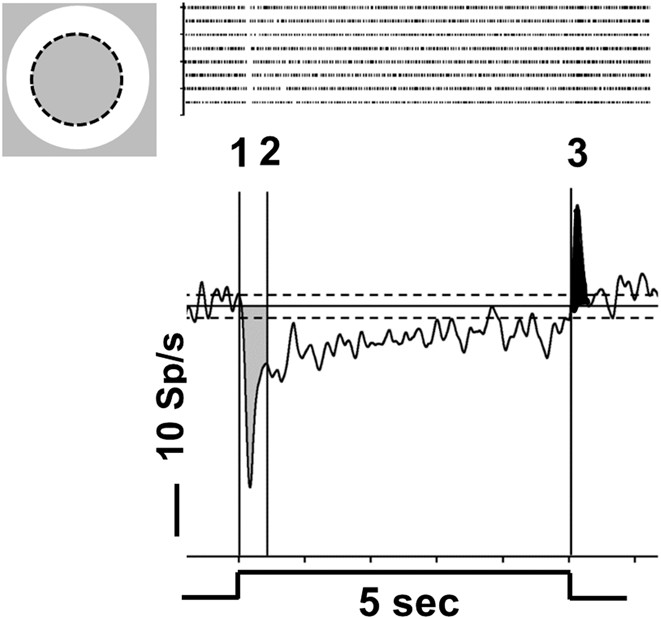
Annular stimuli with a fixed outer diameter (4425 μm) were centered on the RF center and their inner diameter (ID) varied in eight steps (0, 270, 372, 544, 754, 1043, 1587, and 2616 μm). Each annulus ID was presented eight times for 5 s and a 5-s inter-stimulus interval separated presentations. These trials were randomly interleaved with blank trials where the screen remained at 20 cd/m2. Because we modulate luminance 100 cd/m2 above (ON RGCs) and 3 cd/m2 below (OFF RGCs) around this mean luminance, we compute a Michelson contrast of 67% for increments and decrements. To each ID, as well as to blank trials, we computed an average peri-stimulus time histogram (PSTH) response. Fig. 1 is a representative average PSTH and illustrates the response characteristics we quantified from the average PSTHs. Mean spontaneous activity (SA) was computed from spiking activity during blank trials and is plotted as the solid horizontal line along with the two dashed lines that define ±3 SEM from mean SA. Annulus-evoked excitatory and suppressive responses were considered significant when their amplitude was at least ±3 SEM from mean SA. All responses were corrected for mean SA and all results are presented as the corrected response amplitude unless otherwise noted.
An annular stimulus isolates the mouse RGC RF surround and evokes a suppressive response. Top left—Schematic diagram of an annular stimulus (bright ring; 100 cd/m2) superimposed on a WT ON RGC RF (RF center = dotted circle) and presented on a background (20 cd/m2). Top right—Raster plots of individual spiking responses to each stimulus presentation (n = 8). Below-average PSTH illustrates the average response suppression evoked by the annular stimulus [e.g., spiking activity significantly lower than −3 SEM of mean SA (solid horizontal lined); ±3 SEM (dashed horizontal lines)]. Stimulus duration (5 s) is indicated below the PSTH. Response duration is measured from the time the mean spiking rate drops below −3 SEM of mean SA (onset) until it returns to mean SA. Response suppression is divided into an initial component (0–0.4 s; shaded gray) followed by a remaining suppression of variable duration (cursors 2–3; 0.4–5 s). Stimulus offset evokes an excitatory response (≤0.5 s after stimulus offset; shaded black).

In all WT RGCs, the onset of an annular stimulus evoked a response with an initial transient component (Fig. 1) that was followed in most RGCs by a more sustained response in the continued presence of the stimulus. Using WT RGCs, we determined the time the initial response decayed to 37% of maximum. This yielded a mean duration of 0.4 s after stimulus onset and occurred regardless of whether the RGC response was excitatory (annuli with small IDs) or suppressive (annuli with larger IDs). A similar response decay also was found in RGCs recorded in KO mice. Therefore, we measured the peak or minimum firing rate during the first 0.4 s after stimulus onset (Fig. 1, cursors 1–2) defined it as the initial RF surround response. We measured the average firing rate during the remainder of the stimulus presentation (0.4 until 5 s; Fig. 1, cursors 2–3) and defined it as the remaining RF surround response. Response duration was computed from the time the response crossed 3 SEM of the mean SA until it returned to mean SA, regardless of whether the response was excitatory or suppressive. The post-stimulus response was computed as the peak firing rate during the 0.5 s following stimulus offset. In almost all RGCs there was a transition between the excitatory and suppressive responses, where no response was evident. We computed this ID to define an annulus-evoked balanced response.
In some RGCs annulus onset evoked an initial suppression whose minimum firing rate reached 0 Spikes/s (Sp/s). In these RGCs, quantification of spiking suppression does not accurately estimate the amount of inhibition in this portion of the response because additional inhibition may occur but the firing rate cannot dip below 0 Sp/s. We eliminated these RGCs when we estimated the magnitude of initial transient suppression. The suppression that followed was not maintained at 0 Sp/s and therefore all RGCs were included in these comparisons. To augment this analysis, we compared the proportions of RGCs whose initial suppression reached 0 Sp/s across genotype.
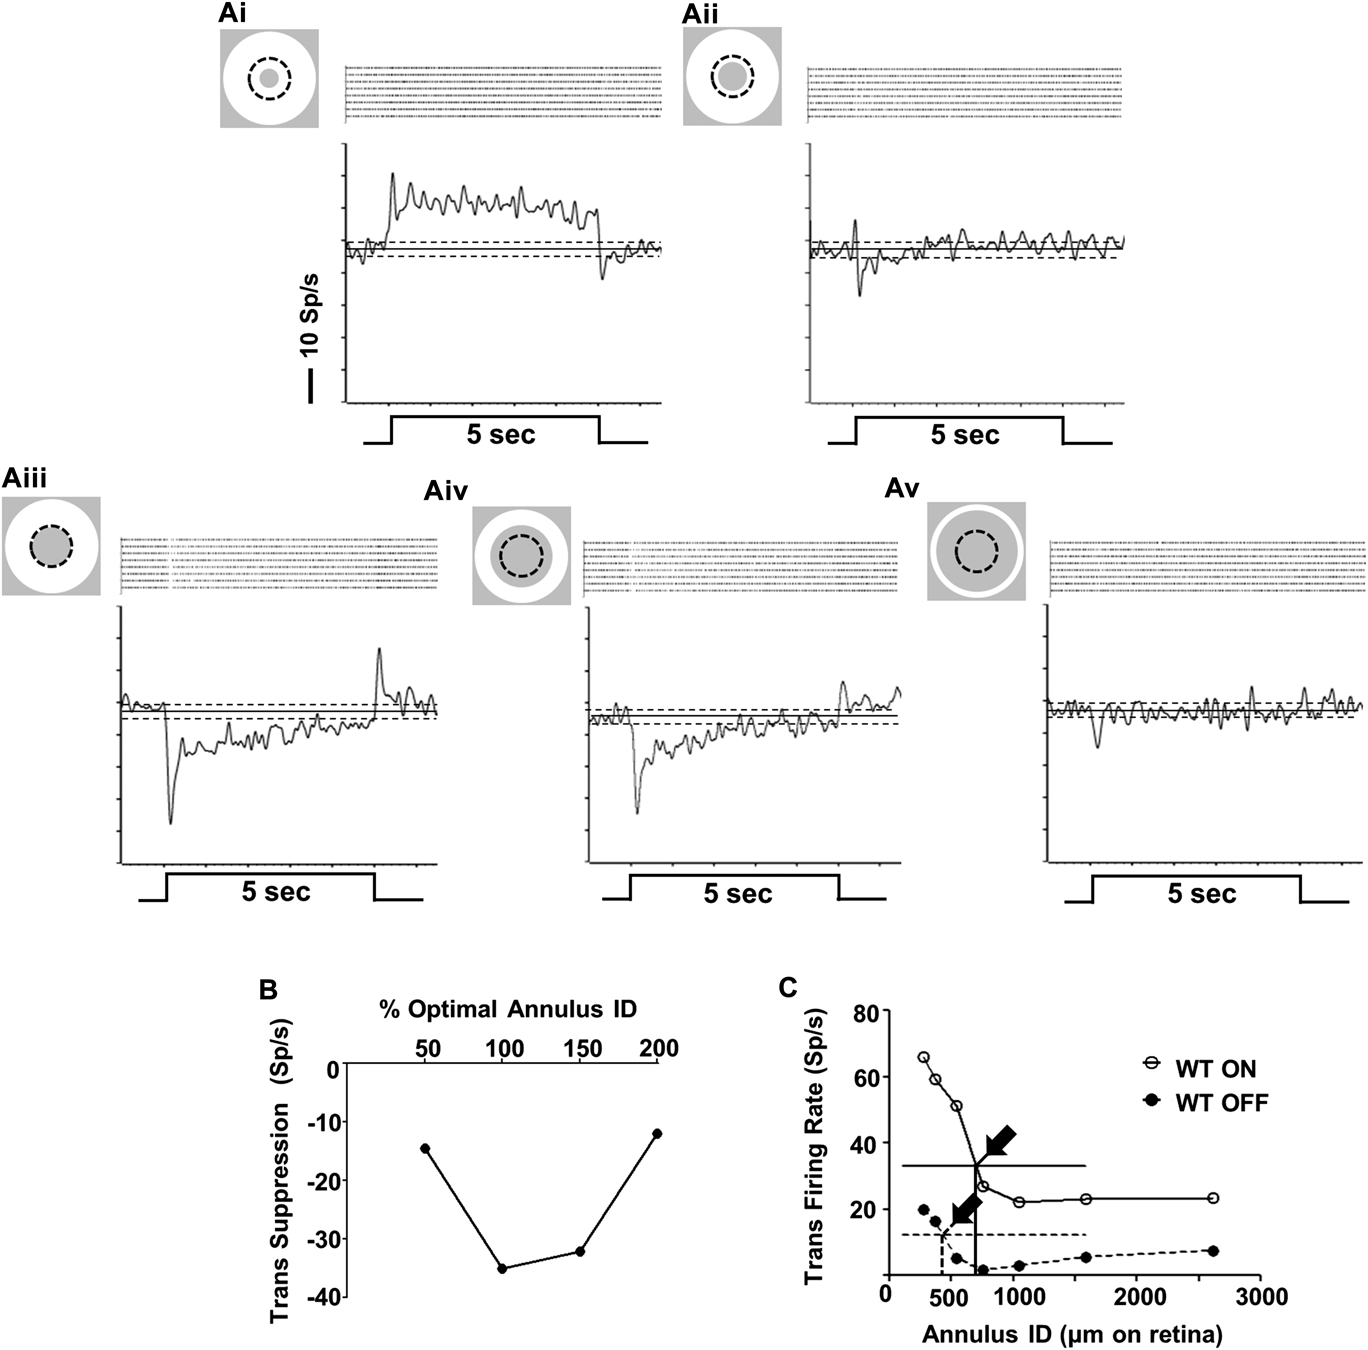
The optimal annulus ID was defined as the stimulus that evoked maximal suppression relative to mean SA (See Fig. 2) across all IDs. Finally, a few ON and OFF WT RGCs had RF center diameters larger than the widest annular ID (2616 μm on the retina) produced on our display. These RGCs were not included in our analysis.
The response profiles of ON and OFF WT RGCs change with annulus inner diameter (ID). (A) Representative, average PSTHs and raster plots from a WT ON RGC evoked by annuli with fixed outer diameter and increasing IDs. (Ai) Annuli with IDs smaller than the RF center (dotted circle) evoke an excitatory response. (Aii) As ID increases, responses go through a null response point, where RF center excitation and surround suppression are balanced. (Aiii) As annular ID increases and only the RF surround is stimulated a maximum response suppression is reached (optimal ID). (Aiv, Av) Annuli with larger IDs stimulate less surround and evoke less suppression. (B) Initial surround suppression of the RGC in A plotted as a function of percentage of the optimal ID (100%). (C) Initial surround suppression of representative WT ON and OFF RGCs plotted as a function of annular ID. Excitatory responses occur above, whereas suppressive responses occur below the horizontal lines indicating mean SA. The balanced-response IDs for each RGC are indicated by arrows. All other conventions as in Fig. 1.
Statistical analysis
Statistical analyses were performed using Prism5 Software (GraphPad, La Jolla, CA). Distributions of each response parameter were tested for normality using the D'Agostino and Pearson omnibus test and appropriate parametric or nonparametric statistical analyses were applied. A t-test with Welch's correction was used to compare RGCs between different genotypes. A two-way Analysis of Variance (ANOVA) with Bonferroni's post hoc tests was used to compare RGC response components across spot size between WT and GlyRα2 or GlyRα3 RGCs or between GlyRα2 or GlyRα3 and GlyRα2/3 double KOs. In all figures, data are plotted as the mean ± SEM and significance is indicated as *P < 0.05, **P < 0.01, ***P < 0.001.
Results
Most WT mouse RGCs have isolated RF suppression
In this analysis, as well as in our previous publications (Sagdullaev & McCall, Reference Sagdullaev and McCall2005; Nobles et al., Reference Nobles, Zhang, Muller, Betz and Mccall2012), we use in vivo extracellular recordings from the optic nerve as a screening tool to evaluate visually evoked responses of a variety of RGC functional classes. This preparation has the advantage that the retina in situ, is very close to normal physiological conditions. Because we record in the optic nerve with tungsten electrodes similar to those used to in studies with cat (e.g., Boycott & Wässle, Reference Boycott and Wässle1974), we assume our electrode bias is similar and RGCs with the largest somas/axons predominate (see Nobles et al., Reference Nobles, Zhang, Muller, Betz and Mccall2012). In the mouse, we presume that the RGCs should be the A-type and should include sustained (delta) and transient (alpha) OFF RGCs, as well as sustained (alpha) ON RGCs, which is consistent with our previous results (Nobles et al., Reference Nobles, Zhang, Muller, Betz and Mccall2012).
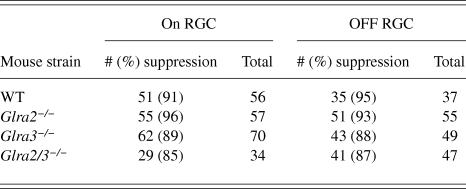
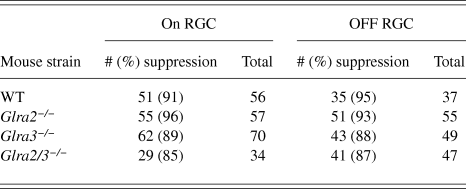
In response to annular stimulation of their RF surround, 92% of WT RGCs (91% of ON and 95% of OFF; Table 1) showed significant response suppression. In all of these RGCs, annuli with small IDs restricted within the RF center evoked excitatory responses (Fig. 2Ai). As ID increased, the excitatory response declined and passed through a null point where the annulus evoked little or no response (Fig. 2Aii), representing balanced RF center excitation and surround inhibition. Further increases in ID evoked suppressive responses and reached maximum suppression, which defined the optimal ID (Fig. 2Aiii). In most RGCs, suppression declined as ID increased and stimulated less of the RF surround (Fig. 2Aiii–2Av). All RGC suppressive responses had an initial transient response component. This can be seen for representative WT ON (Fig. 2A–2C) and for a WT OFF RGC (Fig. 2C). In all of these WT ON and OFF RGCs, at least one annulus ID larger than optimal also evoked a suppressive response. Many RGCs (45% of ON and 80% of OFF WT RGCs), also had significant suppression at two or more annulus IDs larger than optimal. For each RGC, we measured the annulus ID that evoked the balanced response as a function of the ID on the retina (Fig. 2C). The balanced ID was significantly larger in ON (n = 51) compared to OFF RGCs (n = 35; 829 ± 63 µm vs. 578 ± 52 µm, P = 0.02). Because both the RF center diameter and response amplitude of WT ON and OFF RGCs in our sample were similar (Nobles et al., Reference Nobles, Zhang, Muller, Betz and Mccall2012), this suggests that suppression strength differs within the surrounds of ON and OFF RGCs.
RGCs with surround suppression are similar across genotype.
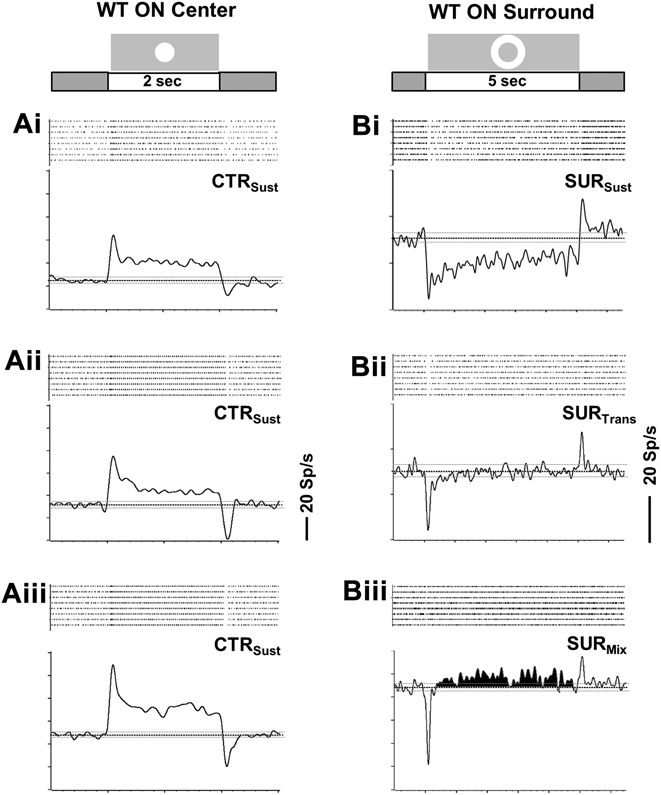
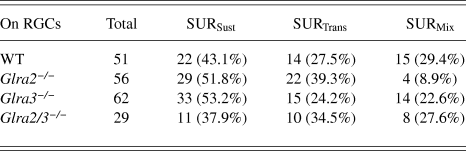
Following the initial surround suppression at stimulus onset, we observed one of three response profiles to the continued presence of the stimulus (remaining surround suppression) in WT ON RGCs (Fig. 3B; Table 2). In 43.1% of WT ON RGCs, the remaining surround suppression was sustained (SURSust; Fig. 3Bi), matching stimulus duration (5 s). In 27.5%, the remaining surround suppression was transient (SURTrans; Fig. 3Bii), returning to mean SA within 4 s after stimulus onset. In 29.4%, the initial surround suppression was followed by a significant excitation whose duration was variable, e.g., not matched to stimulus duration (SURMix; Fig. 3Biii, shaded area).
WT sustained ON RGCs exhibit three different RF surround suppression profiles. (A & B) Average PSTHs and raster plots for three WT sustained ON RGCs. (A) RF center responses (CTRSust) evoked by a bright spot (100 cd/m2) centered on the RF and presented on a 20 cd/m2 background for 2 s. (B) RF surround responses for the same RGCs evoked by a bright annulus (100 cd/m2) on the same background. Annulus onset evokes a significant initial reduction in spiking (within 0.4 s) below mean SA that is followed by one of three response profiles during the continued presentation of the stimulus (0.4–5 s; remaining surround suppression): (Bi) Spiking activity remains significantly lower than mean SA for the entire stimulation (SURSus). (Bii) Spiking activity returns to mean SA prior to stimulus offset (SURTrans). (Biii) Spiking activity increases significantly above mean SA (SURMix) although the annulus remains. Stimulus profiles and durations are shown at the top of each column (2 s for center and 5 s for surround stimulation). All other conventions the same as in Figs. 1 and 2.
Summary of ON RGCs with three different maintained temporal response profiles across genotype.
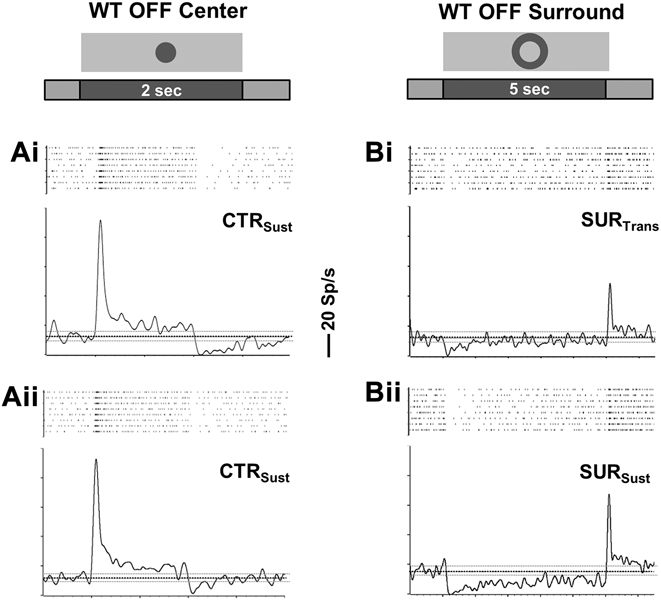
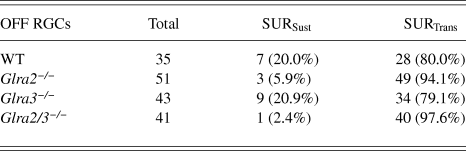
We observed two response profiles in the remaining surround suppression of WT OFF RGCs (Fig. 4B; Table 3). In the majority (80%) of WT OFF RGCs the remaining surround suppression was transient (SURTrans; Fig. 4Bi), whereas in the other 20% it was sustained, matching stimulus duration (SURSust; Fig. 4Bii).
WT sustained OFF RGCs exhibit two different RF surround suppression profiles. (A & B) Average PSTHs and raster plots for two WT sustained OFF RGCs. (A) RF center responses (CTRSust) evoked by a dark spot (3 cd/m2) centered on the RF and presented on a 20 cd/m2 background. (B) RF surround responses for same RGCs in A evoked by an dark annulus (3 cd/m2) on the same background. Annulus onset evokes a significant initial reduction in spiking (within 0.4 s) below mean SA that is followed by one of two response profiles during the continued presentation of the stimulus (0.4–5 s): (Bi) Spiking activity returns to mean SA prior to stimulus offset (SURTrans). (Bii) Spiking activity remains significantly lower than mean SA for the entire duration of stimulation (SURSust). Conventions as in Figs. 2 and 3.
Summary of OFF RGCs with sustained and transient maintained response profiles across genotype.
The temporal nature of the RF center response is thought to reflect inputs from sustained and transient parallel pathways (Cleland et al., Reference Cleland, Dubin and Levick1971, Reference Cleland, Levick and Sanderson1973; Nobles et al., Reference Nobles, Zhang, Muller, Betz and Mccall2012; Baden et al., Reference Baden, Berens, Bethge and Euler2013). However, the majority of WT ON (48/51) and OFF (30/35) RGCs in our sample, classified based on RF center stimulation (Nobles et al., Reference Nobles, Zhang, Muller, Betz and Mccall2012), had sustained responses (Figs. 3A and 4A). Among the ON and OFF sustained RGCs, we found no correlation between the temporal characteristics of their RF center and surround responses.
Absence of GlyRα2 and/or GlyRα3 input does not completely eliminate RF surround suppression
The majority of Glra2 −/−, Glra3 −/− or GlyR Glra2/3 −/− ON and OFF RGCs had surround suppression and their numbers were similar across all genotypes including WT (Table 1; Chi-square, ON, P = 0.27; OFF, P = 0.57). Similar to WT RGCs, Glra2 −/−, Glra3 −/− and Glra2/3 −/− RGCs, regardless of RF center sign, had a suppressive response at least one annulus ID larger than optimal and the majority showed significant suppressive responses at least two IDs larger than optimal (Glra2 −/−, ON 62%, OFF 59%; Glra3 −/−, ON 66%, OFF 86%; Glra2/3 −/−, ON 55%, OFF 68%). We have previously shown that a compensatory change in expression of either Glra2 −/− or Glra3 −/− in the absence of the other subunit is highly unlikely (Nobles et al., Reference Nobles, Zhang, Muller, Betz and Mccall2012). Therefore, we are confident that the alterations we describe here and below are a direct effect of the absence of subunit expression.
ON RGC RF surround is independent of GlyRα2 and GlyRα3 modulation
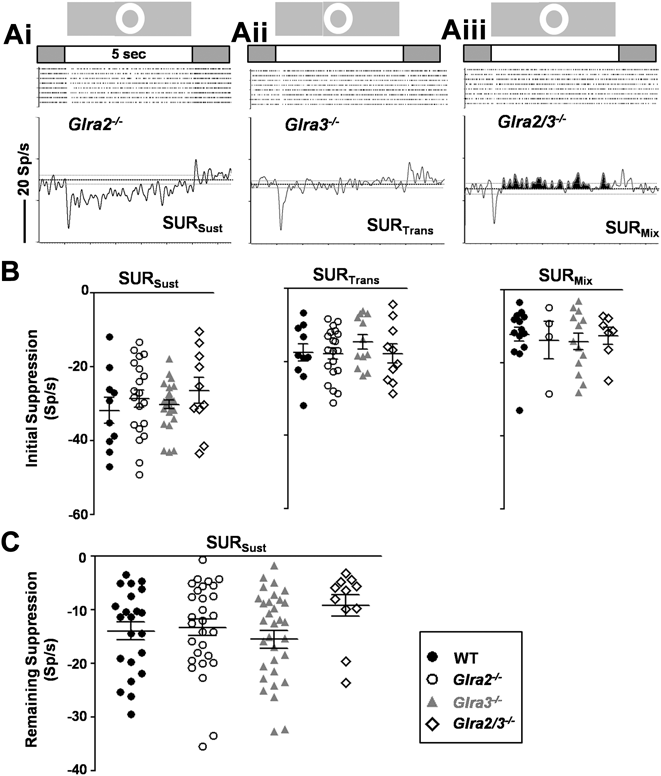
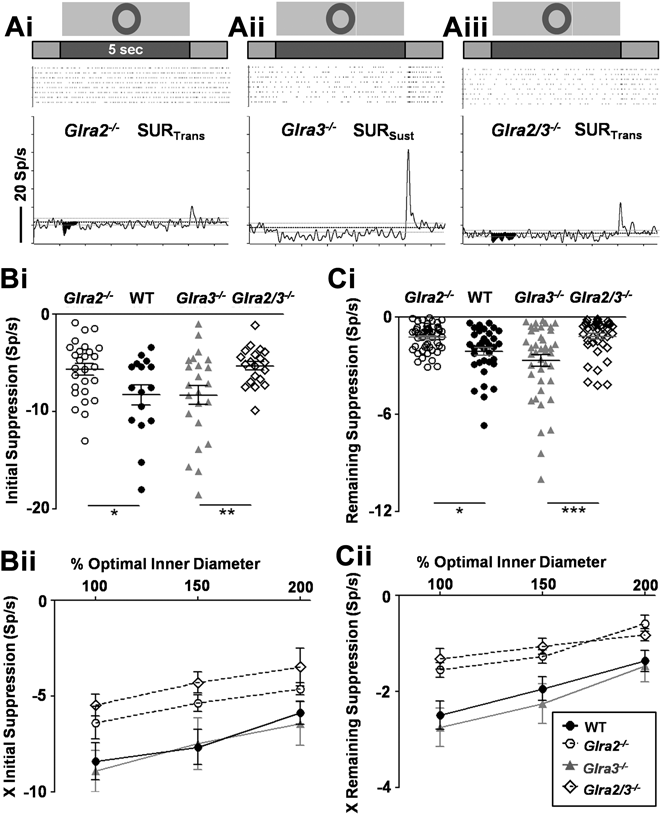
The initial surround suppression was similar in ON RGCs across genotype, including WT, and regardless of the profile of their remaining surround suppression (Fig. 5A and 5B). The three surround suppression profiles, described for WT ON RGCs above, were equally prevalent in Glra2 −/−, Glra3 −/− and Glra2/3 −/− ON RGCs (Chi-square; P = 0.07). Further, the spiking activity levels during the remaining surround suppression also were similar across genotype (Fig. 5C). The similarities at the optimal annulus extended throughout the surround (data not shown). Taken together, the data indicate that neither GlyRα2 nor GlyRα3 modulate inputs contributing to WT ON RGC RF surrounds.
RF surround suppression of WT and GlyR KO ON RGCs are similar. (Ai–Aiii) Representative average PSTHs for Glra2 −/−, Glra3 −/− and Glra2/3 −/− ON RGCs evoked by an optimal annulus (same intensity and timing as Fig. 3). (B) Initial spiking suppression is similar across genotype regardless of the surround suppression profile. (C) In SURSust RGCs, the reduction in the remaining suppression also is similar across genotype. NOTE. RGCs whose initial suppression is 0 Sp/s are not included in B. (See methods for details.) Conventions as in Figs. 2 and 3.
OFF RGC RF surround is modulated only by GlyRα2
The initial and remaining surround suppression evoked by optimal and annuli with larger IDs were similar in Glra3 −/− and WT OFF RGCs (Fig. 6A–6C). This similarity also extended to the duration of suppression (2.2 ± 0.3 s vs. 2.0 ± 0.3 s).
RF surround suppression of Glra2 −/− OFF RGCs differs from WT. (Ai–Aiii) Representative average PSTHs for Glra2 −/−, Glra3 −/− and Glra2/3 −/− OFF RGCs evoked by an optimal annulus (same intensity and timing as Fig. 4). (B) Initial spiking suppression is significantly lower in Glra2 −/− compared to WT OFF RGCs, as well as in Glra2/3 −/−versus Glra3 −/− OFF RGCs to the optimal annulus (Bi) and to annuli with larger IDs (Bii). (C) The reduction in the remaining suppression also is significantly lower in Glra2 −/− compared to WT OFF RGCs as well as in Glra2/3 −/−versus Glra3 −/− OFF RGCs to the optimal annulus (Ci) and to annuli with larger IDs (Cii). Conventions as in Fig. 2 and 3.
All aspects of Glra2 −/− OFF RGC RF surround suppression differed from WT. There were fewer OFF SURSust RGCs in Glra2 −/− compared to WT (Table 3; Chi-square, P = 0.01). Glra2 −/− OFF RGCs had significantly smaller initial, as well as remaining surround suppression compared to WT at optimal (Fig. 6A, 6Bi, and 6Ci; initial, P = 0.02; remaining, P = 0.005) and to annuli with larger IDs (Fig. 6Bii and 6Cii; Two-way ANOVA; initial, P < 0.0001; remaining, P < 0.0001). Consistent with this result, the duration of response suppression was shorter in Glra2 −/− compared to WT OFF RGCs (1.5 ± 0.2 s vs. 2.0 ± 0.3 s; P = 0.03).
Glra2/3 −/− and Glra3 −/− OFF RGCs significantly differed on all of these measures of response suppression both at the optimal annulus as well as to annuli with larger IDs (Fig. 6; Two-way ANOVA, initial, P < 0.0001; remaining, P < 0.0001). Further there were fewer Glra2/3 −/− OFF SURSust RGCs compared to Glra3 −/− (Chi-square, P = 0.01) and as expected, the duration of Glra2/3 −/− OFF RGC surround suppression was shorter (1.0 ± 0.2 s; P = 0.0004). These groups differ in the presence/absence of GlyRα2 expression. These differences, as well as the similarities between Glra2/3 −/− and Glra2 −/− OFF RGCs, strengthen our conclusion that only Glra2 inhibition modulates WT OFF RGC RF surrounds.
OFF RGCs poststimulus excitation is modulated by GlyRα2
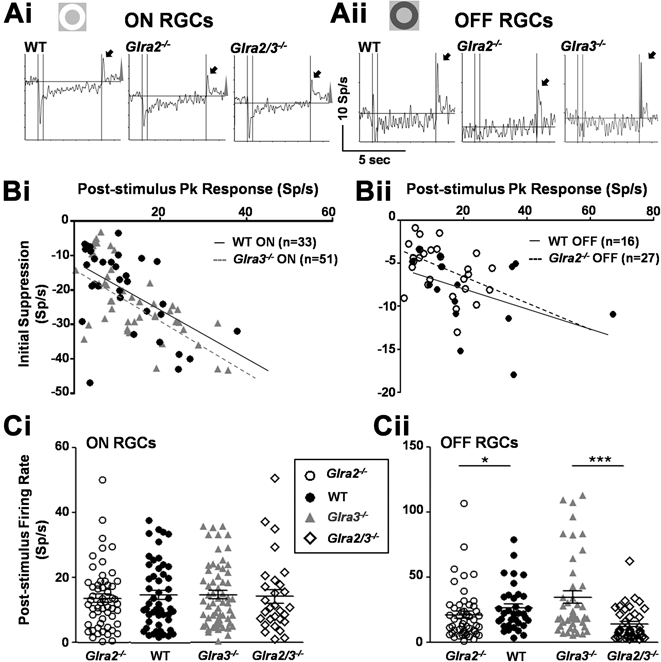
The offset of the annular stimulus evokes a poststimulus excitatory response in WT, Glra2 −/−, Glra3 −/− and Glra2/3 −/− ON (Fig. 7Ai) and OFF (Fig. 7Aii) RGCs. This occurs across RGCs, regardless of the profile of their entire surround suppression. In WT RGCs, initial surround suppression is negatively correlated with the amplitude of poststimulus excitation (Fig. 7B; ON, r = −0.54, P = 0.001; OFF, r = −0.56, P = 0.03), but not with the remaining surround suppression. Poststimulus excitation was similar in Glra3 −/− and WT ON and OFF RGCs (Fig. 7Ci and 7Cii).
The poststimulus excitation of GlyR KO ON and OFF RGCs is negatively correlated within annulus-evoked suppression. Representative average PSTHs and raster plots for Glra2 −/−, Glra3 −/− and Glra2/3 −/− ON (Ai) and OFF (Aii) RGCs evoked by the offset of an optimal annulus. Poststimulus excitation is indicated by black arrows. Regardless of genotype or RGC RF center response there is a significant, negative correlation between the initial response suppression at annulus onset and poststimulus excitation at annulus offset. This is shown in representative plots for WT and Glra3 −/− ON (Bi), WT and Glra2 −/− OFF (Bii) RGCs. Scatter plots illustrate the distribution of poststimulus peak excitation across genotype for ON (Ci) and OFF (Cii) RGCs. Poststimulus excitation in ON RGCs is similar across genotype (WT, n = 51; Glra2 −/−, n = 56; Glra3 −/−, n = 62; Glra2/3 −/−, n = 28). In contrast, poststimulus excitation is significantly smaller in Glra2 −/− (n = 51) compared WT (n = 35; P = 0.04) and Glra3 −/− (n = 43) OFF RGCs. Glra2/3 −/− OFF RGCs (n = 40) are significantly smaller than Glra3 −/− (n = 43; P < 0.001). Conventions as in Figs. 2 and 3.
Consistent with a role for GlyRα2 in shaping surround suppression of OFF RGCs, poststimulus excitation amplitudes were significantly lower in Glra2 −/− compared to WT OFF RGCs (Fig. 7Cii; 21.2 ± 2.8 Sp/s vs. 26.6 ± 3.0 Sp/s, P = 0.04). Further, Glra2/3 −/− OFF RGCs had lower poststimulus excitation compared to Glra3 −/− OFF RGCs (13.9 ± 2.0 Sp/s vs. 34.8 ± 4.8 Sp/s, P < 0.001). Regardless of genotype, initial surround suppression remained negatively correlated with poststimulus excitation (Fig. 7Bii; Glra2 −/−, Glra3 −/−, Glra2/3 −/−; r = −0.4, −0.48, −0.31; P = 0.04, 0.001, 0.049). These data present a consistent picture that only OFF RGC surrounds are modulated by glycinergic signaling, only Glra2 −/− inputs are involved and the mechanisms governing the initial surround suppression and poststimulus excitation are related.
Discussion
Characteristics of WT mouse On and OFF RGC RF surrounds
All WT ON and OFF RGCs, recorded in vivo from the mouse optic nerve, show RF surround suppression. When SA levels are equated, most WT RGCs show an annulus-evoked null point, where the stimulus produces neither excitation nor suppression. The RF center responses of most (98%) of the RGCs in this study have been reported previously (Nobles et al., Reference Nobles, Zhang, Muller, Betz and Mccall2012). In that sample, we showed both the RF center diameters and peak amplitudes of WT ON and OFF RGCs were similar (cf., Nobles et al., Reference Nobles, Zhang, Muller, Betz and Mccall2012; Table 1 and Figs. 6Bi and 8Bi). The RF, when modeled as a difference of Gaussians (Rodieck & Stone, Reference Rodieck and Stone1965), depends on the spatial extent and sensitivity of the RF center and its coextensive surround. The significantly larger balanced ID (on the retina) of ON compared to OFF RGCs is not a result of a difference in their RF center diameters or peak response amplitudes, which are similar (Nobles et al., Reference Nobles, Zhang, Muller, Betz and Mccall2012). This difference most likely reflects a differential distribution of suppression in WT OFF RGC RF surrounds. Further, our results argue that the RF surround suppression of WT OFF RGCs is stronger more centrally compared to ON RGCs. This is consistent with the pathway specific GlyRα2-modulation that enhances the surrounds of WT OFF, but not ON RGCs.
Schematic diagram of a circuit for GlyRα2-mediated modulation of WT OFF RGC RF surround. (Upper left) A schematic diagram illustrates the stimulus, a dark annulus (3 cd/m2) on a light-adapted background (20 cd/m2). Each numbered box represents the membrane potential evoked by the onset/offset of the annulus. WT responses are shown in black traces and Glra2 −/− responses are shown in gray. (N.B., transient responses are illustrated for simplicity and do not accurately depict the temporal response characteristics). In this crossover-feedforward inhibitory circuit, GlyRα2 (blue rectangle) is expressed by a monostratified GABAergic AC (blue) and receives input from a glycinergic AC (red). At stimulus onset, WT ON BCs (light green) hyperpolarize (box 1) and their excitatory input to the narrow-field bistratified, glycinergic AC (red) is reduced (box 2i). This reduces/eliminates the glycinergic input to the GABAergic AC (box 2i). To the same stimulus, OFF BCs (black) depolarize and their excitatory output depolarizes the GABAergic AC (box 4). The On-to-Off glycinergic disinhibition combines with Off direct inhibition at the GABAergic AC and enhances its activity. The GABAergic output produces surround suppression in the OFF BC or OFF RGC (boxes 3i and 5i, respectively). At annulus offset, ON BCs depolarize and drive the glycinergic AC to inhibit the GABAergic AC (box 2i). To the same stimulus, OFF BCs hyperpolarize and this reduces their excitatory drive to the GABAergic AC (box 4). The glycinergic crossover inhibition combines with the termination of excitation within the GABAergic AC, decreases GABA input to the OFF BC or RGC (boxes 4 and 5i) and this produces poststimulus excitation. The synapse and response between the ON BC and the glycinergic AC are unaffected in the absence of GlyRα2. In contrast, the absence of GlyRα2 expression eliminates crossover input (box 2ii). This leaves only input from the OFF BC to the GABAergic AC, which results in a significant reduction in response suppression at stimulus onset and poststimulus excitation at stimulus offset compared to WT (boxes 3 and 5).
While the initial surround suppression of all WT ON and OFF RGC shows a transient peak, the nature of the remaining surround suppression differs. This suggests that their surround inputs arise from different inner retinal sustained and transient channels. This is a novel idea, although similar channels have been used to divide the RF center response of RGCs in a number of species (cat, Cleland et al., Reference Cleland, Dubin and Levick1971, Reference Cleland, Levick and Sanderson1973; Ikeda & Wright, Reference Ikeda and Wright1972; Kuffler, Reference Kuffler1953; ground squirrel, Michael, Reference Michael1968; mudpuppy, Werblin & Dowling, Reference Werblin and Dowling1969; rabbit, Caldwell & Daw, Reference Caldwell and Daw1978b; mouse, Pang et al., Reference Pang, Gao and Wu2003). The most surprising surround response occurs in WT ON RGCs, where the initial suppression is followed by excitation in the continued presence of the annulus. This suggests a temporal mismatch between a transient surround inhibition and a maintained center excitation in these RGCs. Alternatively, a crossover pathway could exist where ON pathway input disinhibits the OFF pathway producing net excitation.
Glycinergic inhibition within IPL modulates surround suppression of OFF RGCs at photopic light levels
Previous studies across a number of species indicate that within the inner retina GABAAR-mediated feedforward and GABACR-mediated feedback inhibition shapes surround antagonism of RGCs (Kirby & Enroth-Cugell, Reference Kirby and Enroth-Cugell1976; Daw et al., Reference Daw, Jensen and Brunken1990; Cook & McReynolds, Reference Cook and McReynolds1998; Roska et al., Reference Roska, Nemeth, Orzo and Werblin2000; Flores-Herr et al., Reference Flores-Herr, Protti and Wässle2001; O'Brien et al., Reference O'brien, Richardson and Berson2003; Buldyrev & Taylor, Reference Buldyrev and Taylor2013). Although there is evidence in the published literature (Kirby, Reference Kirby1979; Stone & Pinto, Reference Stone and Pinto1992), the role of glycinergic subunit-specific inhibitory inputs evoked by stimulation of the isolated RF surround has not been directly observed. Our data show a selective role for only GlyRα2 modulation of surround suppression of OFF RGCs and neither GlyRα2 nor GlyRα3 contribute to surround suppression in ON RGCs. These data along with our previous work (Nobles et al., Reference Nobles, Zhang, Muller, Betz and Mccall2012) indicate subunit specific contributions of glycinergic modulation differ between the On and Off retinal pathways.
In vivo RGC morphology and function cannot be correlated. However, it is valuable as a screening tool to assess several functional RGC types in a preparation that is close to normal physiological conditions. Because we record in the optic nerve with tungsten electrodes similar to those used to in studies with cat (e.g., Boycott & Wässle, Reference Boycott and Wässle1974). We assume our electrode bias is similar and RGCs with the largest somas/axons predominate (see Nobles et al., Reference Nobles, Zhang, Muller, Betz and Mccall2012). In the mouse, these should be the A-type RGCs and include sustained (delta) and transient (alpha) OFF RGCs, as well as sustained (alpha) ON RGCs, also consistent with our previous results (Nobles et al., Reference Nobles, Zhang, Muller, Betz and Mccall2012). However, the responses within the ON and OFF RGCs are variable and could mean our sample extends beyond A-type RGCs. By crossing the KOs with mouse reporter lines with identified OFF RGCs, we would be able to address the question of specificity of GlyRα2 inhibition in a more targeted fashion.
The use of global KO mice carries an important caveat. The changes observed can result not only from the absence of protein expression, but also from potential compensation by related proteins. To interpret the changes in RF center responses in Glra2 −/− and Glra3 −/− RGCs, we showed that compensatory upregulation of either subunit is highly unlikely (Nobles et al., Reference Nobles, Zhang, Muller, Betz and Mccall2012). In the future, when cell type specific promoters for amacrine and ganglion cells are available, we will be able to directly differentiate the subunit selective roles of GlyRα subunit in direct and pathway-mediated inhibition.
A crossover, feedforward GlyRα2-mediated circuit enhances OFF RGC surround inhibition and poststimulus excitation
In the absence of GlyRα2 subunit expression, OFF RGCs have reduced RF surrounds. This is not attributable to changes in SA or a “floor effect” in spiking suppression because our finding is based on only comparisons of WT and Glra2 −/− OFF RGCs whose response suppression remained above 0 Sp/s. We propose modulation of the RF surround is not a direct GlyRα2 input to OFF RGCs for the following reasons. OFF BCs are modulated only by GlyRα1 (Ivanova et al., Reference Ivanova, Muller and Wässle2006). GlyRα2 is expressed on ACs and mediates AC-to-AC inhibition (Weiss et al., Reference Weiss, O'sullivan, Heinze, Chen, Betz and Wässle2008; Majumdar et al., Reference Majumdar, Weiss and Wässle2009). Surround antagonism of OFF RGCs is generated by direct GABAergic inhibition via inputs from wide-field ACs (Flores-Herr et al., Reference Flores-Herr, Protti and Wässle2001; O'Brien et al., Reference O'brien, Richardson and Berson2003) and identified OFF RGC types that have been studied express GlyRα1 and do not express GlyRα2 (Majumdar et al., Reference Majumdar, Heinze, Haverkamp, Ivanova and Wässle2007; Zhang et al., Reference Zhang, Rompani, Roska and Mccall2014). Fig. 8 illustrates a proposed crossover inhibitory circuit that generates the RF suppressive surround of OFF RGCs, their poststimulus excitation and explains the changes we observe in the Glra2 −/− OFF RGCs. Direct inhibition to the OFF RGC occurs via input from a monostratified OFF GABAergic AC (blue) either onto the OFF RGC or its presynaptic OFF BC (arrows). The GABAergic AC must express GlyRα2, and be modulated by a bistratified glycinergic AC driven by the On pathway (crossover inhibition). The identity of this bi-stratified GABergic AC is unknown but likely candidates are the AII or the A8 AC, both suggested to mediate On-to-Off pathway crossover inhibition within the IPL (Xin & Bloomfield, Reference Xin and Bloomfield1999; Münch et al., Reference Münch, Da Silveira, Siegert, Viney, Awatramani and Roska2009; Pang et al., Reference Pang, Gao and Wu2007; Anderson et al., Reference Anderson, Jones, Watt, Shaw, Yang, Demill, Lauritzen, Lin, Rapp, Mastronarde, Koshevoy, Grimm, Tasdizen, Whitaker and Marc2011; Demb & Singer, Reference Demb and Singer2012; Lee et al., Reference Lee, Meyer, Schubert, Huser, Dedek and Haverkamp2015).
Functionally, a luminance decrement hyperpolarizes ON cone BCs (Fig. 8, box 1) and reduces/eliminates its drive to the glycinergic AC. The reduction in glycinergic control of the GABAergic AC (Fig. 8, box 2i) results in an increase in its input onto the OFF RGC and/or its presynaptic OFF BC, enhancing surround suppression (Fig. 8, boxes 3i and 5i). Stimulus offset (luminance increment) depolarizes the same ON cone BCs (Fig. 8, box 1) increasing the drive to the glycinergic AC and its inhibition onto the GABAergic AC (Fig. 8, box 2i). This results in a decreased output of the GABAergic AC, which also is referred to as disinhibition. In the end, the excitatory response to stimulus offset in the OFF RGC is facilitated (Fig. 8, boxes 3i and 5i). In the absence of GlyRα2 expression, this glycinergic crossover “push-pull” modulation (Murphy & Rieke, Reference Murphy and Rieke2006; Hsueh et al., Reference Hsueh, Molnar and Werblin2008; Manookin et al., Reference Manookin, Beaudoin, Ernst, Flagel and Demb2008; Molnar et al., Reference Molnar, Hsueh, Roska and Werblin2009; Zhang et al., Reference Zhang, Rompani, Roska and Mccall2014) of the GABAergic AC is eliminated (Fig. 8, boxes 2ii and 3ii) and with it the enhancement of surround suppression at luminance decrement as well as poststimulus excitation at luminance increment is eliminated (Fig. 8, boxes 3ii and 5ii).
There are other mechanisms that could decrease poststimulus excitation in Glra2 −/− OFF RGCs. For example, if GlyRα2 modulates a direct tonic inhibition onto OFF RGCs, its absence should result in OFF RGCs with more hyperpolarized resting membrane potentials and annulus offset could result in a reduced poststimulus excitation. The GlyRα2-modulation of a direct tonic inhibition onto OFF RGCs is consistent with our previous observation (Nobles et al., Reference Nobles, Zhang, Muller, Betz and Mccall2012) that spontaneous spiking rate is lower in Glra2 −/− compared to WT OFF RGCs. Alternatively, low-voltage gated (LVA) Ca2+ channels have been hypothesized to generate poststimulus excitation after hyperpolarization in OFF RGCs (Margolis et al., Reference Margolis, Gartland, Euler and Detwiler2010). In this scenario, the weaker surround suppression caused by the absence of GlyRα2-modulation in OFF RGCs could de-inactivate low-voltage-activated Ca2+ channels, lower Ca2+ influx and reduce the poststimulus spiking activity.
GlyRα2-mediated inhibition in WT OFF RGCs modulates RF center and surround via different circuits
Center-surround antagonism is the basic RF design of most RGCs and their interaction is essential for visual processing of contrast, spatial acuity, and temporal selectivity (Kuffler, Reference Kuffler1953; Rodieck & Stone, Reference Rodieck and Stone1965; Enroth-Cugell & Robson, Reference Enroth-Cugell and Robson1966; Cook & McReynolds, Reference Cook and McReynolds1998; Greenberg et al., Reference Greenberg, Pham and Werblin2011). The absence of GlyRα2 reduces both the RF excitatory center and suppressive surround responses of OFF RGCs. This suggests GlyRα2 inhibition modulates the RF where center and surround are spatially contiguous, as well as where the RF surround extends outside of the RF center. While this could represent a single GlyRα2-mediated mechanism, there is evidence that supports the idea of different GlyRα2-mediated circuits that separately modulate the RF center and surround. For example, A-type OFF RGCs use crossover inhibition from the On pathway as the primary input to the RF center (Murphy & Rieke, Reference Murphy and Rieke2006; Manookin et al., Reference Manookin, Beaudoin, Ernst, Flagel and Demb2008; van Wyk et al., Reference van Wyk, Wässle and Taylor2009; Zhang et al., Reference Zhang, Rompani, Roska and Mccall2014) and use feedforward inhibition from the Off pathway as the primary input to the RF surround (Cook & McReynolds, Reference Cook and McReynolds1998; Roska et al., Reference Roska, Nemeth, Orzo and Werblin2000; Flores-Herr et al., Reference Flores-Herr, Protti and Wässle2001). Moreover, spatially the RF center and surround require ACs with different dendritic field sizes to perform this modulation, e.g., narrow field ACs modulate the RF center and wide-field ACs modulate the RF surround.
In summary, we have quantitatively described surround suppression in WT mouse RGCs and show glycinergic inhibitory mechanisms that modulate surround suppression differ between the ON and OFF pathways. Namely, within the OFF pathway, GlyRα2-mediated, but not GlyRα3-mediated inputs modulate the surround suppression. Finally, it is likely that GlyRα2 inputs participate in a crossover pathway to modulate both annulus evoked surround suppression and poststimulus excitation.
Acknowledgments
We thank Drs. C. Cepko and H. Betz and for the Glra2 and Glra3 knockout mice, respectively. Dr. W. R. Taylor for reading and commenting on the manuscript.
Funding sources: NIH RO1EY140701 (M.A.Mc); Sigma Xi OGMB120979 (C.Z.) and an unrestricted grant from RPB (Dept of Ophthalmology & Visual Sciences).