Despite persistent efforts by individuals living with obesity, scientists and clinicians, the prevalence of paediatric overweight, obesity and their related complications keeps progressing, reaching alarming thresholds(Reference Zhang, Liu and Ni1). Surgical and pharmacological strategies have been adapted and are available to adolescents with obesity and severe obesity. Although the latter drastically enhances the beneficial effects of multidisciplinary behavioural interventions(Reference Weghuber, Boberg and Hesse2), they might, as shown in adults(Reference Beauregard, McInnis and Goldfield3), also lead to the activation of compensatory mechanisms in response to the energy deficit they create, limiting their efficacy and potentially favouring weight regain(Reference Torbahn, Lischka and Brown4). As such, the main hurdle to successful long-term achievement of healthier weights could very well be the activation of adaptive energetic and appetitive mechanisms that strive to re-establish patients’ energy stores and body weight (BW)(Reference Doucet, McInis and Mahmoodianfard5), considerably undermining the efficacy of interventions and likely facilitating weight regain over time.
When it comes to energy expenditure (EE), the so-called adaptive thermogenesis (AT) has been proposed in adults as one of these compensatory mechanisms(Reference Dulloo, Jacquet and Montani6). Indeed, while all compartments of total energy expenditure are reduced in response to weight loss (WL), mostly as a result of reduced body mass, a greater-than-expected reduction in some of the components, namely, resting and physical activity energy expenditure(Reference Rosenbaum, Hirsch and Gallagher7–Reference Doucet, Imbeault and St-Pierre9), has been repeatedly reported. In other words, AT corresponds to the reduction in total energy expenditure (or any of its resting or non-resting components) that is greater than that predicted by the losses of body mass, that is, fat mass (FM) and fat-free mass (FFM)(Reference Lopez Torres, Aukan and Gower10). According to Muller et al., AT is the mass-independent decrease in energy expenditure in response to caloric restriction and weight loss(Reference Müller, Heymsfield and Bosy-Westphal11). Hormonal changes such as leptin and thyroid hormone concentrations reduction(Reference Rosenbaum, Goldsmith and Haddad8,Reference Major, Doucet and Trayhurn12) , variations in insulin and catecholamines concentrations and/or the decreased activity of the sympathetic nervous system after weight loss(Reference Müller, Enderle and Pourhassan13) have been suggested to contribute to this mass-independent decline in EE(Reference Müller, Enderle and Bosy-Westphal14).
While it still remains a topic of debate in adults(Reference Leibel, Rosenbaum and Hirsch15–Reference Nunes, Casanova and Francisco19), AT has nonetheless been reported to contribute to the resistance to weight loss, with some studies showing a larger AT to be responsible for a lower total BW and FM loss in response to caloric restriction(Reference Martins, Roekenes and Gower20). In turn, it seems to lead to extended dietary intervention time in order to reach the patients’ targeted weight reduction objectives(Reference Martins, Gower and Hunter21). In their recent systematic review conducted in adults, Nunes and colleagues observed the presence of AT in twenty-seven out of the thirty-three studies included, suggesting a greater than predicted reduction in EE in response to weight loss, which was however attenuated or even disappeared after a period of weight stabilisation or neutral energy balance(Reference Nunes, Casanova and Francisco19). In adolescents with obesity, like in adults, mixed results can be found regarding the effect of multidisciplinary weight loss interventions on resting energy expenditure (REE), with most studies showing reduced REE(Reference D’Alleva, Gonnelli and Vaccari22–Reference Thivel, Julian and Miguet28) while some others do not(Reference Alberga, Prud’homme and Sigal29–Reference Thivel, Ennequin and Lambert32). However, to our knowledge, none of the available studies investigated whether AT is also present in adolescents.
We previously conducted a study exploring the metabolic and energetic adaptations to weight variations in adolescents with obesity(Reference Lazzer, Boirie and Poissonnier25,Reference Isacco, Lazzer and Pereira33) . Using this unique dataset, we conducted secondary and exploratory analysis to determine for the first time whether adolescents with severe obesity also experience AT in response to an inpatient multidisciplinary weight loss.
Materials and methods
The present work is a secondary analysis of a broader project conducted between 2004 and 2006, and the full description of the design, inclusion criteria and population has been previously detailed(Reference Lazzer, Boirie and Poissonnier25,Reference Isacco, Lazzer and Pereira33) . Briefly, twenty-six adolescents (14·1 (sd 1·5) years; 14 girls) with severe obesity were recruited and completed a 9-month inpatient multidisciplinary intervention combining physical activity, dietary and psychological programmes (the online Supplementary Figure S1 presents the flowchart of the study). Full anthropometric, body composition, nutritional, energetic and metabolic evaluations were performed at baseline (T0), after 9 months of weight loss intervention (T1) and after a 4-month follow-up (T2). Data at each time point (T0, T1 and T2) for this secondary analysis include (i) anthropometric measurements (BW measured in the fasted state to the nearest 0·1 kg (calibrated manual weighing scale – SECA 709), and body height measured barefoot to the nearest 0·1 cm (wall-mounted stadiometer – SECA) from which BMI was obtained (BW (kg)/height squared (m2)); (ii) body composition (FM (%FM and kg) and FFM (kg) measured by dual energy X-ray absorptiometry (QDR 4500 A scanner, Hologic)) and Fat Mass Index and Fat-Free Mass Index were computed (FM/height and FFM/height², respectively); (iii) REE (assessed in semi-supine position after an overnight fast, for 45 min of steady state using an open-circuit, indirect computerised calorimetry (Deltatrac calorimeter; InstrumentariumOy, Datex Division) with a rigid, transparent, ventilated canopy. Gas analysers were carefully calibrated before each test with a reference gas mixture, and oxygen consumption (VO2) and carbon dioxide production (VCO2), standardised for temperature, barometric pressure and humidity, were measured continuously. The Deltatrac calorimeter offers an accuracy within 3 % for the measured gas exchanges(Reference Wells and Fuller34). The energetic equivalent of the FM and FFM variations was also calculated using the energy equivalents of 9·3 kcal/g for FM and 1·1 kcal/g for FFM (divided by the number of days of the weight loss and weight regain periods)(Reference Hall35). The presence of AT has been calculated by subtracting the measured REE (REEm) from the predictive one (REEp) at T1 and T2 (the calculation of REEp is described in the statistical section).
The physical activity intervention consisted of two 40 min endurance and strength training sessions (preceded and followed by 5–7 min stretching) per week. Intensity of endurance exercises (cycle ergometer, treadmill walking, stepper and stationary rowing) was set at an heart rate corresponding to 55–60 % of the initial VO2max. Strength training was performed on universal gym equipment and set to be individualised and progressive based on baseline evaluations. Physical training intensity was adjusted monthly according to regular physical capacity tests. In addition, subjects performed 2 h of physical education lessons at school and 2 h of aerobic leisure activities at the institution per week. The dietary intervention was composed of individualised dietary restriction and nutritional education sessions. Personalised diets were offered on the basis of the adolescents’ baseline RMR and physical activity level. Energy supply was adjusted to be close to 1·3 times the initial RMR, which corresponded to about 15–20 % less than the estimated daily EE. On top of the caloric restriction, the adolescents followed dietetics lessons including the choice and cooking of foods, and they were instructed to maintain their food habits after the end of the weight reduction period.
All experiments were conducted in full compliance with the Declaration of Helsinki, and written informed consent was obtained from all adolescents and their legal guardians. The study was approved by the University Ethical Committee on Human Research for Medical Sciences (AU # 361). Based on a clinical interview performed at baseline, all the adolescents presented a low to very low physical activity level.
Statistical analysis
Statistical analyses were performed using the Stata software package (version 15, StataCorp, College Station). All statistical tests were carried out for a two-sided type I error at 5 %. Continuous data are expressed according to their statistical distribution as mean and sd. The assumption of normality was analysed using the Shapiro–Wilk test. Changes in BW, BMI, FM, FFM, measured REE (REEm) and predicted REE (predicted REE using equation 1 (REEp1) and predicted REE using equation 2 (REEp2)) were analysed using random-effects models (i.e. linear mixed models), and appropriate post hoc pairwise comparison with Bonferroni correction was applied. Appropriate pairwise comparisons were used to compare the T0–T1 and T1–T2 delta changes of all the explored variables, as well as the adaptive thermogenesis using equation 1 (ATp1) and adaptive thermogenesis using equation 2 (ATp2) at T1 and T2, between boys and girls. Linear mixed models with time and sex effects were also conducted on all the explored outcomes (online Supplementary Tables). The existence of AT for REE was tested using a paired t test comparing measured REE (REEm) and predicted REE (REEp) at T1 and T2.
Multiple linear regressions were used to predict REE derived from baseline data of all the participants. REE was then predicted using the classically used model that includes both FM and FFM (REEp1) (for review(Reference Nunes, Casanova and Francisco19)), and a second model including the participants’ FFM only was also performed (REEp2), as recently suggested by Lopez Torres(Reference Lopez Torres, Aukan and Gower10), such as:
 $$\eqalign{{\rm{REEp}}1{\rm{ }}\left( {{\rm{kcal}}.{{\rm{d}}^{-1}}} \right)\, = & \,1156\cdot609\, + \,({\rm{FFM}}\, \times \,26\cdot71772)\, \\& + \,({\rm{FM}}\, \times \,3\cdot762438)\, \\& -\,({\rm{AGE}}\, \times \,39\cdot645)\,-\,140\cdot3661\, \times \,{\rm{SEX}}}$$
 $$\eqalign{{\rm{REEp}}2{\rm{ }}\left( {{\rm{kcal}}.{{\rm{d}}^{-1}}} \right)\, = & \,1158\cdot664\, + \,({\rm{FFM}}\, \times \,28\cdot24856) \\& -\,({\rm{AGE}}\, \times \,37\cdot52645)\,-\,121\cdot7685\, \\& \times \,{\rm{SEX}}}$$
CV have been calculated for REEm and REEp1 and REEp2 at T0. Appropriate correlations have been performed between AT and the adolescents’ baseline anthropometric characteristics and body composition, as well as with their variations (delta T0–T1, delta T0–T2, delta T1–T2). Similarly, appropriate correlations have been performed between the adolescents measured and predicted REE at baseline. All correlations were performed using a Sidak correction for multiple comparisons.
Results
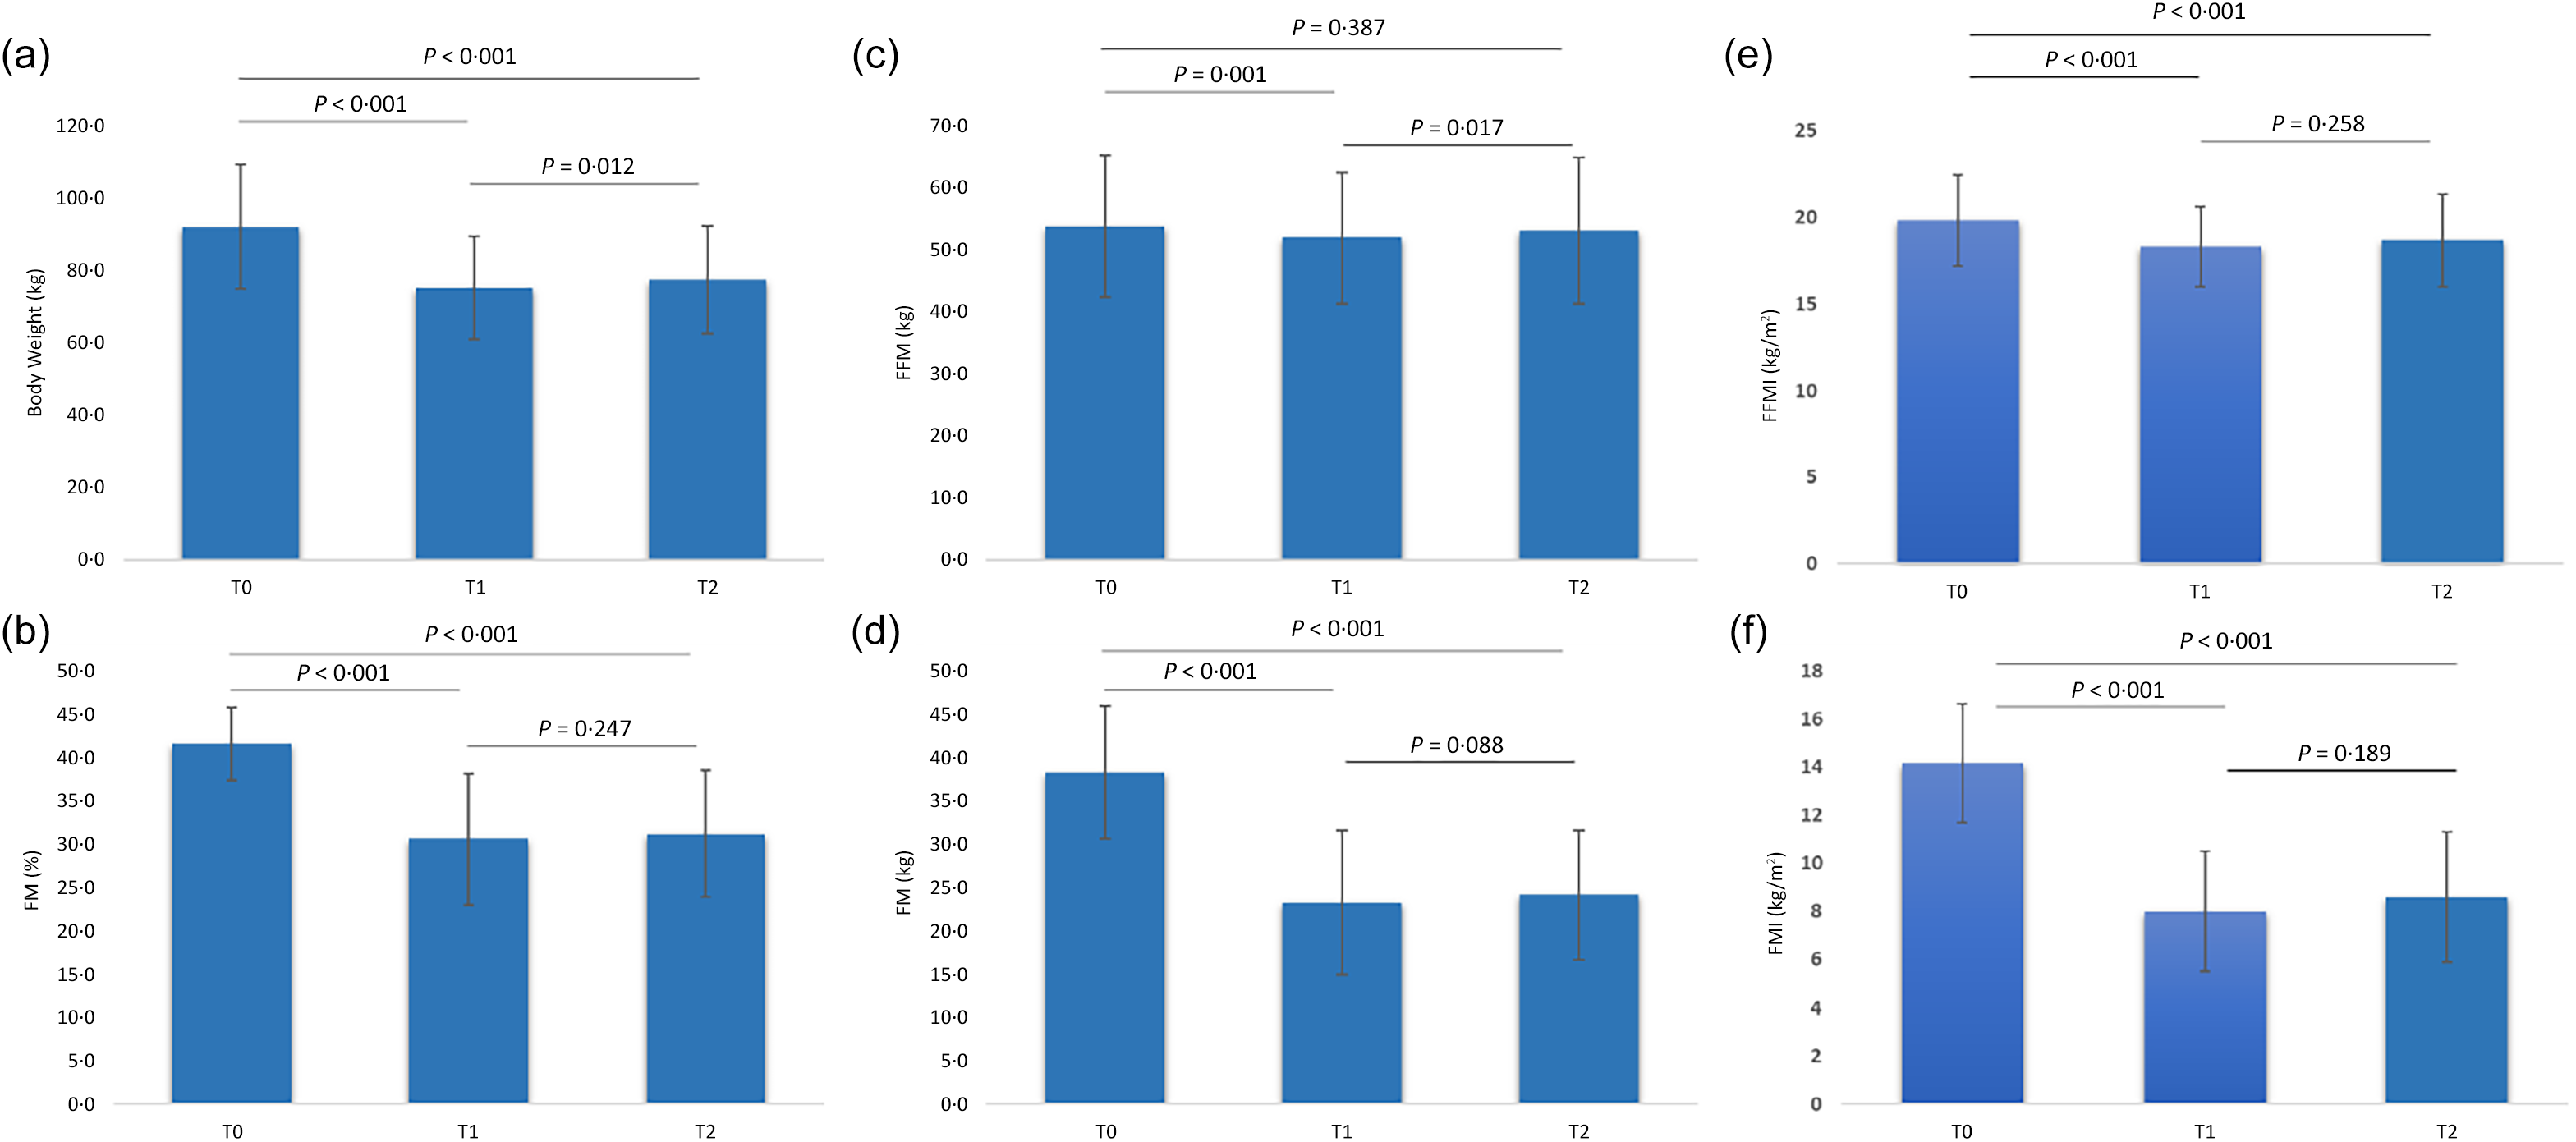
BMI significantly decreased between T0 (33·9 (sd 4·1) kg/m²) and both T1 (26·8 (sd 4·1) kg/m²) and T2 (27·2 (sd 3·6) kg/m²) (P < 0·001), with a significant increase between T2 and T1 (P = 0·042). As illustrated by Fig. 1, BW, FFM and FM (% and kg), Fat Mass Index and Fat-Free Mass Index (kg/m²) all decreased significantly between T0 and T1 (P ≤ 0·001), and all significantly remained lower at T2 compared with T0 between except for FFM (P = 0·387). Except for FM (% and kg), Fat Mass Index and Fat-Free Mass Index (kg/m²) all showed a significant increase at T2 compared with T1. The FM variations between T0 and T1 and T1 and T2 represent, respectively, −554 (sd 210) kcal/d and 156 (sd 272) kcal/d. Similarly, the FFM variations between T0 and T1 and T1 and T2 represent, respectively, −8 (sd 12) kcal/d and 12 (sd 20) kcal/d. The online Supplementary Tables S1, S2 and S3 detail the absolute and delta changes comparisons of the participants’ characteristics during the intervention and after the 4-month follow-up, including gender differences.
Effect of the intervention (from baseline (T0) to the end of the intervention (T1)) and of the 4-month follow-up (T2) on the adolescents’ body weight (a), fat-free mass (c), fat mass percentage (b) absolute fat mass (d), Fat-Free Mass Index (e) and Fat Mass Index (f). FFM, fat-free mass; FM, fat mass; FFMI, Fat-Free Mass Index; FMI, Fat Mass Index; T0, baseline; T1, end of the intervention; T2, 4-month follow-up (previously detailed results(Reference Isacco, Lazzer and Pereira33)).

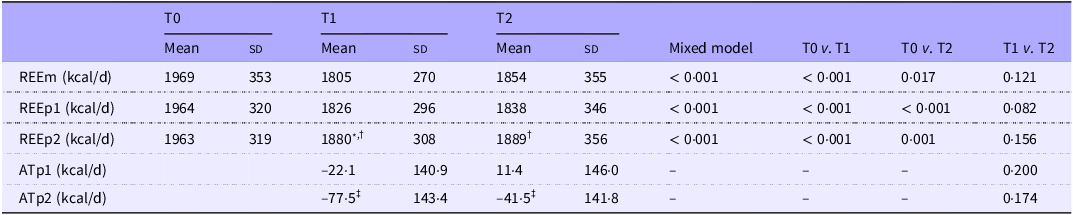
REEm and REEp1 and REEp2 were significantly correlated at baseline (rho = 0·841 (rho² = 0·707) and 0·842 (rho² = 0·709), respectively, P < 0·001). At T0, the CV for REEm was 0·18, while the CV for REEp1 and REEp2 were both 0·16. REEm and REEp significantly decreased between T0 and T1 (P < 0·001) and remained lower at T2 compared with T0 (REEm: P = 0·017; REEp: P < 0·001), with no difference between T1 and T2 (Table 1). REEm and REEp1 were not significantly different at any of the time points, while REEp2 was significantly higher than REEm at T1 (P = 0·012). Not different at T0, REEp2 was significantly higher than REEp1 at T1 and T2 (P < 0·001) (Table 1). These results indicate the presence of AT at T1 and using the REEp2 equation only. Table 1 also details the AT calculation using both equations at T1 and T2 (i.e. difference in energy expended between REEm and REEp1 or REEp2 (kcal/d) at T1 and T2). ATp2 is significantly higher at both T1 and T2 compared with ATp1 (P < 0·001). ATp1 and ATp2 failed to show any difference between boys and girls at both T1 (P = 0·952 and P = 0·696, respectively) and T2 (P = 0·144 and P = 0·256, respectively).
Progression of the REE (measured and predicted) of the participants from baseline to the end of the weight loss intervention and after the 4-month follow-up and AT (ATp1 and ATp2) at T1 and T2

Data are presented as means (sd). T0, baseline; T1, end of the intervention; T2, 4-month follow-up; FFM, fat-free mass; FM, fat mass; REEm, measured resting energy expenditure; REEp1, resting energy expenditure predicted using equation 1; REEp2, resting energy expenditure predicted using equation 2; ATp1, adaptive thermogenesis calculated using the predictive REE based on equation 1; ATp2, adaptive thermogenesis calculated using the predictive REE based on equation 2. *P < 0·05 v. REE; † P < 0·001 v. REEp1; ‡ P < 0·001 v. ATp1.
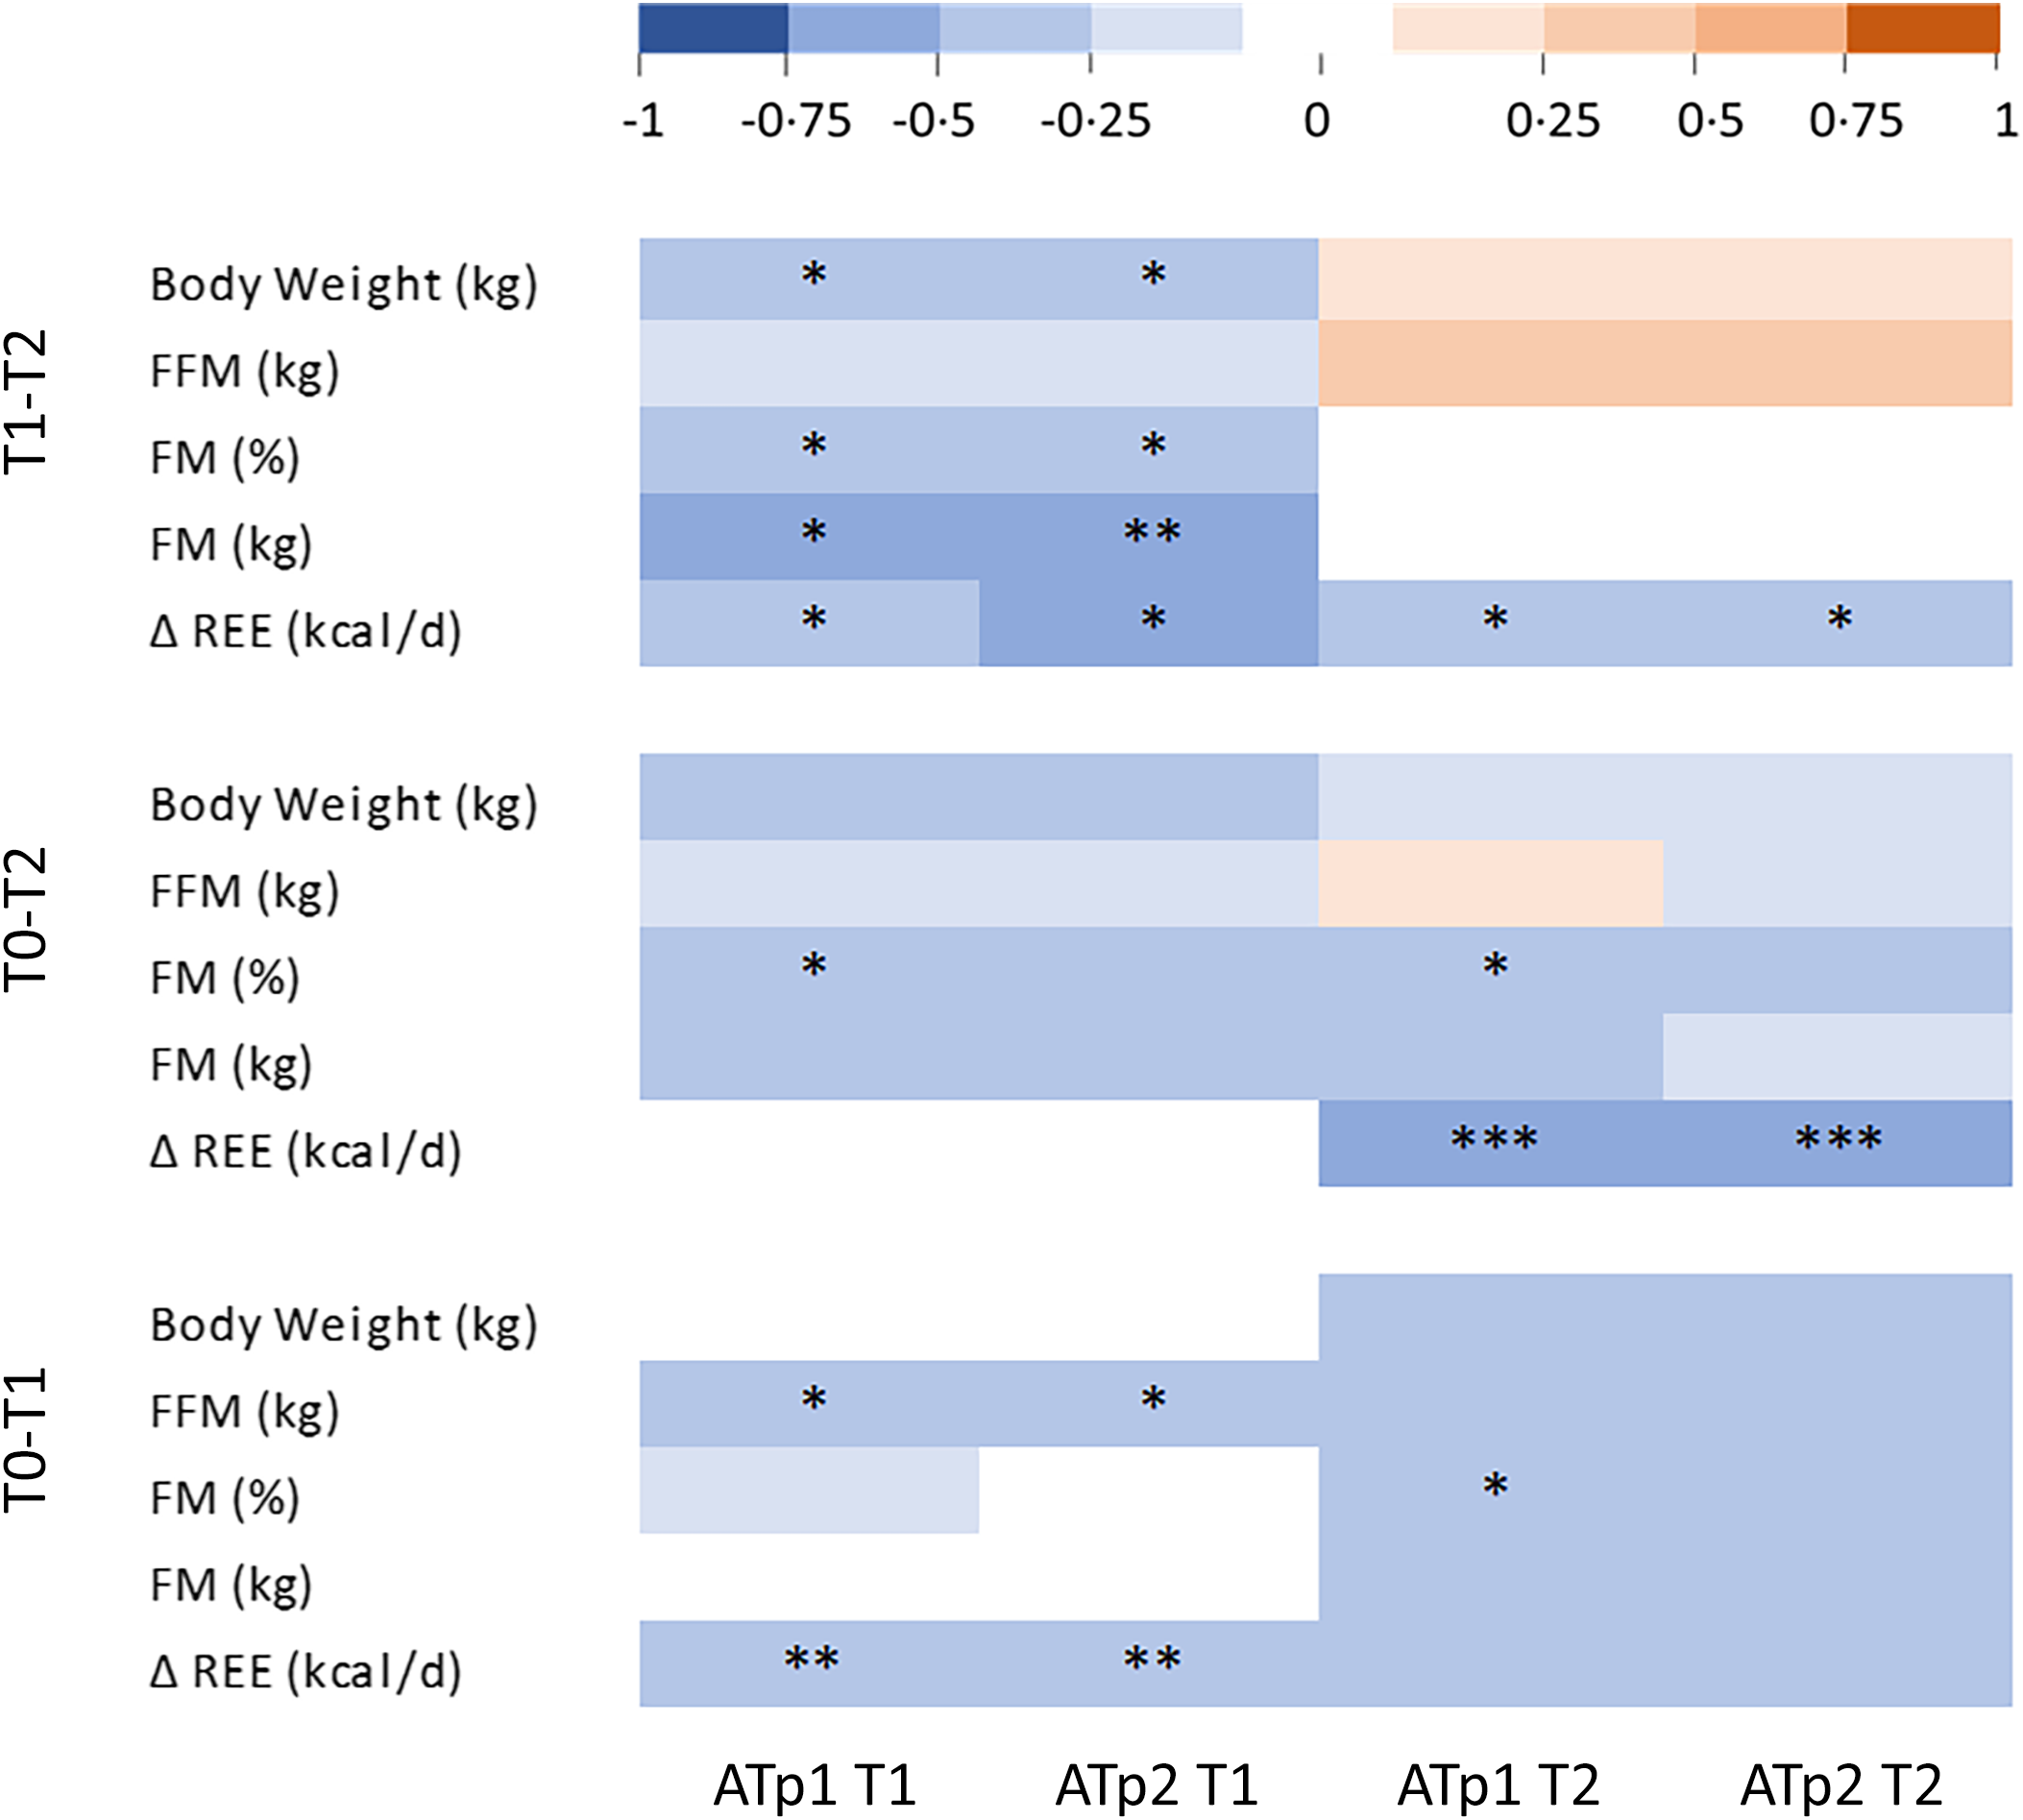
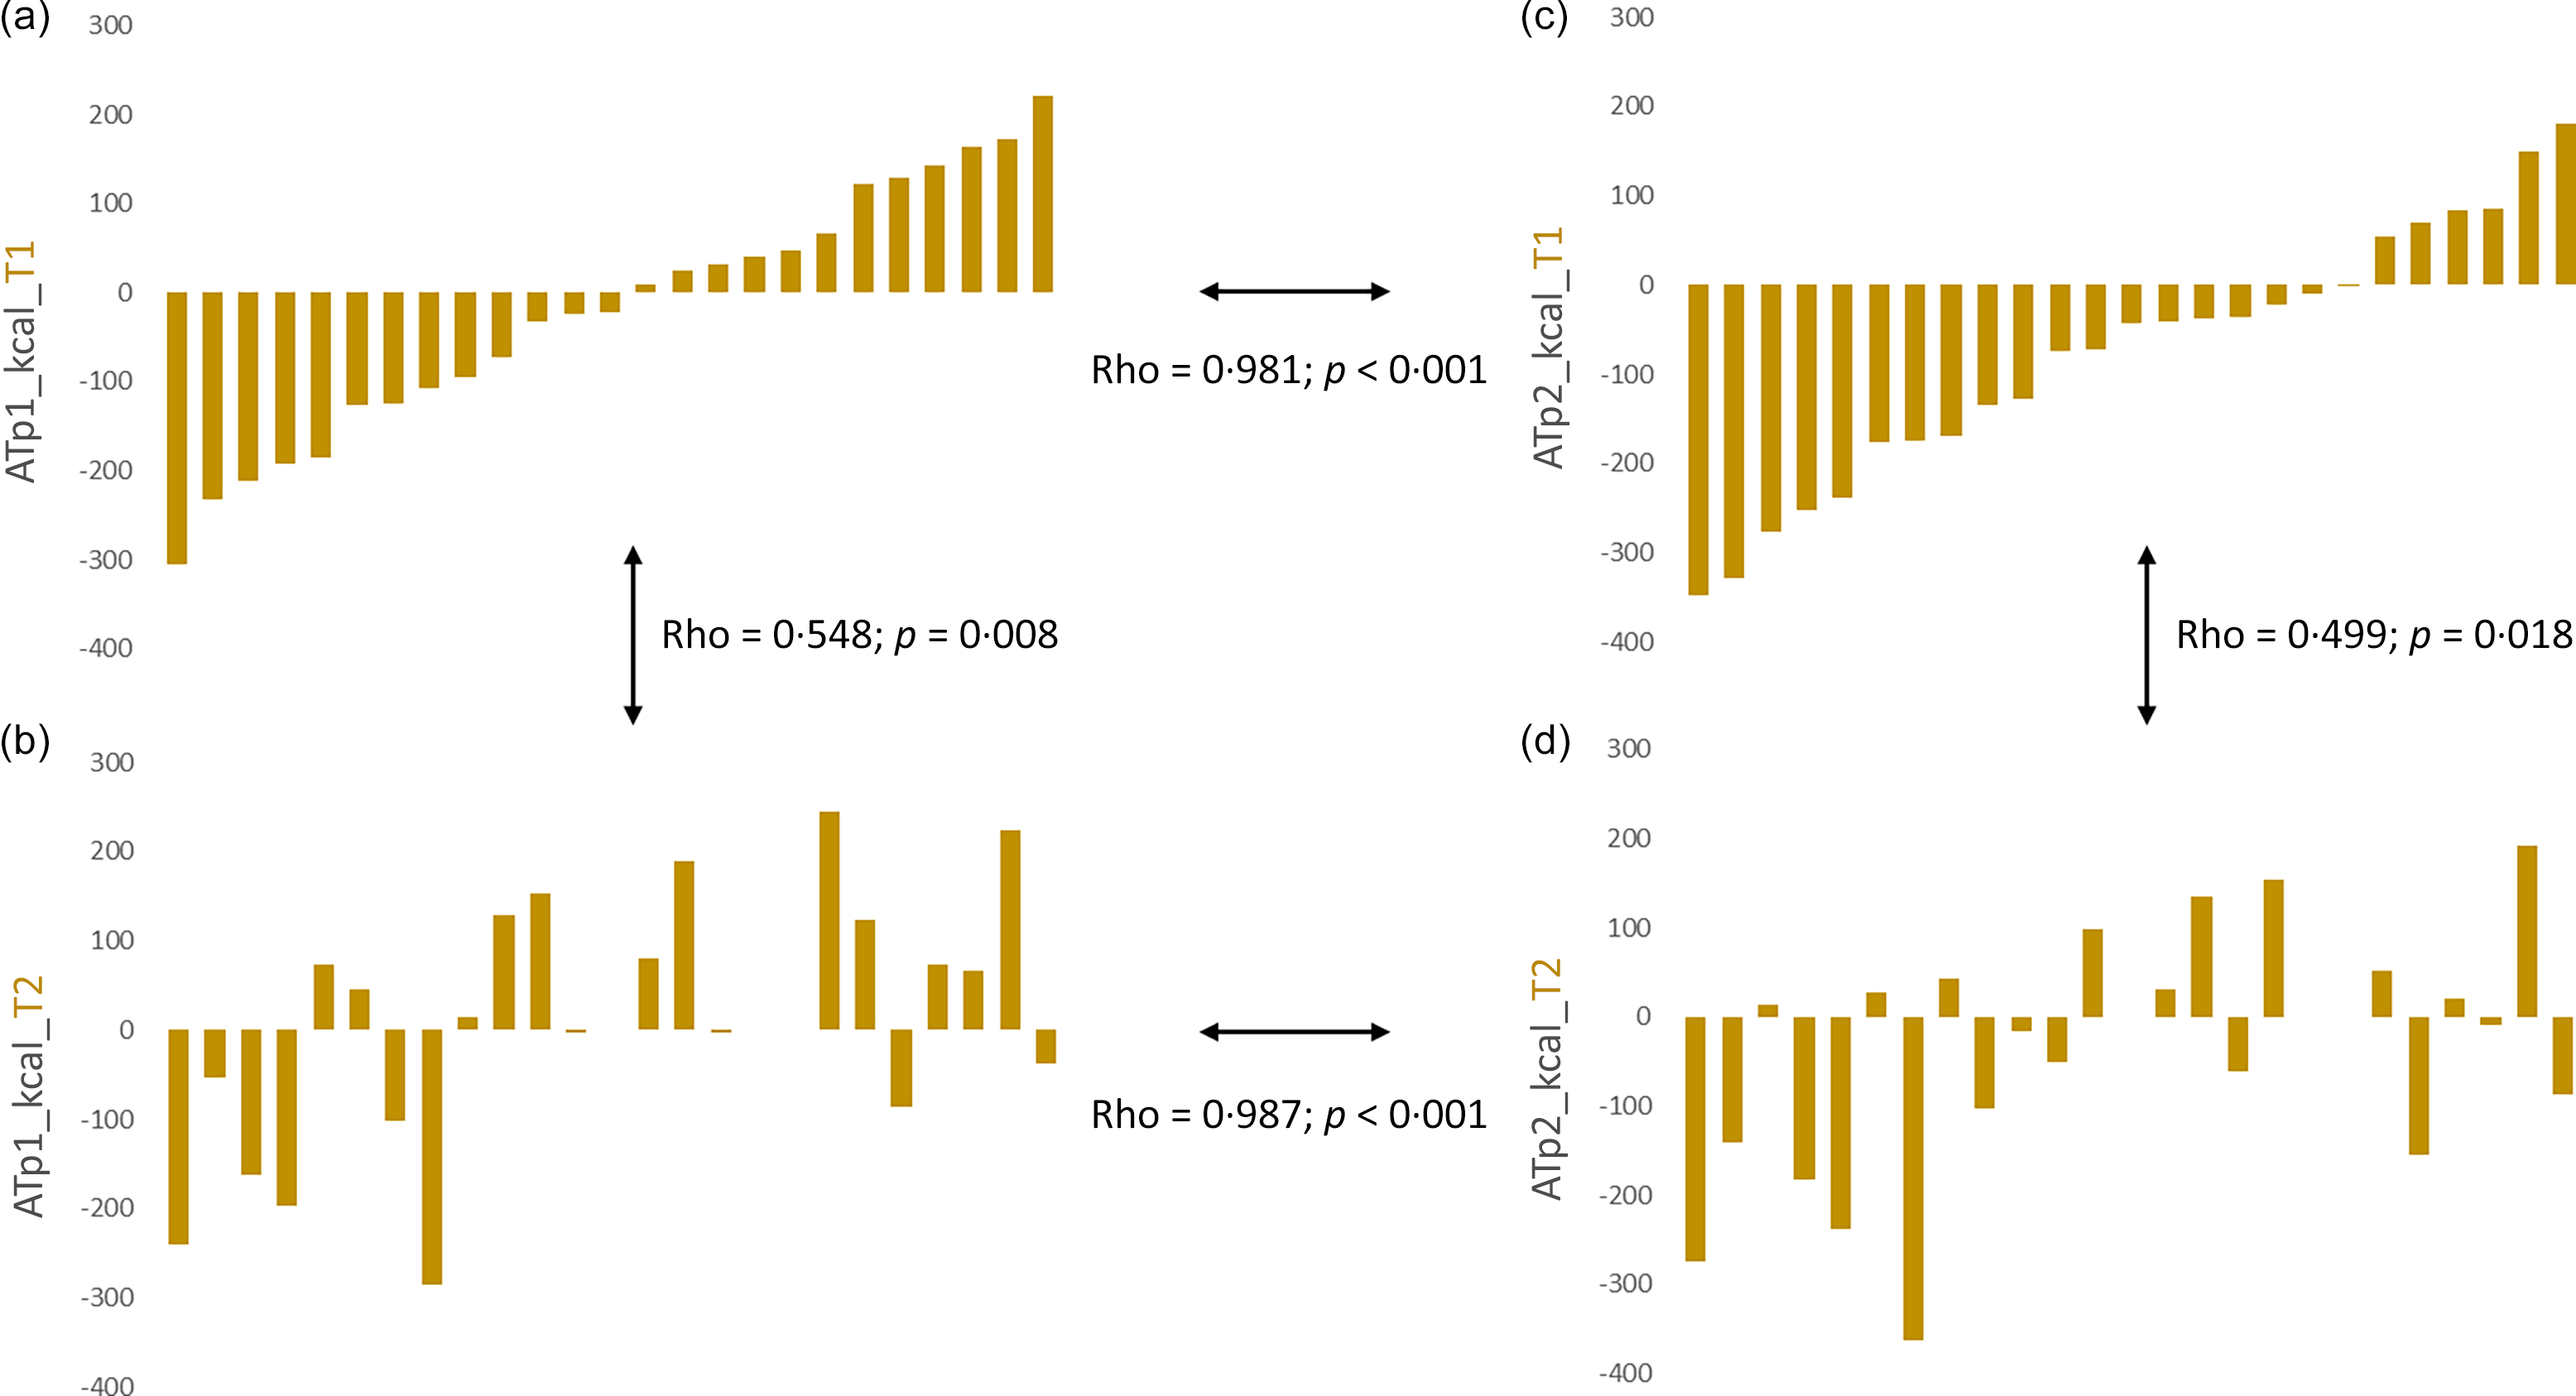
At baseline, only FFM (kg) was moderately and negatively correlated with ATp1T1 (Rho = –0·428; P = 0·033) and ATp2T1 (Rho = –0·485; P = 0·014), with no other significant correlation with the baseline anthropometric and body composition characteristics. As illustrated by Fig. 2, only the variation of FFM between T0 and T1 was negatively correlated with ATp1T1 and ATp1T2. FM (kg and %) and BW, but not FFM, variations between T1 and T2 were negatively correlated with ATp1T1 and ATp2T1. The online Supplementary Table S4 details the Rho coefficients and p values of all the correlations considered in the heatmap (Fig. 2). Figure 3 illustrates that although significant correlations are found between ATp1 and ATp2 at T1 and T2 separately, as well as between ATp1 between T1 and T2 and ATp2 between T1 and T2, their individual evolution remains highly variable.
Heatmap presenting the correlations between AT at T1 and T2 and the anthropometric, body composition and REE variations between each measurement point. FFM, fat-free mass; FM, fat mass; REE, resting energy expenditure; T0, baseline; T1, end of the intervention; T2, 4-month follow-up; ATp1, adaptive thermogenesis calculated using the predictive REE based on equation 1; ATp2, adaptive thermogenesis calculated using the predictive REE based on equation 2; *: P < 0·05; **: P < 0·01; ***: P < 0·001.

Ascending representation of the individual ATp1 and ATp2 at T1 (a) and (c) and the face-to-face corresponding values at T2 (b) and (d). T1, end of the intervention; T2, 4-month follow-up; ATp1, adaptive thermogenesis calculated using the predictive REE based on equation 1; ATp2, adaptive thermogenesis calculated using the predictive REE based on equation 2.

Discussion
Exclusively studied so far in adults, the existence of AT in response to weight loss remained unexplored to date in adolescents with obesity. Taking advantage of its robust design and methodology, the present study provides the first insights into the potential appearance of this AT in response to multidisciplinary weight loss and weight regain in adolescents with obesity. According to our results, there is a significant difference between measured and predicted (based on the equation including FFM only) REE at T1, suggesting the presence of AT, with however a large inter-individual variability.
First, the significant reduction of the measured REE with WL aligns nicely with previously published studies conducted in children and adolescents with obesity(Reference D’Alleva, Gonnelli and Vaccari22,Reference Lazzer, Boirie and Montaurier23,Reference Lazzer, Boirie and Poissonnier25,Reference Shalitin, Ashkenazi-Hoffnung and Yackobovitch-Gavan27,Reference Thivel, Julian and Miguet28) . In addition, the identification of AT is in line with what is observed in adults and the results of a recent systematic review pointing the identification of AT in twenty-nine out of the thirty-three included studies, also pointing a large in-between studies but also inter-individual variability in the range of obtained AT degrees(Reference Nunes, Casanova and Francisco19).
Interestingly, our results fail to show any relationship between the degree of BW loss and AT, which once coincides with evidence in adults. Indeed, available literature in adults reports contradictive results, with some studies reporting a relationship(Reference Johannsen, Knuth and Huizenga36,Reference McNeil, Lamothe and Cameron37) , while others do not(Reference Müller, Enderle and Bosy-Westphal14,Reference Martins, Gower and Hill38) . To this effect, a recent high-quality systematic analysis performed by Nunes et al. confirmed the absence of a relationship between the magnitude of WL and AT(Reference Nunes, Casanova and Francisco19). Importantly, while Lopez Torres also conclude to the absence of relation between the degree of WL and AT in adults with obesity, by including several weight loss interventions in their study (dietary restriction alone or combined with bariatric surgery), they also corroborated that AT is independent of the WL strategy used(Reference Lopez Torres, Aukan and Gower10,Reference Müller, Enderle and Bosy-Westphal14,Reference Nunes, Casanova and Francisco19) , which has yet to be investigated in youth with obesity. In addition, the present results seem to corroborate those from Nymo and colleagues who failed to find any association between AT and the weight loss maintenance or regain after a 1-year follow-up in adults with obesity(Reference Nymo, Coutinho and Rehfeld39). Indeed, when splitting our sample at T2 between adolescents considered as weight loss maintainers or regainers (using 5 % the induced weight loss at T1 as a threshold, n 16 and 10, respectively), AT at T2 using both equations was not statistically different (ATp1 P = 0·118 and ATp2 P = 0·080, data not detailed). Interestingly, our results suggest a negative correlation between the AT at T1 (after weight loss) and the adolescents’ initial FFM and also FFM variation during the WL intervention. This may indicate that adolescents with the highest initial degree of FFM, who are also those who lose the most FFM during the intervention, are also the ones who show the largest decrease in REEm compared to the REEp (i.e. higher degree of AT). This potentially positions FFM and its variations as major parameters involved in the modulation of energetic compensatory mechanisms to WL (AT and potential appetite compensatory responses(Reference Dulloo, Jacquet and Miles-Chan40)). Importantly, the absence of a relationship between AT and the degree of weight loss could be attributed to the fact that AT might be mainly attributed to the magnitude of the energy restriction itself and appear early during the intervention, before major changes in body weight and body composition are observed(Reference Doucet, St-Pierre and Alméras41). This should lead to the exploration of these energetic adaptations to WL at regular short intervals from the early stage of interventions.
While not associated with the degree of WL, AT has been postulated to be a compensatory response that resists WL during the intervention, also promoting future weight regain(Reference Nunes, Casanova and Francisco19). Some studies conducted in adults with obesity indeed observed a greater AT among weight regainers(Reference Camps, Verhoef and Westerterp42–Reference Thom, Dombrowski and Brosnahan44). Interestingly, our analysis shows that higher weight loss induced-AT is associated with higher BW and fat mass regain after the 4-month follow-up in this group of adolescents. These results seem to confirm AT as a compensatory mechanism that could contribute to limiting weight loss while favouring subsequent weight and adiposity rebounds.
Importantly, our results indicate an important inter-individual variability of AT at both T1 and T2. This is illustrated by the large standard deviations obtained when calculating mean and sd for AT at T1 (–77·5 (sd 143·4) kcal), which bears a resemblance to values observed in adults with obesity(Reference Nunes, Casanova and Francisco19), and with results recently reported by Lopez Torres et al. in adults who underwent a 10-week dietary restriction induced WL (–84·4 (sd 217·5) kcal)(Reference Lopez Torres, Aukan and Gower10). Moreover, Fig. 3 indicates that although significantly correlated, the AT at T1 and T2 (using both equations) might not evolve in the same direction at the individual level (at T1 and T2). This clearly calls for further exploration of this AT using larger samples and focusing on its individual determinants to not only identify (or not) its presence in response to weight loss but also to determine its clinical relevance and significance. Focusing on this inter-individual variability seems indeed necessary to identify the clinical implications of this AT to empower our weight loss interventions and weight maintenance strategies.
As an exploratory analysis, the present results must be interpreted in light of some limitations, the reduced sample size certainly being the first one, as well as the lack of a control group (without weight loss intervention) and the lack of evaluation of the evolution of the maturation during the intervention. This reduced sample must be particularly considered when using multiple linear regression approaches. Importantly, however, the present sample was carefully characterised, and the equations were applied consistently across all analyses, ensuring internal validity. In addition, the main aim was not to establish definitive prediction models but rather to generate new hypotheses and highlight potential patterns warranting confirmation in larger cohorts. It must also be noticed that a large proportion of studies reporting AT in adults propose similar total or subsample sizes(Reference Lopez Torres, Aukan and Gower10,Reference Nunes, Casanova and Francisco19) . The use of dual X-ray absorptiometry scans to assess the adolescents’ body composition, while among the available gold standards, provides us with an evaluation of their overall FFM and then hides the respective implication of organ changes with WL and of their crucial implication when it comes to AT(Reference Müller, Enderle and Bosy-Westphal14). Another potential limitation might be the lack of strict control of the adolescents’ energy balance status, which has been previously required to be stable for up to 3 weeks before any REE measurement(Reference Garrow and Webster45) with stable energy intakes and expenditures(Reference Molé46), to obtain representative and objective values. Similarly, the lack of information regarding the adolescents’ free-living physical activity level before T2 is missing as it has been suggested to contribute to the maintenance of energetic adaptations such as AT after weight loss(Reference Hall47). Importantly, however, as previously published, the adolescents’ 7-d self-reported energy intake and 24-h-measured ad libitum intake were not different prior to evaluations at T1 and T2, and their REE and 24-h EE were also similar(Reference Isacco, Lazzer and Pereira33), strengthening the confidence in the obtained results. There seems to be a need for further studies with larger samples to compare the AT responses to weight loss and weight regain between individuals with and without sustained/stable energy balance (the present reduced sample makes it difficult to explore). It must also be noticed that the present results are obtained in the context of a multidisciplinary intervention, while different responses might be observed in response to exercise-only weight loss strategies. Indeed, of the seven studies included in Nunes et al.’s review and that integrated exercise combined or not with dietary interventions in their programme, the only one that did not observe AT was the one with an exercise-only intervention(Reference Nunes, Casanova and Francisco19). This clearly calls for a better exploration of the role of exercise, alone or as part of larger interventions, on the potential energetic adaptations to weight loss.
While not considered in this work, this present exploration of AT would benefit from a deeper consideration of the adolescents’ substrate mobilisation and oxidation, especially fat, as well as of their energy intake, and whether they meet their energy demand related to the variation of body composition compartments. Importantly, however, the calculation of AT in the present work fits with the recommendations recently proposed by Nunes and colleagues (mainly the use of objective methods and controlled protocols to assess body composition and energy expenditure and the use of a REEp equation based on the studied sample characteristics at T0) (for details see(Reference Nunes, Casanova and Francisco19)). Of note, while the observed differences remain low and while this might be directly due to the modest sample size, the identified AT in the present work is only significant when using the REEp equation involving FFM only. Although this might suggest the potential role of FM in buffering the energetic effect of FFM (this energetic implication of FM being most of the time under-considered), this must lead to further studies in the paediatric population.
To conclude, these preliminary results tend to confirm in adolescents with obesity what was previously described in adults, suggesting the existence of AT in response to WL, independently of the degree of WL and of the adolescents’ initial BW and FM. Importantly, FFM and its evolution during WL (but not weight regain) appear as key parameters involved in this AT. Finally, the present results add to the literature that this AT in response to WL might be associated with subsequent BW and fat regain, proposing AT as a compensatory mechanism, refraining from weight loss while increasing the adolescents’ risks for subsequent weight and adiposity rebounds.
Acknowledgements
The authors want to thank all the participants and the Romagnat Inpatient Pediatric Obesity Clinics.
This study did not receive any specific funding.
Y. B., S. L. and C. M. designed and conducted the research; D. T., L. I. and B. P. analysed the data; and D. T., L. I., E. D., S. L., M. J. M, A. B-W. and Y. B. wrote the paper. D.T. and L. I. had primary responsibility for the final content. All authors read and approved the final manuscript.
The authors do not have any conflicts of interest to declare.
Data might be available upon request.
AI has not been used for writing this manuscript.
Supplementary material
For supplementary material/s referred to in this article, please visit https://doi.org/10.1017/S0007114525105837.