INTRODUCTION
Plant communities on pastures suffer constant disturbance resulting from animal impact and seasonal weather changes. In order to survive, plants rely on mechanisms that allow for population stability and sward persistence (Matthew et al. Reference Matthew, Assuero, Black, Sackville Hamilton, Lemaire, Hodgson, de Moraes, Carvalho and Nabinger1999). Population stability depends on the turnover of tillers in the population, which is represented by the balance between tiller appearance rate (TAR) and tiller death rate (TDR), respectively (Matthew et al. Reference Matthew, Assuero, Black, Sackville Hamilton, Lemaire, Hodgson, de Moraes, Carvalho and Nabinger1999). A positive balance indicates greater tiller appearance relative to tiller death, and is indicative of an increasing tiller population. Under unfavourable weather conditions, rates of tiller death normally overcome rates of tiller appearance and the balance becomes negative, indicative of a decreasing tiller population.
Da Silva et al. (Reference Da Silva, Sbrissia and Pereira2015) suggested that seasonal variation affects both the number of new tillers produced and the longevity of existing tiller generations. Periods when availability of climatic growth factors (e.g., temperature and rainfall) is high, such as late spring and summer seasons, are characterized by increased rates of tiller appearance and death and, therefore, short-lived generations. During autumn, winter and early spring seasons, tiller survival increases, but not enough to offset the reduction in tiller appearance, and as a result, tiller population density (TPD) may decrease. Such variations in tillering dynamics represent a natural cycle of plant growth throughout the year (Da Silva et al. Reference Da Silva, Sbrissia and Pereira2015). The pattern of plant growth described previously occurs regardless of grazing strategy or nitrogen (N) fertilization (Da Silva et al. Reference Da Silva, Sbrissia and Pereira2015). Severe grazing during periods of low tiller appearance, or long grazing intervals during periods of high tiller turnover (Pereira et al. Reference Pereira, Paiva, Geremia and Da Silva2014, Reference Pereira, Paiva, Geremia and Da Silva2015a ), may be highly detrimental to sward persistence (Matthew & Sackville Hamilton Reference Matthew, Sackville Hamilton and Kerr2011). Understanding the tillering process and effects of defoliation strategies and seasons of the year on tiller demography favours identification of management opportunities that allow for optimization of plant growth (Fialho et al. Reference Fialho, Da Silva, Gimenes, Gomes, Berndt and Gerdes2012).
Matthew & Sackville Hamilton (Reference Matthew, Sackville Hamilton and Kerr2011) analysed tiller survival diagrams for different temperate and tropical grass species. Results suggested that each grass species has a unique perennation strategy, which determines plant persistence or lack of persistence under grazing. Such perennation strategies may be quite different among plants, but are generally determined by variations in the relative importance of tiller appearance and survival of both basal and aerial tillers. These variations are crucial in determining plant resilience and longevity. Pereira et al. (Reference Pereira, Paiva, Geremia and Da Silva2015b ) verified that Pennisetum purpureum Schum. cv. Napier, when subjected to frequent defoliation (pre-grazing condition at 95% canopy light interception), had a larger contribution of basal tillers, and when less frequent defoliation was applied (pre-grazing condition at maximum canopy light interception; approximately 98% canopy light interception) a larger number of aerial tillers per support unit (basal tillers + decapitated tillers) was observed. The larger number of aerial tillers is a growth strategy analogous to the increase in tiller number per integrated physiological unit (IPU; Briske & Derner Reference Briske, Derner and Cheplick1998). Although a more intense resource sharing would be expected under those conditions because of the intense intra-clonal competition, such a growth strategy was shown to be effective for maintaining population stability. However, some grass species (e.g. Panicum maximum cv. Mombaça; Montagner et al. Reference Montagner, Nascimento, Sousa, Vilela, Silveira, Euclides, Da Silva and Carlotto2012) seem incapable of increasing tiller numbers per IPU. Therefore, the adoption of grazing strategies that impair basal tillering may result in decreasing population stability in some grass species, reducing sward persistence and longevity.
Mulato grass is the International Center for Tropical Agriculture (CIAT) 36061 Brachiaria hybrid (Brachiaria ruziziensis × Brachiaria brizantha cv. Marandu; Argel et al. Reference Argel, Miles, Guiot and Lascano2006) released in Brazil in 2003 as an option for farmers and for commercialization of seeds in 2004. In spite of its high dry matter production potential, information regarding its use and management as a pasture-forming species is scarce and little is known about the effects of grazing management strategies throughout the year on tillering. Against this background, the hypothesis of the present study was that frequency and severity of defoliation alter the proportion of aerial and basal tillers in the plant population. Consequently, the intensity of intra-clonal competition changes, with impacts on population stability. The objective of the present study was to evaluate aerial, basal and total TPD, and changes in tillering dynamics as affected by contrasting strategies of rotational grazing management.
Materials and methods
Experimental site and treatments
The experiment was conducted at the University of São Paulo, College of Agriculture ‘Luiz de Queiroz’, in Piracicaba, SP, Brazil (22°43′S, 47°25′W, 554 m a.s.l.; Ometto Reference Ometto1981) on a Mulato grass (Brachiaria ruziziensis × Brachiaria brizantha cv. Marandu) pasture established in November 2004 on Mollisol and Vertisol loamy soils (EMBRAPA 1999). Climate at the experimental site is sub-tropical with dry winters, and 1328 mm average annual rainfall (CEPAGRI 2012). The average daily air temperature during the experimental period was similar to the historical data from 1917 to 2012. The lowest temperature was recorded in July (10 °C) and highest in February (32 °C). The greatest levels of rainfall were observed during summer (January–March), and the lowest were observed from July to November of 2008 (winter and early spring), which resulted in soil water deficits.
Treatments were combinations of two pre-grazing conditions (95% and maximum canopy light interception (LI) during regrowth; termed LI95% and LIMax, respectively) and two post-grazing heights (PGH; 15 and 20 cm). Treatments were allocated to experimental units (1200 m2 paddocks) according to a 2 × 2 factorial arrangement and a randomized complete block design (stratified by soil type and slope of the experimental site), with four replications. Before treatment implementation, paddocks were grazed and mown to 10 cm for standardization on 30 November 2007. Targets for post-grazing height were established during the first grazing cycle after mowing on mid- to late January 2008, with measurements starting from the second grazing cycle onwards. Grazing was performed by Nelore (Bos taurus indicus) and Canchim (5/8 Charolais, Bos taurus taurus, and 3/8 Zebu, B. t. indicus) cows and heifers. The number of animals required to finish grazing in 10–12 h was calculated using the mob stocking method (Gildersleeve et al. Reference Gildersleeve, Ocumpaugh, Quesenberry and Moore1987). During the first pasture growing season (November 2007–March 2008), a total of 270 kg N/ha was applied. Initially, 60 kg N/ha was applied as ammonium nitrate after mowing. The remaining 210 kg N/ha was applied in instalments after each grazing: in order to maintain the targeted treatment specifications, grazing intervals were adjusted to each treatment. Therefore, the remaining amount of fertilizer (210 kg N/ha) was divided by the duration of the growing season (January–March) and a daily rate of N application was established. The amount of N applied per paddock after grazing was proportional to the duration of the corresponding grazing interval (daily rate × grazing interval), ensuring equal application of N fertilizer to all experimental paddocks at the end of the growing season. The same procedure for calculating individual paddock N application was used during the second growing season (November 2008–March 2009).
Measurements
Canopy LI was monitored with a leaf area index (LAI) 2000 canopy analyser (LI-COR, Lincoln, NE, USA). Readings were taken early in the morning or late in the afternoon, because the equipment does not work with direct radiation. Initially, LI measurements were taken once weekly until 90% LI was achieved. Once canopy LI had reached 90%, measurements were taken daily to allow precise determination of LI pre-grazing targets (LI95% and LIMax). Maximum canopy light interception (LIMax) was attained when the recorded value did not change over two consecutive evaluations and corresponded to an average of 99%. The effective values of canopy LI for the LI95% and LIMax targets (canopy LI was similar for both post-grazing heights) were 95·0 and 99·1%, respectively. Canopy LI measurements were taken from ten randomly selected points per paddock. At each point, five readings were made at ground level and one reading was taken above the canopy (total of 50 readings at ground level and ten readings above the canopy per paddock). Sward height was monitored simultaneously with canopy LI measurements, using a sward stick along a transect line placed in each paddock (100 readings per paddock; Barthram Reference Barthram1985). To avoid sward height overestimation, readings were taken considering the leaf horizon on top of the sward as a reference, and any reproductive or flowering stems observed above the established horizon were disregarded (Carnevalli et al. Reference Carnevalli, Da Silva, Bueno, Uebele, Bueno, Hodgson, Silva and Morais2006).
Tiller population density was determined at pre-grazing by counting the total number of tillers within 0·25 m2 metal frames (four frames per paddock). Metal frames were allocated to areas that represented the average sward condition at the time of sampling (based on visual assessment of herbage mass and height; Carvalho et al. Reference Carvalho, Da Silva, Sbrissia, Pinto, Carnevalli, Fagundes and Pedreira2000). All tillers present in each frame were counted and categorized as basal or aerial (non-rooted tillers originated from axillary buds) tillers. The sum of basal and aerial tillers represented the total tiller population.
Measurements of tillering dynamics were made at post-grazing using two 30 cm-diameter polyvinyl chloride rings per paddock in areas representative of the average sward condition (based on visual assessment of herbage mass and height; Carvalho et al. Reference Carvalho, Da Silva, Sbrissia, Pinto, Carnevalli, Fagundes and Pedreira2000). Initially, all tillers present in the ring were tagged with plastic rings of the same colour and counted (basal and aerial tillers separately). These corresponded to the first tiller generation (G1). After grazing, the remaining live tillers from G1 were counted and new ones tagged (tillers that appeared in between tagging procedures) with plastic rings of a different colour. These were denominated second generation (G2). The procedure was repeated every grazing cycle throughout the experimental period using different colours. For each tiller generation, TAR was determined as the ratio between the number of new tillers tagged on day t and the total number of surviving tillers during grazing on the previous day (t−1). Tiller survival rate was determined as the ratio between the number of surviving tillers on day t and total number of surviving tillers on day t−1. Tiller death was calculated as the complement of tiller survival to 1. The combined effect of TAR and TDR was evaluated by the tiller population stability index (SI; Bahmani et al. Reference Bahmani, Thom, Matthew, Hooper and Lemaire2003), calculated on the basis of the following equation:
 $${\rm SI} = {\rm TPi}/{\rm TPf} = {\rm TSR}(1 + {\rm TAR})$$
where TPi is the initial tiller population, TPf is the final tiller population, TSR is the tiller survival rate, and TAR is the tiller appearance rate. Tiller population was considered stable when SI = 1, decreasing when SI <1 and increasing when SI >1.
Additionally, the combined effect of TAR and TDR was evaluated using the balance between rates of tiller appearance and death. Positive balances indicate greater tiller appearance relative to tiller death, and are indicative of increasing tiller population. Negative values indicate lower tiller appearance relative to tiller death, and are indicative of decreasing tiller population. Grazing intervals changed among treatments (because of treatment definitions); therefore, values of tiller appearance, death and survival were adjusted to a 30-day period using simple linear interpolation assuming a constant daily survival rate (Bahmani et al. Reference Bahmani, Thom, Matthew, Hooper and Lemaire2003).
Statistical analyses
The experimental period started in February 2008 and ended in March 2009, comprising four seasons of the year: summer 2008 (February–March 2008); autumn–early spring (April to mid-November 2008); late spring (mid-November to December 2008); and summer 2009 (January–March 2009).
Analysis of variance was performed using analysis of variance (ANOVA) with the Mixed Procedure in SAS® (version 9.2). Blocks were considered random terms, and LI pre-grazing, post-grazing height and season of the year were considered fixed effects. Seasons of the year were treated as repeated measures. Bonferroni adjustment was used to allow for planned comparisons between treatments and seasons of the year. Different structures of the variance–covariance matrix were tested and the compound symmetry structure was chosen as the best fit for the majority of variables based on the Bayesian information criterion. All tests were performed with 95% confidence (α = 0·05). The model was as follows:
 $$\eqalign{y & = \mu + \rho _i + \alpha _j + \beta _k + \gamma _l + \alpha \beta _{\,jk} + \gamma \alpha _{lj} + \gamma \beta _{lk} + \rho \alpha _{ij} \cr & \quad + \rho \beta _{ik} + e_{ijkl}}$$
where μ is the overall mean, ρ i is the random effect of the ith block (ρi ~ N(0, s 2 ρ)), α j is the fixed effect of the jth level of factor A (frequency of defoliation), β k is the fixed effect of the kth level of factor B (severity of defoliation), γ l is the fixed effect of the lth season of the year, αβ jk is the interaction between jth frequency of defoliation and the kth severity of defoliation, γα lj is the interaction between the lth season of the year and the jth frequency of defoliation, γβ lk is the interaction between the lth season of the year and the kth severity of defoliation, ρα ij is the interaction between the ith block and the jth frequency of defoliation and ρβ ik is the interaction between ith block and the kth severity of defoliation and e ilk is the residual term (e ilk ~ N(0, σ)).
RESULTS
Tiller population density
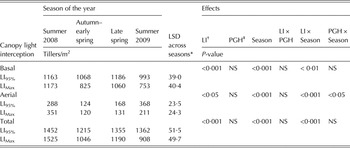
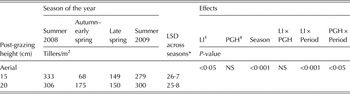
The basal and aerial TPD varied with LI (P < 0·001 and P < 0·05, respectively), season of the year (P < 0·001, for both densities) and the LI × season of the year interaction (P < 0·01 and P < 0·001, respectively). Despite the non-significant effect of post-grazing, the interaction post-grazing height × season of the year was significant for aerial TPD (P < 0·05). Therefore, means are shown pooled by post-grazing height for aerial, basal and total TPD (Table 1), and pooled by LI for aerial TPD (Table 2).
Tiller population density (TPD) in Mulato grass subjected to strategies of rotational grazing management characterized by the pre-grazing targets of 95% and maximum canopy light interception during regrowth from February 2008 to April 2009

LSD values with the Bonferroni correction for comparison of means across LI treatments were 21·7, 13·7 and 29·1 for basal, aerial and total tillers.
* LSD values with the Bonferroni correction for comparison of means across seasons.
† Light interception.
‡ Post-grazing height.
Aerial tiller population density (aerial TPD) in Mulato grass subjected to strategies of rotational grazing management characterized by the post-grazing heights of 15 and 20 cm from February 2008 to April 2009

LSD values with the Bonferroni correction for comparison of means across PGH was 12·9.
* LSD values with the Bonferroni correction for comparison of means across seasons.
† Light interception.
‡ Post-grazing height.
The basal TPD varied with LI during autumn–early spring and summer 2009. There was a decrease in basal tillers/m2 during autumn–early spring and summer 2009, which also caused these seasons of the year to differ from summer 2008 and late spring (Table 1). During autumn–early spring, there was a decrease in basal TPD for both LI treatments. However, the decrease for treatment LIMax was larger, resulting in differences between LI treatments. The same pattern was observed during summer 2009; the seasonal decrease in basal TPD was larger for the LIMax treatment. In fact, it was observed that both LI treatments had similar initial basal TPD at the beginning of the experiment in summer 2008 (1163 and 1173 tillers/m2 for treatments LI95% and LIMax, respectively).
In general, the density of aerial tillers decreased as the experiment progressed from summer 2008 to autumn–early spring and late spring (Table 1). The decrease was larger for the 15 cm post-grazing height relative to the 20-cm height during autumn–early spring (Table 2). During summer 2009, the aerial tiller density increased for both LI treatments. However, the increase in aerial tiller population for treatment LIMax was smaller than for treatment LI95%, resulting in greater tiller population for treatment LI95%. Variation in total TPD (basal + aerial) for treatment LI95% was small throughout the experiment. Tiller numbers decreased from summer 2008 to autumn–early spring, but tended to remain stable from autumn–early spring to summer 2009. On the other hand, for treatment LIMax total tiller population tended to decrease throughout the experiment, resulting in differences between LI treatments during summer 2009 (Table 1).
Tillering dynamics
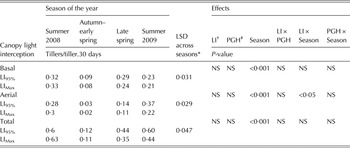
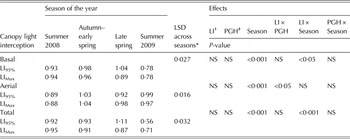
The appearance of basal, aerial and total tillers varied with season of the year (P < 0·001; Table 3). In general, tiller appearance decreased considerably from summer 2008 to autumn–early spring. On average, there was a 73% decrease for basal tillers, 90% for aerial tillers and 82% for total tillers. From autumn–early spring to summer 2009 tiller appearance increased, reaching similar levels to summer 2008. For aerial tillers, the increase was larger for treatment LI95%, resulting in LI treatment differences in summer 2009 and characterizing a LI × season of the year interaction (P < 0·05; Table 3).
Tiller appearance rate (TAR) in Mulato grass subjected to strategies of rotational grazing management characterized by the pre-grazing targets of 95% and maximum canopy light interception during regrowth from February 2008 to April 2009

LSD values with the Bonferroni correction for comparison of means across LI treatments were 0·016, 0·015, and 0·024 for basal, aerial and total tillers.
* LSD values with the Bonferroni correction for comparison of means across seasons.
† Light interception.
‡ Post-grazing height.
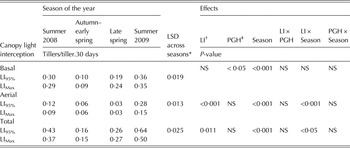
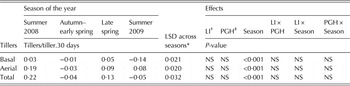
The death of basal, aerial and total tillers varied with season (P < 0·001; Table 4), following a similar pattern of variation to tiller appearance. Tiller death decreased considerably from summer 2008 to autumn–early spring, and increased from late spring to summer 2009. For aerial and total tillers, the increase was larger for treatment LI95%, resulting in LI treatment differences in summer 2009 and characterizing a LI × season of the year interaction (P < 0·001 and P < 0·05 for LI95% and LIMax, respectively).
Tiller death rate (TDR) in Mulato grass subjected to strategies of rotational grazing management characterized by the pre-grazing targets of 95% and maximum canopy light interception during regrowth from February 2008 to April 2009

LSD values with the Bonferroni correction for comparison of means across LI treatments were 0·009, 0·007 and 0·013 for basal, aerial and total tillers.
* LSD values with the Bonferroni correction for comparison of means across seasons.
† Light interception.
‡ Post-grazing height.
Population stability
The population SI of basal tillers remained relatively stable from summer 2008 to late spring, decreasing only during summer 2009 for both LI treatments (P < 0·001), when the lowest values were recorded (Table 5). Differences between LI treatments were detected only in late spring, when greater values were recorded for treatment LI95% relative to treatment LIMax, characterizing a LI × season of the year interaction (P < 0·05; Table 5).
Tiller population stability index (SI) in Mulato grass subjected to strategies of rotational grazing management characterized by the pre-grazing targets of 95% and maximum canopy light interception during regrowth from February 2008 to April 2009

LSD values with the Bonferroni correction for comparison of means across LI treatments were 0·015, 0·008 and 0·020 for basal, aerial and total tillers.
* LSD values with the Bonferroni correction for comparison of means across seasons.
† Light interception
‡ Post-grazing height
For aerial tillers, the population SI varied with season of the year and with the LI × post-grazing height interaction (P < 0·001 and 0·05, respectively). Recorded values increased from summer 2008 to autumn–early spring, with values remaining relatively stable and close to 1 until the end of the experiment in summer 2009 (Table 5). Despite the significant effect of the LI × PGH interaction (P < 0·05), no differences were observed on SI of aerial tillers for LI treatments or post-grazing heights (0·97 and 0·95 ± 0·01 for treatments LI95%, with post-grazing heights of 15 and 20 cm, respectively; 0·95 and 0·99 ± 0·01 for LIMax with post-grazing heights of 15 and 20 cm, respectively).
The population SI for total tiller population varied with season of the year and with the LI × season of the year interaction (P < 0·001). From summer 2008 to late spring, values decreased for treatment LIMax and increased for treatment LI95%, resulting in differences between LI treatments in late spring and characterizing a LI × season of the year interaction (Table 5). Values decreased for both LI treatments from late spring to summer 2009, with greater reduction for treatment LI95%.
Balance between tiller appearance and death
The balance between tiller appearance and death for basal, aerial and total tillers varied only with season of the year (P < 0·001). For basal tillers, the balance remained relatively stable from summer 2008 to late spring, decreasing to negative values in summer 2009 (Table 6). For aerial tillers, the balance decreased to negative values from summer 2008 to autumn–early spring for both LI treatments, remaining stable during late spring and summer 2009 for treatment LIMax and increasing to positive values for treatment LI95%. For total tiller population, the balance decreased to negative values from summer 2008 to autumn–early spring, remaining stable for treatment LIMax and restoring positive values for treatment LI95% in late spring. For both LI treatments, values became negative during summer 2009.
Balance between tiller appearance and death in Mulato grass subjected to strategies of rotational grazing management characterized by the pre-grazing targets of 95% and maximum canopy light interception during regrowth from February 2008 to April 2009

* LSD values with the Bonferroni correction for comparison of means across seasons.
† Light interception.
‡ Post-grazing height
DISCUSSION
Persistence of grass swards can be explored in terms of the contribution of tiller appearance and death to changes in TPD over time (Matthew & Sackville Hamilton Reference Matthew, Sackville Hamilton and Kerr2011). Fundamentally, the failure of pasture persistence may be a consequence of inadequate production of new tillers or low tiller survival, or of excessive tiller death (Matthew et al. Reference Matthew, Assuero, Black, Sackville Hamilton, Lemaire, Hodgson, de Moraes, Nabinger and Carvalho2000 Matthew & Sackville Hamilton Reference Matthew, Sackville Hamilton and Kerr2011). A decrease in TPD could be expected from summer to autumn–early spring, since the latter corresponds to a period of unfavourable weather conditions.
The rotational grazing strategies used in the present study influenced the magnitude of reduction in TPD, for both basal and aerial tillers. Population density of basal tillers decreased by about 8 and 30% in swards maintained under frequent defoliation (LI95%) or submitted to longer regrowth periods (LIMax), respectively, from summer 2008 to autumn–early spring. Greater reduction was observed for aerial tillers (around 62%), and a higher impact of defoliation severity was observed during autumn–early spring season. Severe grazing, represented by the post-grazing height of 15 cm, resulted in a 79% reduction in TPD of aerial tillers. For moderate grazing, represented by the post-grazing height of 20 cm, the reduction was 45%.
The pattern of variation in TPD of basal and aerial tillers is different from that reported for Napier elephant grass (P. purpureum Schum. cv. Napier), characterized by an increase in population density of aerial tillers during autumn–winter (Pereira et al. Reference Pereira, Paiva, Geremia and Da Silva2015b ). However, seasonal cycles of tiller appearance and death and the proportion of aerial tillers in total TPD for Mulato grass (varying from 10% in autumn–early spring and late spring to 27% during summer) was similar to that observed for Marandu palisade grass (Brachiara brizantha cv. Marandu; Sbrissia et al. Reference Sbrissia, Da Silva, Sarmento, Molan, Andrade, Gonçalves and Lupinacci2010).
Matthew et al. (Reference Matthew, Assuero, Black, Sackville Hamilton, Lemaire, Hodgson, de Moraes, Nabinger and Carvalho2000) remarked that grass species utilizing the ‘reproductive’ perennation pathway have a high percentage of flowering tillers, particularly during autumn, and must maintain higher site filling in order to ensure sward persistence. The ‘reproductive’ perennation pathway appears to be expressed in Napier elephant grass, with aerial tillers being used to maximize site filling. On the other hand, Meadow fescue (Festuca pratensis L.) relies on a strategy based on increasing number of tillers during spring, which remain alive throughout the entire pasture-growing season until flowering (Matthew et al. Reference Matthew, Assuero, Black, Sackville Hamilton, Lemaire, Hodgson, de Moraes, Nabinger and Carvalho2000). This strategy was previously described as the ‘vegetative’ pathway, and seemed most appropriate to explain seasonal patterns of variation in TPD and in tiller appearance and death rates described for both Marandu palisade grass and Mulato grass.
When favourable weather conditions returned during late spring, rates of tiller appearance surpassed the rates of tiller death for both basal and aerial tillers, and population density was re-established. In spite of that, basal tillers were the predominant tiller category, comprising the total population during late spring. Frequency of defoliation played an important role in determining the population SI of basal tillers during late spring, since higher values were recorded on swards managed with the LI95% target relative to those managed with the LIMax target.
A shift in the variation pattern of population density between tiller classes was observed from late spring to summer 2009, which was largely dependent on the frequency of defoliation used. A negative balance between rates of tiller appearance and death resulted in decreasing TPD of basal tillers, which was associated with increased TPD of aerial tillers for both LI95% and LIMax. However, TPD of basal tillers decreased by 16·8 and 29·2%, with corresponding increases in TPD of aerial tillers of 117 and 62% for LI95% and LIMax, respectively. These changes in TPD between tiller classes allowed for relative stability of total TPD from late spring to summer 2009 on swards managed with the LI95% target, but not for those managed with the LIMax target. Greater TPD on swards managed with the LI95% target were previously observed for tall fescue (Festuca arundinacea L.), especially during summer (Scheneiter & Améndola Reference Scheneiter and Améndola2012). Aerial tillers are usually short-lived, highly dependent on basal tillers for nutrition, water supply and support, and are readily available for grazers and susceptible to decapitation. However, the results of the current experiment showed that aerial tillering is an important growth strategy for Mulato grass and may contribute to short-term resilience of swards.
Rates of tiller appearance and death during summer 2009 were higher on swards managed with the LI95% target compared with LIMax target swards. The greater rates of tiller appearance and death during periods of favourable weather conditions indicate a high turnover in tiller population, regardless of the grazing strategy used. The turnover in tiller population, however, is greater under more frequent defoliation (greater tiller appearance and death), as represented by the LI95% treatment in the present study. The ability to replace dead tillers during periods of active plant growth indicates a younger profile of the tiller population throughout the pasture growing season (late spring and summer), a condition that contributes to greater sward growth and nutritive value (Paiva et al. Reference Paiva, Pereira, Da Silva and Dias2015).
While frequency of defoliation played a central role in determining the observed changes in rates of tiller appearance and death and in population density of basal and aerial tillers during late spring and summer 2009, the lack of significant effect of post-grazing height suggests that grazing was not severe enough to generate changes in tillering patterns. On average, the percentage of the pre-grazing height removed by grazers on swards managed with the 15-cm post-grazing height was 51·8 and 45·1% for LI95% and LIMax targets, respectively. On swards managed with the 20-cm post-grazing height, corresponding values were 66·7 and 49·4%. According to Da Silva et al. (Reference Da Silva, Sbrissia and Pereira2015), defoliation severities equivalent to 40–60% removal of the initial (pre-grazing) height are within the limits of grazing resistance and use of plants, and ensure favourable conditions for high rates of sward growth, herbage intake and animal performance when associated with adequate pre-grazing management targets. Exceptionally, during autumn–early spring, weather conditions were not favourable, imposing a greater level of stress on plants (low temperatures and soil moisture levels) and, therefore, grazing severity had significant effects. The results indicate the possibility of using different severities of grazing throughout the year as a means of maximizing tiller survival and offset low tiller appearance.
CONCLUSIONS
Mulato grass is a highly adaptable forage species, changing its development strategy according to weather conditions or grazing management. When conditions are not appropriate for basal tiller growth, Mulato uses aerial tillers as an occupation and perennation strategy. There is a seasonal effect on Mulato grass tillering and growth, which is influenced by grazing management. If grazing severity remains within an adequate agronomic range, ensuring a minimum residual LAI, tillering dynamics of Mulato grass are mainly affected and modulated by grazing frequency, since this changes the relative importance of the perennation strategies used. In spite of that, basal tillering corresponded to the predominant perennation pathway used and should be targeted when planning grazing management strategies.
The authors thank the São Paulo Research Foundation (FAPESP) and the National Counsel of Technological and Scientific Development (CNPq) for sponsorship.