INTRODUCTION
Improved radiotherapeutic techniques rely heavily on accurate dose delivery, sometimes requiring either differing prescribed doses to various organs within the radiation field, or constant prescribed doses to various inhomogeneities within the treatment field. In principle, this may be achieved by combinations of various beams, but can sometimes be realised only by employing custom-made attenuators in the beam. Attenuation materials are thus used for special purposes, such as (i) to shield (fully or partially) certain sensitive structures of the body from the radiation beam, (ii) to compensate the missing tissue in areas where the body surface is not flat and (iii) to draw the dose distributions inside the body to improve dose homogeneity in multiple beam techniques.
In order to calculate the thickness t of the required attenuator above the point of interest, the photon attenuation properties of these materials are usually measured in air using narrow-beam geometry. The narrow-beam half-value layer (HVL) of the attenuating material is thus obtained and the thickness of material, required to attenuate the dose from D 0 to D at the point of interest in phantom, is calculated from:Reference Attix1

where μ is the narrow-beam attenuation coefficient and is equal to ln 2/HVL.
Radiotherapy, however, is seldom delivered under narrow-beam geometry conditions and furthermore, the cross-section of the attenuators is often smaller than the radiation field size. The dose at a given point in a patient or phantom consists of two contributions: primary and scattered. The relative amount of each depends on the physical and geometrical properties of the beam and the attenuator as well as on the phantom conditions, such as its atomic number, its density and the depth of measurement.
The primary radiation component follows the narrow-beam attenuation exponential law (Eq. (1)); the scattered component, however, is hard to predict theoretically, as it depends, in a complicated fashion, on the properties of the beam, the phantom and the attenuator. Generally, the HVL to be measured in phantom for a given attenuating material is not constant but varies with the beam field size, the attenuator cross-section and the depth of measurements in phantom. These variations are sometimes accounted for by replacing the narrow-beam attenuation coefficient μ in Eq. (1) with an effective attenuation coefficient μeff, which may be considerably different from μ and can be determined empirically for individual field sizes and depths in phantom. The field-size dependence of the relative transmission of the high-energy photons through lead absorbers has been well known and considered for radiation protection purposes;Reference Fano2–Reference Jaradat, Adnan and Biggs, Peter7 however, virtually no quantitative data exist for therapeutic geometries.
Huang et al.Reference Huang, Chin and Bjarngard8 have studied the dose effects of the scattered photons generated in copper filters by 4-MV beam in air for therapeutic geometries. At a distance of 30 cm from the filter, a copper sheet of 1-cm thickness produces a dose contribution on the central axis of about 6% of the transmitted primary dose in a 20 × 20 cmReference Fano2 field.
In a previous work to be published,Reference Al-Ghorabie9 Al-Ghorabie performed an experimental and theoretical study on the effect of broad beams on the attenuation in lead in air for Cobalt-60 and at a depth of 5 cm in a water phantom for 6-, 18- and 25-MV X-rays. The measured attenuation coefficients for broad-beam geometries indicated typical treatment conditions, which were found to deviate by 16% from the narrow-beam data. The theoretical calculations performed were based on considerations of the first scattering in the attenuator and indicated a dependence on treatment geometry.
The International Commission on Radiation Units and Measurements has recommended an overall accuracy in dose delivery of ±5%, based on an analysis of dose–response data and on an evaluation of errors in dose delivery.10 If the dose distribution in phantoms resulting from usage of attenuators in standard radiotherapy fields is calculated with narrow-beam attenuation data, large errors in dose measurements may result.Reference Attix1
In this paper, we present results of our study about the radiation transmission through lead attenuators that are simulated and calculated for several types of photon beams at various depths in a homogeneous phantom. The theoretical analysis of the simulation results is performed using a computer program written to calculate analytically the radiation transmitted and scattered from three separate layers of media in a divergent radiation beam. The three layers are the attenuator, the air and the unit-density phantom. Only the first scattered beam is considered and is calculated analytically using the Klein–Nishina coefficients and the Compton scattering relationship.
MONTE CARLO SIMULATION
The MCNP Monte Carlo code
The Monte Carlo technique is a well-established and well-documented computational method,Reference Raeside11–Reference Andreo13 which can be used to assess whole-body, organ or tissue dose. The basis of the Monte Carlo method for photon transport is the computer simulation of individual photon histories and the averaging of these histories over many thousands of photons to provide the quantities of interest. In this study, photon trajectories along the different components of the broad-beam transmission system were simulated using the MCNP Monte Carlo code system. The MCNP codeReference Briesmeister14 is a general-purpose Monte Carlo code for calculating the time-dependent continuous energy transport of neutrons, photons and electrons in three-dimensional geometries. The MCNP code assumes a free-electron model for Compton scattering and employ the Klein–Nishina differential scattering cross-section to model the inelastic interaction mechanism.
Simulated geometry of the broad-beam transmission system
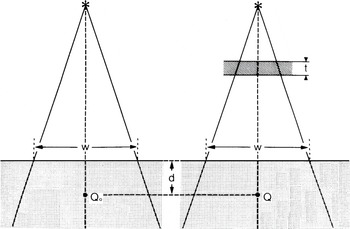
The simulated geometry of the broad-beam transmission system is shown in Figure 1. The major components are the radiation source, the lead attenuator and the water phantom.
Simulation geometry for the broad beam transmission system, with t the attenuator thickness, d the depth in phantom and w the field size at SSD.

In our simulation, MCNP generates photons from the radiation source which will either be a Cobalt-60 unit, or 4-, 6-, 10-MV X-rays. The photons are then directed towards lead attenuator where they can interact with the attenuator element. The interactions are mainly through photoelectric, Compton and coherent scattering processes. If the photoelectric process takes place, the incident photon disappears and characteristic radiation from the target element may be produced. When Compton process takes place, the code simulates the scattering and follows the photon towards the next interaction. Finally, if coherent scattering takes place, the new direction of the scattered photon will be defined and used for the next interaction. Photons are followed from their original energy down to a lower energy limit of 10 keV.
The MCNP code provides values for many variable parameters involved in the broad-beam transmission system. Examples of such parameters are:
1. Geometry of the broad-beam transmission system.
2. Primary spectrum of the incident photons from the source.
3. Size of the irradiation field.
4. Shape and dimensions of the lead attenuator and water phantom.
5. Type and dimensions of detectors at points Q 0 and Q.
6. Quantities scored by the detectors.
The points Q 0 and Q have been chosen to be at the same depth d in the water phantom. The dose at Q will be lower than the dose at Q 0 because of the attenuation of the radiation beam in the attenuator of thickness t. The calculated ratio of the two doses  has to account for the attenuation of the primary beam in the lead attenuator and for the radiation scattered in the lead attenuator and the water phantom. The ratio was measured at various field sizes w, depths in phantom d and thicknesses of the lead attenuator t. The results of these measurements were then compared to the calculated dose ratios using MCNP for the same geometrical conditions.
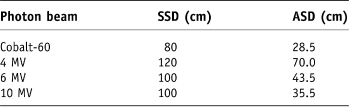
For all radiation field sizes, the size of water phantoms as well as that of lead attenuators was larger than the field size. The phantoms were irradiated with a Cobalt-60 unit, and 4-, 6- and 10-MV X-rays with source-to-skin (phantom) distances (SSDs) and attenuator-to-phantom distances as given in Table 1. The thickness of the lead attenuator was varied from 0.2 to 3.6 cm.
Source-to-skin (phantom) distances (SSDs) and attenuator-to-phantom distances (ASD) used in the simulation

CALCULATIONS AND ANALYSIS
The total dose at a point Q in phantom consists of the primary dose, single scatter dose and multiple scatter dose. The relative fraction of each depends on the radiation energy, the geometry of irradiation and the depth in phantom. It has been shown, using Monte Carlo calculations, that, for Cobalt-60 radiation and a circular field radius of 10 cm, the dose due to primary and singly scattered radiation in water accounts for 99% of the total dose at a depth of 0.5 cm and for 93% at a depth of 10 cm.Reference Wong, Henkelman, Fenster and Johns15,Reference Mackie16 However, for higher energy beams the contribution of multiple scattered radiations becomes more pronounced. As the primary and first scattered radiation account for a large proportion of the total dose, the analysis in this work will be restricted to primary and the first scattered radiation.
The effective beam energy for Cobalt-60 radiation is taken as 1.25 MeV, whereas for the high-energy X-rays the effective energy and linear attenuation coefficient are obtained from the initial portion of the attenuation curve. The effective energy approach works well for the Cobalt-60 beam, as it consists of monoenergetic photons emitted isotropically from the Cobalt-60 source. The high-energy X-ray beam produced in a linear accelerator, however, introduces two complications: first a photon spectrum, ranging in energy from 0 to a maximum value equal to the kinetic energy of the accelerated electrons in the waveguide, and second an angular dependence of the photon spectrum and energy for off-axis points. Attenuators placed into high-energy X-ray beams, therefore, have a twofold effect on the primary transmitted beams: in addition to attenuating them, they also harden or soften them (i.e., shift their effective beam energy above or below the initial value, the so-called beam-hardening effect) depending on the atomic number of the attenuating material and on the incident photon spectrum. This is in contrast to the situation with attenuators in the Cobalt-60 beam, where the primary beam only gets attenuated without any changes occurring in its monoenergetic spectrum. A more refined but also a more complicated approach to X-ray beam attenuation, therefore, is to account for the changes in both the intensity and the energy spectrum of the transmitted primary X-ray beam. Thus, for accelerator beams, we used two methods of calculation: the first assumed a monoenergetic beam with an effective energy determined from the initial portion of the attenuation curve and the second used a photon spectrum obtained from Mohan and ChuiReference Mohan and Chui17.
For a parallel beam of monoenergetic photons with an energy E 0 incident on a homogeneous phantom and electronic equilibrium at point Q, the dose at point Q, D p(Q), due to primary radiation is given by Attix:Reference Attix1

where d is the depth in phantom (cm), x03A6; the photon fluence (photons/cmReference Fano2) in vacuum at point Q, (μab/ρ)p the mass energy absorption coefficient (cmReference Fano2/g) for the primary photons in the phantom material, μp the narrow-beam linear attenuation coefficient (cm–1) for the phantom material at photon energy E 0 (MeV), and μab is the narrow-beam linear absorption coefficient.
Using a spherical coordinate system and a circular radiation field, the first scatter dose at Q (D s(Q)) in a homogeneous phantom from all surrounding elements in the radiation field is given by Attix:Reference Attix1

in which  ,
 ,
 and

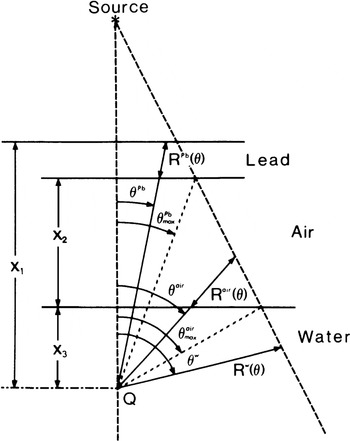
where θ is the scattering angle, and Φ, μ p and d are defined above. (dσ/dΩ) is the differential Compton cross-section per unit solid angle (cmReference Fano2/electron), E s the energy of the scattered photon (MeV), n e the electron density (electrons/cmReference Berger and Doggett3) of the phantom material, (μ ab/ρ)s the mass energy absorption coefficient for once-scattered photons in the phantom material (cmReference Fano2/g), μ s the linear attenuation coefficient (cm–1) for first-scattered photons in the phantom material, and R(θ) is as shown in Figure 2 for the three components of the simulated geometry (i.e. lead attenuator, air and the water phantom). Integrating Eq. (3) over dt gives:

Geometry used for the calculation of primary and first scatter dose to point Q from three separate layers (lead, air and water) in a divergent beam. θ represents the angles between the vertical distance between the source and point Q and the photon path through the three separate layers. R represents selected distances from the three separate layers. X represents the values of point Q-to-lead surface distance, air gab thickness and the depth of point Q inside the water phantom.

Figure 2 shows our simulation configuration represented by three layers: lead attenuator, air and water phantom. According to Eq. (2), the primary dose to point Q (D p(Q)) in the water phantom is now given by Attix:Reference Attix1

in which  where Φ, E 0 and
 are defined above, x 1, x 2 and x 3 are defined in Figure 2, and
 represent the primary beam linear attenuation coefficients for lead, air and water, respectively. The first scatter doses that contributed to point Q in water by the three layers shown in Figure 2 are now given by Attix:Reference Attix1

in which  and
 , S, K and G are defined above


where the parameters are defined above, and the superscripts denote the three layers of the simulated system (lead, air and water). It is clear from Figure 2 that θ Pb > θ air > θ w. The total dose at point Q in the water phantom accounting for the primary beam attenuation and first scatter from the various layers of Figure 2 is then:

A computer program was written in FORTRAN to calculate D(Q) for various experimental conditions relevant to radiotherapy and involving attenuators in the radiation beam. The program was run on the same PC (which have been used for the simulation study) to calculate D(Q) for a given attenuator thickness, field size, depth in phantom and for one incident photon energy. The values of linear attenuation and mass energy absorption coefficients are required for all the media that the beam traverses. These values for water and air were obtained from Johns and Cunningham,Reference Johns and Cunningham18 and those for lead were taken from Storm and Israel.Reference Storm and Israel19 The linear attenuation coefficient and the corresponding effective energy for the primary beam were determined from the initial slopes of our simulation of narrow-beam transmission data. The parameters for the scattered beam were obtained for the scattered photon energy, which was calculated for a given scattering angle ϑ from the standard Compton relationship. The differential Compton cross-section for a given ϑ has been calculated from the standard Klein–Nishina relationship. The electron densities for lead, water and air were obtained from Johns and Cunningham.Reference Johns and Cunningham18
RESULTS AND DISCUSSION
Primary beam transmission
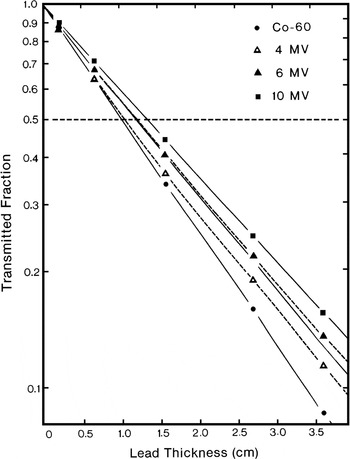
Results of narrow-beam transmission measurements through lead with a Cobalt-60 γ ray beam, and 4-, 6- and 10-MV X-ray beams are shown in Figure 3. The solid lines represent pure exponentials obtained from the initial slopes of the simulated transmission curves showing exponential attenuation for the Cobalt-60 and 10-MV beams. The dashed lines represent the deviation from exponentials for the 4- and 6-MV transmission curves. All simulations were made in phantom at the depth of maximum dose d max. In addition, simulations were made in air for the Cobalt-60 and 4-MV beams. For these two beams, the transmission curves in air and at d max in phantom were identical. The field size was 2 × 2 cmReference Fano2 at the surface of the phantom. The narrow-beam attenuation for the Cobalt-60 beam is exponential, as expected for a monoenergetic beam. For the X-ray beams, on the other hand, the slope of the transmission curve becomes less steep with increases in the lead attenuator thickness and the depth in the phantom because of the preferential attenuation of the low-energy photons in the spectrum. This effect is the most pronounced for the 4-MV beam, for which the initial slope of the attenuation curve gives an effective energy identical to that of the Cobalt-60 beam (1.25 MeV). After passing through 3.6 cm of lead, however, the beam effective energy increases to ∼1.5 MeV. As shown in Figure 3, the 6-MV transmission curve exhibits less beam hardening, and the 10-MV beam does not change its effective energy at all after passing through 3.6 cm of lead. It has been shown beforeReference Rawlinson and Johns20 that a higher energy heterogeneous beam, such as a 25-MV X-ray beam, will actually become softer, i.e., have a lower effective energy, after passing through several centimeters of a high atomic number material.
Narrow-beam transmission through lead simulated in the water phantom at d max for Cobalt-60 and 4-, 6- and 10-MV X-ray beams. The solid lines show exponential fit to the simulated attenuation curves. The dashed lines show the deviation from an exponential fit for the 4- and 6-MV beams.

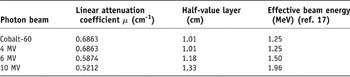
The linear attenuation coefficients and HVLs obtained from the initial slopes of our narrow-beam transmission data and the corresponding effective beam energies obtained from the data of Storm and IsraelReference Storm and Israel19 are listed in Table 2.
Simulated narrow-beam linear attenuation coefficients, half-value layers and effective beam energies in lead

Broad-beam geometry
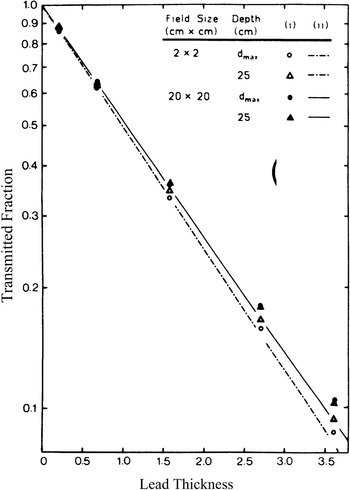
Radiotherapy is usually performed under broad-beam geometry conditions. Therefore, any attempt to calculate a dose distribution in phantom resulting from the usage of attenuators in the beam has to incorporate both the narrow-beam geometry attenuation coefficient and the effects of broad-beam scattering caused by the attenuator. Figures 4–7 compare the narrow-beam attenuation curves with attenuation curves for broad beams at two depths in phantom on the central beam axis for the four radiation beams used in our study. The ordinates, representing the transmitted fraction, are essentially correction factors. These factors are applied to the dose at point Q 0 in phantom, measured without attenuators to get the dose to the same point Q when an attenuator of a given thickness is in the radiation beam. Calculations were performed for circular fields equivalent to square fields used experimentally.
Narrow transmission is compared to the broad beam transmission through lead for Cobalt-60 γ rays. Simulated values are shown as (i) data points, calculated values are curves, (ii) monoenergetic calculation, and (iii) energy spectrum calculation.

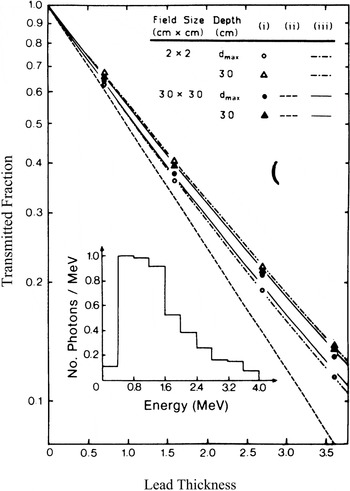
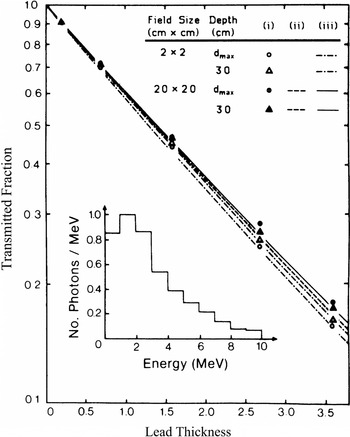
Narrow transmission is compared to the broad beam transmission through lead for 4-MV X-rays. Simulated values are shown as (i) data points, calculated values are curves, (ii) monoenergetic calculation and (iii) energy spectrum calculation. The incident photon spectrum is shown in the inset.

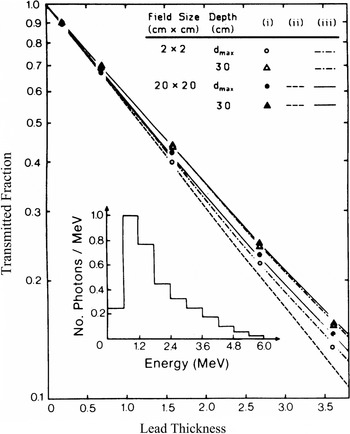
Narrow-beam transmission is compared to the broad-beam transmission through lead for 6-MV X-rays. Simulated values are shown as (i) data points, calculated values are curves, (ii) monoenergetic calculation, and (iii) energy spectrum calculation. The incident photon spectrum is shown in the inset.

Narrow-beam transmission is compared to the broad-beam transmission through lead for 10-MV X-rays. Simulated values are shown as (i) data points, calculated values are curves, (ii) monoenergetic calculation, and (iii) energy spectrum calculation. The incident photon spectrum is shown in the inset.

The transmission curves for the Cobalt-60 beam are shown in Figure 4, with simulated values as data points and calculated curves as dashed or solid lines. The method of calculation, which incorporates the primary and first scatter contributions, was discussed previously. Based on the calculated results, we conclude that: (i) the transmission curves are pure exponentials for all field sizes and depths of measurement and (ii) at a given depth in phantom the slope of the transmission curve depends on the field size, where a larger field will give a more penetrating beam due to the increase in scattering contributions from the attenuator to the point of measurement.
The simulated data essentially agrees with the calculated curves with two exceptions, however. First, for narrow radiation beams the slope of the simulated transmission curve does depend on the depth of measurement in phantom, and second, the deviation from narrow-beam geometry for large fields is larger for the simulated data than for the calculated curves. The first effect can be explained by assuming that the narrow Cobalt-60 beam contains, in addition to monoenergetic photons (1.25 MeV), some lower energy photons originating in the source capsule and the collimator.Reference Joshi, Darko, Vidyasagar and Schreiner21 The lead attenuator and water phantom preferentially attenuate these low-energy photons and consequently harden the beam, making the transmission beam measured at large phantom depths more penetrating. The calculation, on the other hand, assumes a monoenergetic photon spectrum and therefore does not predict this effect. For large fields this beam-hardening effect is less pronounced because it is counterbalanced by an increased contribution of the low-energy scattering from the attenuator to the dose measured at shallow phantom depths. This will bring the slope of the transmission curve for shallow depth closer to the slope measured at larger depths. The second effect, the discrepancy between calculated and simulated attenuation curves for large radiation fields, is explained by an increased importance of the multiple scattering, which the calculation ignores for these large fields.
Calculated and simulated attenuation curves in lead for a 4-MV X-ray beam are shown in Figure 5 for two depths in phantom (d max and 30cm) and two field geometries (2 × 2 and 30 × 30cmReference Fano2). The calculated curves are shown as solid and dashed lines, whereas the simulations are represented by data points. For both field sizes, the in-air simulations coincided with d max data and are therefore not shown. Both the narrow and broad beams undergo beam-hardening effects, causing the slope of the transmission curve to become less steep as the lead thickness increases. Similar to the Cobalt-60 beam curves above, the simulated attenuation curves of the 4-MV X-ray beam exhibit depth dependence. For shallow depths of simulations, the larger the attenuator thickness, the more penetrating is the transmission curve for a given field size. It is interesting to note, however, that the narrow-beam curve, simulated at a depth of 30cm in the water phantom, is actually slightly more penetrating than the curve simulated for the 30 × 30cmReference Fano2 field at the same depth. This is in contrast to curves simulated at d max or in air, for which the narrow-beam transmitted fraction is considerably smaller than the transmitted fraction for the broad beam at the same lead thickness. This latter effect can be again explained with contributions of scattered photons from the lead attenuator into the point of measurement placed at shallow phantom depths. This scattered radiation, however, will not reach large depths in phantom, causing the beam penetrating power reversal with field size at the 30-cm depth shown in Figure 5.
The monoenergetic calculation assuming an effective beam energy of 1.25 MeV for the 4-MV beam, of course, gives pure exponentials similar to curves for the Cobalt-60 beam (Figure 4). It predicts only field-size dependence but no depth dependence, and therefore does not agree with simulated data. Because of the much greater attenuator-to-phantom distance (70 cm) the calculated field-size dependence was less pronounced than that for the Cobalt-60 beam. Therefore, only the calculated curve for the 30 × 30 cmReference Fano2 beam is shown in Figure 5. The calculations based on a 4-MV spectrum obtained from Mohan and ChuiReference Mohan and Chui17 and shown in the inset to Figure 5, however, give attenuation curves that agree to within 2% with the simulated data, properly predicting the field-size dependence and the penetrating power inversion for large field sizes at large depths in the water phantom.
The relatively good agreement between the calculated and simulated transmission curves of Figure 5 can be mainly attributed to the spectral calculation incorporating beam-hardening effects, which predict well the depth dependence for a given field size. The first scatter calculation then predicts the field-size dependence at a given depth, but falls short of perfect agreement with simulated data because of the neglect of multiple scatter.
The 6-MV transmission data shown in Figure 6 exhibit similar behaviour to that of the 4-MV beam of Figure 5, except that the beam-hardening effects are less pronounced. Attenuation curves simulated at d max again show a strong dependence on field size, while the two curves simulated at a depth of 30 cm for the narrow and broad-beam geometry are essentially identical. Monoenergetic calculations again predict a pure exponential behaviour and do not conform to simulated data. Only minimal field-size dependence is exhibited, therefore again only the curve for the large field is shown. Calculations using a spectral distributionReference Mackie16 shown in the inset to Figure 6, on the other hand, give attenuation curves that agree to within 1% with simulated data, accurately accounting for the beam-hardening effects as well as the depth and field-size dependence.
The attenuation data for the 10-MV beam are shown in Figure 7. No beam-hardening effects are apparent and the monoenergetic calculations assuming an effective beam energy (1.96 MeV) yield exponential curves very similar to those calculated using a 10-MV spectrumReference Wong, Henkelman, Fenster and Johns15 shown in the inset to Figure 7. Thus, the spectrum calculations offer no great improvement over the monoenergetic calculations for the 10-MV beam. The maximum deviation from simulated data is 10% for the monoenergetic calculations and 5% for the spectrum calculations. There is a field-size effect, i.e., broad beams appear to be more penetrating than narrow beams; the depth dependence of attenuation curves for the same field size, however, is minimal.
Contributions to total dose in phantom
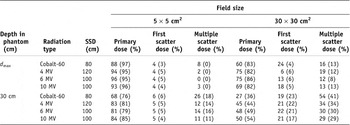
The attenuation data obtained above for various radiation beams indicate a very complicated behaviour depending on the beam spectral distributions, radiation field size and depth in the water phantom. We have shown that the simple calculations accounting for the primary beam and the first scattered beam of the attenuator and phantom give reasonably accurate predictions of dose. This is substantiated in Table 3, which shows the relative importance of the primary, first scatter, and multiple scatter dose with and without a 3.6-cm-thick lead attenuator for four radiation beams with two field sizes (5 × 5cmReference Fano2 and 30 × 30cmReference Fano2) and two depths in water phantom (d max and 30 cm).
Fraction of the total dose due to primary, first scatter, and multiple scatter dose with and without a 3.6-cm lead attenuator in the beam. The value without attenuator is shown in brackets.

The total dose with and without the lead attenuator was obtained from simulated data, the primary and first scatter dose from analytical calculations using an incident spectrum of energies as discussed above, and the multiple scatter dose by subtracting the sum of the primary and first scatter dose from the total dose.
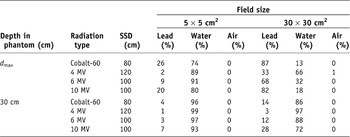
As expected, the relative contribution of the primary dose is high for small radiation fields and shallow depths in phantom. It decreases with field size for the same depth and with depth for the same field size. Consequently, the relative contribution of the first and multiple scatter dose show opposite trends, increasing with field size for same depth and with depth for the same field size. The relative contributions to the dose are, of course, affected by the attenuator and its particular geometry; more so for shallow depths in the water phantom as evident from Table 3. The contribution of multiple scatter radiation to the total dose increases with the depth in the water phantom for a constant field size, and with field size for a constant depth. Although the multiple scatter contribution becomes significant for large fields and depths in phantom, the difference between the simulated broad- and narrow-beam transmission curves becomes smaller at large depths as shown in Figures 4–7. Therefore, ignoring the multiple scatter in the calculation has little effect on the agreement between simulated and calculated transmission curves. Table 4 gives relative contributions to the first scatter dose of Table 3 by the three layers of media traversed by the beam (lead, air and water).
Fraction of the first scattered dose coming from the three layers of the phantom in Figure 2 with a 3.6-cm lead attenuator in the beam

As expected, the contribution from air is negligible, the relative contributions from lead and phantom, however, vary considerably depending on field size, depth in phantom and the radiation beam spectrum.
CONCLUSIONS
The recent increase in utilization of high- density materials not only as missing tissue compensators but also as partial attenuators of dose to certain organs in the radiotherapy beam requires a better understanding of the effects these materials have on the radiation beam. Moreover, improved calculation methods are required to predict dose distributions in patients when attenuators are utilized, or vice versa, methods should be available to calculate the appropriate dimensions of attenuators in order to obtain prescribed dose distributions in patients.
Present techniques account only for primary beam transmission through attenuators, assuming narrow-beam geometry. Yet, attenuators have more profound effects on the radiation beam, such as beam hardening or softening and production of scattered radiation. As a major portion of the total dose at a given point in the patient consists of primary and first scatter dose, analytical calculations of these give a good approximation to the behaviour of the dose. For larger field sizes, the calculations are less accurate because of the increased contribution of second- and higher-order scattering. Nevertheless, for the monoenergetic radiation beam, good agreement between the simulated and calculated transmission values is obtained and the increase in transmission fraction with field size is correctly predicted. For accelerator beams, if an incident energy spectrum is used in the calculations, the beam hardening with depth in phantom and thickness of attenuator is accounted for and the transmitted dose is correctly calculated. These calculations are an improvement over narrow-beam transmission calculations and can predict reasonably well the transmission for any radiation beam using any field size and various attenuator thicknesses. Simulations reported here were performed with attenuators covering the whole radiation beam, a situation that is only rarely encountered in radiotherapy as the attenuator usually covers only a part of the radiation beam. Preliminary simulations have indicated that in such cases there are significant variations of the transmission fraction with depth in phantom and size of the attenuator. This study, however, provides a useful analysis of the behaviour of the various radiation components in phantoms under attenuators and it may thus form the basis for the development of a suitable calculation algorithm to account for the scattering conditions in attenuators smaller than radiation field size.