Implications
Reducing fat quantity in the carcass has been a primary objective of pig farmers for a long time and considerable improvements have been accomplished in this domain. Increasing attention, including from a genetic point of view, has been devoted in the last few decades to the qualitative characteristics of the fat compartment of pig carcasses. Potential interest for pig meat industry and consumer acceptability refers to three main items, namely eating quality of fresh pork and processed pork products, nutritional aspects of human health, and technological quality of fat depots (e.g. avoiding the ‘soft fat’ condition). This study aims to provide information on the genetic variation and covariation for porcine fat quality traits.
Introduction
Along with the advances performed in pig nutrition and management, breeding effort has largely proven to be effective since the years 1950 to 1960 for reducing the whole fatness of pig carcasses. A lot of early results from breed comparisons or selection experiments (e.g. Wood et al., Reference Wood, Enser, MacFie, Smith, Chadwick, Ellis and Laird1978; Scott et al., Reference Scott, Cornelius and Mersmann1981) have rapidly shown that this quantitative decrease of fat deposition is accompanied by a number of more or less undesirable changes in composition and quality of fat depots throughout the body. Research workers have also addressed the question of to what extent carcass leanness is genetically correlated with quantitative development and chemical composition of intramuscular fat, as reviewed by Sellier (Reference Sellier1998). However, the amount of information remains fairly limited on the genetic parameters of most traits of interest in this field. In particular, studies dealing with the ‘between-tissue’ genetic relationships for homologous compositional traits are very scarce.
The purpose of our investigation mainly consisted of examining the genetic parameters (heritabilities (h 2) and genetic correlations (ra)) for compositional traits of three porcine tissues (subcutaneous back fat (BF), body cavity perirenal fat (PF) and longissimus muscle (LM)) in the widely used Large White (LW) and Landrace (LR) breeds.
Material and methods
Animals
Data for this study were collected on LW and LR female pig and castrated male pigs tested in four French central sib-testing stations. An ‘all in-all out’ (batch) system was practised in these stations. All batches comprised both LW and LR pigs. Some of the batches comprised both females and castrated males, but most batches consisted of either females or castrated males. A contemporary group was, therefore, defined here as a group of animals of the same gender and reared in the same barn and period.
A total of 2483 pigs (1882 LW and 601 LR) were reared in pens of two animals (two full-sibs, as a general rule) from 35 to 100 kg body weight (BW). Pigs were fed ad libitum a pelleted diet based on barley, wheat and soybean meal and containing 9.0 MJ/kg net energy and 170 g/kg crude protein. Data for lipid content (L%) and water content (W%) of BF and LM and fatty acid composition (FAC) of BF were collected on a subsample of 948 to 959 animals. In addition, 297 animals were recorded for FAC of muscle lipids and 209 to 215 animals for lipid content, water content and FAC of PF. Animals included in the various subsamples were chosen in order to have datasets with the most appropriate familial structure for an optimal estimation of genetic parameters.
Traits
Pigs were slaughtered at an average BW of 99.6 kg (s.d. = 4.3 kg). After 24 h at 4°C, cold carcass was weighed, and weights of seven cuts resulting from a standardised cutting of the left-hand side of the carcass (ham, loin, shoulder, belly, BF, PF, and feet) were recorded. Carcass lean percentage (LEAN) was estimated by the following formula: LEAN = −0.75 + 80 H + 106 L + 48 B − 50 BF − 66 PF, where H, L, B, BF and PF are the ratios of ham, loin, belly, backfat and perirenal fat weights to half-carcass weight, respectively. Lean tissue growth rate (LTGR) was calculated from average daily gain (ADG) from 35 to 100 kg BW, killing out percentage and LEAN, under the assumption that the ratio of lean tissue weight to empty BW remains unchanged during the test period (Fowler et al., Reference Fowler, Bichard and Pease1976).
At the time of carcass cutting, samples of around 100 g of subcutaneous BF (both inner and outer layers) and around 100 g of LM were removed at the 13th to 14th rib level. Around 100 g of PF were also taken on a proportion of pigs. These tissue samples were stored at −20°C for subsequent laboratory analyses.
Total lipid content of adipose tissues was determined by using the refractometric method described by Arneth (Reference Arneth1972). Water content was calculated from the weight loss of a 10 g sample of fat after drying at 105°C for 2 h. After extraction of lipids by chloroform, methylation of fatty acids was performed on an aliquot of 50 mg of lipids (Christopherson and Glass, Reference Christopherson and Glass1969). FAC was determined using a Delsi Di-700 gas chromatography apparatus (Delsi-Nermag Instruments, Argentenil, France), equipped with a flame ionisation detector.
Regarding muscle tissue, total lipid content was determined on a 10 g sample following Arneth (Reference Arneth1972) and water content was calculated from the weight loss of a 5 g sample after drying at 105°C for 24 h. FAC of muscle lipids was determined by gas chromatography of methyl esters as above. Total lipids were extracted according to Maxwell et al. (Reference Maxwell, Marmer, Zubillaga and Dalickas1980). Methyl esters of fatty acids were prepared using a modification of the method proposed by Pelick and Mahadevan (Reference Pelick and Mahadevan1975) with petroleum ether and hexane replacing benzene and diethyl ether, respectively.
Lipid and water contents were expressed as gram per 100 g of fresh tissue. The traits analysed to account for FAC of fat and muscle lipids were:
• proportions of the major fatty acids (C14:0, C16:0, C16:1, C18:0, C18:1, C18:2, C18:3 and C20:4), expressed as percentages of total identified fatty acids,
• percentages of saturated fatty acids (SFA), monounsaturated fatty acids (MUFA) and polyunsaturated fatty acids (PUFA), taking into account the above-cited major fatty acids and all identified minor fatty acids of the three classes (i.e. C10:0, C12:0, C15:0, C17:0 and C20:0 for SFA; C17:1 and C20:1 for MUFA; C20:2, C20:3, C22:4, C22:5 and C22:6 for PUFA),
• coefficient of unsaturation of lipids (UNSAT), defined as the average number of double bounds of unsaturated fatty acids, and
• ratio of polyunsaturated to saturated fatty acids (P/S).
Statistical analyses
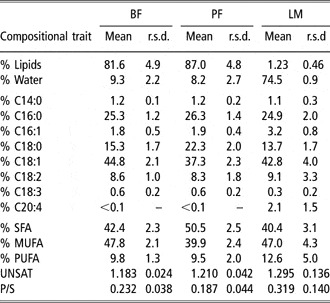
Table 1 gives the means and s.d. of the tissue compositional traits under study. Breed means were estimated using an ANOVA model including the fixed effects of breed and contemporary group and the slaughter weight as a covariate. The average number of animals per contemporary group was 17.9 for PF traits and 19.8 for BF and LM traits.
Means and residual standard deviations for tissue compositional traitsFootnote a

BF = backfat; PF = perirenal fat; LM = longissimus muscle; r.s.d. = residual standard deviation; SFA = saturated fatty acids; MUFA = monounsaturated fatty acids; PUFA = polyunsaturated fatty acids; UNSAT = coefficient of unsaturation of lipids; P/S = ratio of polyunsaturated to saturated fatty acids.
a r.s.d. were calculated from the error mean square of the ANOVA model with breed and batch as fixed effects and slaughter BW as a covariate.
Variance-covariance components were estimated using the restricted maximum likelihood methodology applied to a multiple-trait animal model. Analyses were performed with the VCE software package (Neumaier and Groeneveld, Reference Neumaier and Groeneveld1998). The mixed linear model comprised the same fixed effects and covariate as above, the random effect of litter of birth and the random additive genetic effect of the animal. The number of animals in the pedigree file ranged from 950 to 7653 depending on the group of traits under analysis. Phenotypic correlations among traits (rp) were calculated from the sums of litter, animal and residual components of variances and covariances, that is on a within breed, batch and slaughter weight basis. Approximate standard errors of estimated heritabilities (h 2) and genetic correlations (ra) were obtained from an approximation of the Hessian matrix when convergence was reached.
Results and discussion
Differences between tissues
As could be expected, large differences in chemical composition were found between the three tissues dealt with in this study (Table 1), and these differences are in general agreement with the findings of previous studies (e.g. Malmfors et al., Reference Malmfors, Lundström and Hansson1978; Wood et al., Reference Wood, Buxton, Whittington and Enser1986; Monziols et al., Reference Monziols, Bonneau, Davenel and Kouba2007). PF as compared with BF contains more lipids, and these lipids exhibit a lower ratio of MUFA to SFA. The high lipid content displayed by PF is likely to be partly because of the higher activities of lipogenic enzymes in this adipose tissue compared with subcutaneous fat (Anderson et al., Reference Anderson, Kauffman and Kastenschmidt1972), although the preferential sites of lipid storage could differ from preferential sites of lipid synthesis according to Mourot et al. (Reference Mourot, Kouba and Peiniau1995).
The average value of intramuscular fat content (1.23%) was low in this study compared with other studies dealing with the LM. This fact may be partly explained by the anatomical location of muscle sampling (13th to 14th rib level) where the minimal marbling within the LM is exhibited according to Faucitano et al. (Reference Faucitano, Rivest, Daigle, Lévesque and Gariepy2004).
It has been known for a long time that the degree of saturation of fatty acids increases from the outside to the inside of the body. This point is well illustrated by the compared FAC of subcutaneous BF and internal PF. Regarding the markedly lower C18:1 content of PF, the lower activity of Δ9 fatty acid desaturase (stearoyl-CoA-desaturase) in this adipose tissue (Thompson and Allen, Reference Thompson and Allen1969) is primarily involved. The difference in temperature between the subcutaneous area and internal body cavity could play a role as the activity of Δ9 fatty acid desaturase is negatively linked to temperature (Kouba et al., Reference Kouba, Hermier and Le Dividich1999). As far as extrinsic factors are concerned, the wide range observed among studies for the average linoleic acid content of fat depots is to be ascribed to differences in slaughter weight and gender/castration status of the animals (e.g. Malmfors et al., Reference Malmfors, Lundström and Hansson1978; Wood et al., Reference Wood, Buxton, Whittington and Enser1986) and, predominantly, to differences in dietary linoleic acid level (e.g. Brooks, Reference Brooks1971).
The comparatively high-PUFA content of intramuscular lipids is essentially linked to the phospholipid fraction of total muscle lipids. The PUFA percentage of phospholipids (major components of cell membranes) is indeed 35% to 45% compared with 7% to 15% for triacylglycerols in the pig, as reviewed by De Smet et al. (Reference De Smet, Raes and Demeyer2004). This increase in PUFA percentage is essentially made at the expense of MUFA percentage, which is around 20% in phospholipids and 50% in triacylglycerols (Sharma et al., Reference Sharma, Gandemer and Goutefongea1987).
It may also be noted from Table 1 that s.d. of FAC traits are consistently larger in muscle than in fat depots. The most likely reason lies in the strong dependence of FAC of muscle lipids upon intramuscular lipid content (see below) and the high coefficient of variation (37%) of the latter trait.
Breed differences
Differences between LW and LR breeds were in general of small-to-moderate magnitude, whereas being statistically significant for a number of traits (data not shown). LTGR was higher in LW (377 g/day) than in LR pigs (352 g/day), owing to higher performance levels for both daily weight gain (+20 g/day) and carcass lean content (+1.3 percentage units). Minor breed differences were found for lipid and water contents in the three tissues studied. Regarding FAC, the prominent feature is that the proportion of MUFA was greater in all three tissues in LR compared with LW pigs (e.g. 48.5 ± 0.13 and 47.5 ± 0.09, respectively, in BF). The higher proportion of MUFA was mainly caused by more C18:1 in LR than in LW pigs. Our findings are in accordance with the results reported by Guéblez et al. (Reference Guéblez, Sellier and Runavot1993) for BF in the same two populations. A greater activity of the Δ9 fatty acid desaturase in the LR could be at the origin of the breed difference in concentration of C18:1.
Heritabilities
Heritability estimates found here for production traits (from 0.39 to 0.67) were within the usual range of literature values. Our h 2 estimate for LTGR (0.65 ± 0.04) was, however, greater than the previously reported values of around 0.4 to 0.5, because of the relatively high heritability estimates for both ADG and killing out percentage in this study.
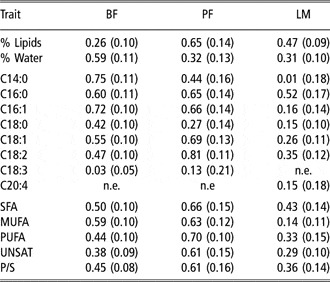
Table 2 shows h 2 estimates for compositional traits of BF, PF and LM. Water and lipid contents of the three tissues were moderately to highly heritable (range of h 2 estimates: 0.26 to 0.65). Regarding the heritability of water content of BF, Cameron (Reference Cameron1990) reported a value (0.27), which is lower than our estimate while being comparable with our h 2 estimate for water content of PF. The value of 0.46 found here for the heritability of intramuscular fat content is very close to the average literature value quoted by Sellier (Reference Sellier1998). Furthermore, our h 2 estimate for water content of LM was of the same order as those reported by Cameron (Reference Cameron1990), Lo et al. (Reference Lo, McLaren, McKeith, Fernando and Novakofski1992) and Larzul et al. (Reference Larzul, Lefaucheur, Ecolan, Gogué, Talmant, Sellier, Le Roy and Monin1997).
Heritability estimates (s.e. in brackets) for tissue compositional traits

BF = backfat; PF = perirenal fat; LM = longissimus muscle; SFA = saturated fatty acids; MUFA = monounsaturated fatty acids; PUFA = polyunsaturated fatty acids; UNSAT = coefficient of unsaturation of lipids; P/S = ratio of polyunsaturated to saturated fatty acids; n.e. = not estimable.
Our h 2 estimates for the variables pertaining to FAC of the two fat depots were medium-to-high, with most estimates in the range from 0.40 to 0.70. This pattern of h 2 values is in good agreement with that reported by Schwörer et al. (Reference Schwörer, Morel, Prabucki and Rebsamen1988), Cameron (Reference Cameron1990) and Suzuki et al. (Reference Suzuki, Ishida, Kadowaki, Shibata, Uchida and Nishida2006). Standard errors of the h 2 estimates relating to PF are rather large in this study but there is a consistent trend for higher h 2 of linoleic acid content, PUFA percentage, UNSAT and P/S in PF compared with BF. Four different fat depots (inner and outer layers of BF, PF and belly fat) were investigated by Schwörer et al. (Reference Schwörer, Morel, Prabucki and Rebsamen1988) and h 2 estimates for concentrations of major fatty acids were found to be globally comparable between these sites of fat deposition. A similar situation was found by Suzuki et al. (Reference Suzuki, Ishida, Kadowaki, Shibata, Uchida and Nishida2006) for h 2 estimates relating to the fatty acid profile of intermuscular fat and inner and outer layers of BF.
Most of h 2 estimates reported in Table 2 for fatty acid percentages of intramuscular lipids are below 0.40 and, therefore, tend to be lower than those of PF and, to a lesser extent, BF. About the same pattern of h 2 estimates as in this study were found in the few genetic studies dealing with the FAC of intramuscular lipids. Previous studies referred to LR and Duroc pigs (Cameron and Enser, Reference Cameron and Enser1991), Duroc pigs (Suzuki et al., Reference Suzuki, Ishida, Kadowaki, Shibata, Uchida and Nishida2006) and crossbred pigs having an LW × LR × Pietrain genetic background (Colman et al., Reference Colman, Janssens, Ntawubizi, Raes, Buys and De Smet2008). Unweighted means of the h 2 estimates found in the three above-cited studies and the current one amount to 0.33, 0.37, 0.35, 0.37, 0.40 and 0.24 for palmitic, stearic, palmitoleic, oleic, linoleic and arachidonic acid contents of total muscle lipids, respectively. Furthermore, Colman et al. (Reference Colman, Janssens, Ntawubizi, Raes, Buys and De Smet2008) stated that genetic variation in FAC of muscle lipids is partly independent from intramuscular lipid content.
Within-tissue relationships among compositional traits
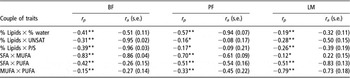
Table 3 gives estimates of phenotypic and genetic correlations among some compositional traits of the same tissue. The opposition between lipid content and water content was stronger for adipose depots than for muscle in this study. It should, however, be pointed out that Cameron (Reference Cameron1990) and Larzul et al. (Reference Larzul, Lefaucheur, Ecolan, Gogué, Talmant, Sellier, Le Roy and Monin1997) reported a genetic correlation amounting to around −0.7 between lipid and water contents of LM.
Within-tissue rp and ra correlations between some compositional traits

rp = phenotypic correlation; ra = genetic correlation; UNSAT = coefficient of unsaturation of lipids; P/S = ratio of polyunsaturated to saturated fatty acids; SFA = saturated fatty acids; MUFA = monounsaturated fatty acids; PUFA = polyunsaturated fatty acids.
Phenotypic correlations of lipid content with UNSAT and P/S were significantly negative in all tissues and ranged from −0.16 to −0.39. Corresponding estimates of genetic correlations were also negative, but lipid content and FAC of PF were poorly correlated at the genetic level. The strongly negative phenotypic (−0.50) and genetic (−0.90) correlations reported by Suzuki et al. (Reference Suzuki, Ishida, Kadowaki, Shibata, Uchida and Nishida2006) between lipid content and C18:2 content in LM from Duroc pigs denote a closer association between the two traits than in our study. The genetic trends observed in a five-generation selection experiment for increased intramuscular content in Duroc pigs also showed a substantial correlated response consisting of a decrease in linoleic acid content in loin muscle, whereas other fatty acids were essentially unaffected (Burkett et al., Reference Burkett, Baas, Beitz, Schwab, Berry and Zhang2007). This antagonistic relation between intramuscular lipid content and PUFA percentage is to be connected with the augmentation of triacylglycerols in comparison to phospholipids in muscle lipids from animals having higher levels of intramuscular fat. Phospholipid content indeed shows a low variability among individuals in a given muscle. Sharma et al. (Reference Sharma, Gandemer and Goutefongea1987) reported a mean of 0.6 g (s.d. = 0.1 g) per 100 g of wet tissue for phospholipids v. a mean of 1.4 g (s.d. = 1.0 g) for triacylglycerols in the LM of LW pigs. As a consequence, the variation among individuals in intramuscular fat content merely results from the more or less pronounced accumulation of triacylglycerols.
Regarding the relationships among the three families of fatty acids (SFA, MUFA and PUFA), genetic correlations were generally of the same order as phenotypic correlations. It appears that MUFA shows a stronger opposition to SFA than to PUFA in BF and, to a lesser extent, in PF. This pattern of relationships was also observed for subcutaneous fat of Iberian pigs by Fernandez et al. (Reference Fernandez, de Pedro, Nunez, Silio, Garcia-Casco and Rodriguez2003). By contrast, MUFA reveals to be more opposed to PUFA than to SFA in intramuscular fat, for which the opposition of PUFA to both SFA and MUFA is prevalent. Phenotypic correlations found by Cameron and Enser (Reference Cameron and Enser1991) among the major fatty acids of intramuscular fat (C16:0, C18:0, C18:1 and C18:2) show the same associations as above, with strongly negative correlations of C18:2 with both C18:1 and C16:0.
‘Between-tissue’ relationships among homologous compositional traits
Phenotypic and genetic correlations between homologous compositional traits of the three tissues are reported in Table 4.
The rp and ra correlations between homologous traits of backfat, perirenal fat and longissimus muscle

BF = backfat; PF = perirenal fat; LM = longissimus muscle; rp = phenotypic correlation; ra = genetic correlation; UNSAT = coefficient of unsaturation of lipids; P/S = ratio of polyunsaturated to saturated fatty acids.
Significant positive phenotypic correlations ‘between’ back and PF depots were found for lipid content, water content and FAC, but they were far from being unity. For example, there was a correlation of around 0.50, at both phenotypic and genetic levels, between the coefficients of unsaturation of the two fat tissues. Positive genetic correlations of equivalent or even higher magnitude were reported by Suzuki et al. (Reference Suzuki, Ishida, Kadowaki, Shibata, Uchida and Nishida2006) between homologous fatty acid contents of subcutaneous fat and intermuscular fat.
Phenotypic correlations between the characteristics of adipose depots and the homologous characteristics of muscle were found to be low in this study. A safe interpretation of the corresponding genetic correlations is made difficult by the large standard errors of most estimates. Positive phenotypic correlations ‘between’ LM and inner BF layer were reported by Cameron and Enser (Reference Cameron and Enser1991) for contents of major fatty acids, with closer correlations for saturated fatty acids (0.4 to 0.5) than for unsaturated fatty acids (0.2 to 0.3). Interestingly, Suzuki et al. (Reference Suzuki, Ishida, Kadowaki, Shibata, Uchida and Nishida2006) found that genetic correlations ‘between’ subcutaneous or intermuscular adipose tissues and LM ranged from 0.4 to 0.8 for C16:0, C18:0 and C18:1 concentrations but fell to less than 0.2 for C18:2 concentration. The latter result for C18:2 is in fairly good agreement with our own results for both UNSAT and P/S that are very closely linked to C18:2 content.
As a general rule, few quantitative trait loci (QTL) have been so far found to simultaneously affect the FAC of different fat depots, which is consistent with the fairly moderate genetic relationships ‘between’ tissues for that trait. However, Nii et al. (Reference Nii, Hayashi, Tani, Niki, Mori, Fujishima-Kanaya, Komatsu, Aikawa, Awata and Mikawa2006) reported that two QTL located on pig chromosomes (SSC) 4 and 5 influence C18:2 and long-chain PUFA content, respectively, in both PF and inner layer of BF. A SSC7 QTL affecting C18:2 content and P/S in both intramuscular and abdominal (belly) fat depots has also been detected by Guo et al. (Reference Guo, Ren, Yang, Ma, Zhang and Huang2008).
Recent findings have provided increasing evidence that lipid metabolism and other biological features displayed by skeletal muscle adipocytes differ from those displayed by subcutaneous, intermuscular or visceral adipocytes in the pig (e.g. Gardan et al., Reference Gardan, Gondret and Louveau2006; Gondret et al., Reference Gondret, Guitton, Guillerm-Regost and Louveau2008).
Relationships between tissue compositional traits and production traits
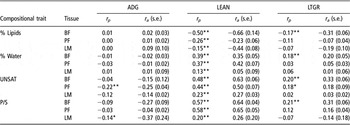
Table 5 gives estimates of phenotypic and genetic correlations between three production traits (ADG, LEAN and LTGR) and four tissue compositional traits (lipid and water contents, UNSAT and P/S).
The rp and ra correlations between production traits and compositional traits of backfat, perirenal fat and longissimus muscle

rp = phenotypic correlation; ra = genetic correlation; ADG = average daily gain; LEAN = carcass lean percentage; LTGR = lean tissue growth rate; BF = backfat; PF = perirenal fat; LM = longissimus muscle; UNSAT = coefficient of unsaturation of lipids; P/S = ratio of polyunsaturated to saturated fatty acids.
Average daily gain
Phenotypic and genetic correlations of ADG with lipid and water contents of adipose depots and LM were close to zero or of small magnitude. De Vries et al. (Reference De Vries, van der Wal, Long, Eikelenboom and Merks1994) also reported that intramuscular fat content is genetically independent from ADG. Nevertheless, moderately positive genetic correlations between the two traits were found by Hovenier et al. (Reference Hovenier, Kanis, van Asseldonk and Westerink1992), Lo et al. (Reference Lo, McLaren, McKeith, Fernando and Novakofski1992) and in early studies reviewed by Schwörer et al. (Reference Schwörer, Morel, Prabucki and Rebsamen1990).
Relationships between ADG and FAC traits were of low-to-moderate magnitude, both phenotypically and genetically, in this study. A higher ADG tended to be genetically associated with a lower unsaturation degree of adipose depots, in accordance with the negative values (−0.18 to −0.51) reported by Suzuki et al. (Reference Suzuki, Ishida, Kadowaki, Shibata, Uchida and Nishida2006) between ADG and palmitoleic and linoleic acid contents in various fat depots. It should be kept in mind that a similar association occurs when variation in ADG is induced by system of feeding (ad libitum v. restricted feed allocation) as shown by Cameron and Enser (Reference Cameron and Enser1991) for muscle lipids and by Affentranger et al. (Reference Affentranger, Gerwig, Seewer, Schwörer and Künzi1996) for BF lipids. As for the genetic correlations of ADG with UNSAT and P/S values of muscle lipids, the moderately negative values found here agree with the results reported for C18:2 content by Suzuki et al. (Reference Suzuki, Ishida, Kadowaki, Shibata, Uchida and Nishida2006).
Carcass leanness
Relationships implying LEAN were much closer than those implying ADG and were globally consistent for the three tissues dealt with in this study.
Higher carcass leanness is genetically associated with lower lipid content, higher water content and increased unsaturation of adipose depots, which is a well-established feature in the pig (e.g. Scott et al., Reference Scott, Cornelius and Mersmann1981; Schwörer et al., Reference Schwörer, Morel, Prabucki and Rebsamen1988; Cameron, Reference Cameron1990; Suzuki et al., Reference Suzuki, Ishida, Kadowaki, Shibata, Uchida and Nishida2006). This pattern of within-population genetic relationships between carcass leanness and chemical composition of fat depots is also found at the between-population level in the frame of breed comparisons (e.g. Bout et al., Reference Bout, Girard, Runavot and Sellier1989; Warriss et al., Reference Warriss, Brown, Franklin and Kestin1990). More generally, any factor, genetic or non-genetic, contributing to a reduced whole fatness of pig carcasses generates correlated modifications of the properties of fat depots, namely an augmentation of water to lipid ratio and unsaturation of constituent fatty acids and, consequently, a decreased firmness and an increased risk of oxidation. The changes in fatty acid profile in fat depots of leaner animals results from a smaller contribution of de novo synthesised fatty acids (free from C18.2 and other PUFA in the pig) and, conversely, a greater contribution of dietary fatty acids, which are of vegetable origin in standard pig diets and, hence, contain C18:2 and other PUFA (Scott et al., Reference Scott, Cornelius and Mersmann1981).
The genetic relationships of LEAN with muscle compositional characteristics followed about the same pattern as above, though the relationships were less close. There exist many literature estimates of the genetic correlation between carcass lean to fat ratio and intramuscular content, as reviewed by Schwörer et al. (Reference Schwörer, Morel, Prabucki and Rebsamen1990) and Sellier (Reference Sellier1998). Our estimate of the genetic correlation between LEAN and lipid content of LM (−0.44 ± 0.08) is slightly higher, in absolute value, than most estimates previously reported. As for the association of LEAN with the unsaturation degree of muscle fatty acids, our positive ra estimates are generally in line with the findings of Cameron and Enser (Reference Cameron and Enser1991), Suzuki et al. (Reference Suzuki, Ishida, Kadowaki, Shibata, Uchida and Nishida2006) and Colman et al. (Reference Colman, Janssens, Ntawubizi, Raes, Buys and De Smet2008). This association is likely to operate mainly through the variation in intramuscular lipid content, a trait which is genetically linked to the same extent to both LEAN and UNSAT (or P/S), and the above-mentioned correlative change in the ratio of phospholipids to triacylglycerols among total muscle lipids.
Lean tissue growth rate
LTGR is a compound trait of interest as it roughly corresponds to the major selection objective of past and current pig breeding schemes in the area of growing animal characters (Nguyen et al., Reference Nguyen, McPhee and Wade2004).
Phenotypic and genetic correlations between LTGR and chemical composition traits of adipose and muscle tissues were low-to-moderate in this study. The traits being most closely associated with LTGR at the genetic level referred to subcutaneous BF with absolute values of ra estimates ranging from 0.20 to 0.33. On this basis, breeding for LTGR would therefore lead to an increase in water to lipid ratio and UNSAT in the BF depot. Moreover, we found a tendency to a negative genetic correlation (−0.19 ± 0.10) between LTGR and lipid accretion in the LM, whereas most estimates quoted by Schwörer et al. (Reference Schwörer, Morel, Prabucki and Rebsamen1990) are moderately positive.
It is worth mentioning here that the realised genetic trends resulting from 20 years of selection mainly based on ADG and BF thickness (hence, approximately for better LTGR) in the French LW breed (Tribout et al., Reference Tribout, Caritez, Gogué, Gruand, Bouffaud, Billon, Péry, Griffon, Brenot, Le Tiran, Bussière, Le Roy and Bidanel2004) were the followings: 77 ± 27 g for ADG (P < 0.01), 8.6 ± 1.7% for LEAN (P < 0.001), 4.6 ± 1.0% for water content of BF (P < 0.001), 0.033 ± 0.013 for UNSAT of BF (P < 0.05), 2.6 ± 0.8% for PUFA content of BF (P < 0.01), −2.3 ± 0.8% for SFA content of BF (P < 0.01), 0.07 ± 0.28% for water content of LM (P = 0.82), and 0.19 ± 0.63% for lipid content of LM (P = 0.63). The genetic trends pertaining to tissue compositional traits are in fairly good agreement, in sign and in compared magnitude, with the present ra estimates involving LTGR, except for the lack of significant change in intramuscular fat content. The latter discrepancy could partly result from the fact that the anatomical location of LM sampling differed between the two studies (13th to 14th v. 6th to 7th rib level).
Conclusions
This study confirms that the chemical composition of porcine fat and muscle tissues show a moderate-to-high within-breed additive genetic variation. Genetic correlations between these traits and growth rate are globally of small magnitude. On the contrary, tissue compositional traits are significantly correlated at the genetic level with carcass leanness. Breeding for leaner pigs is, therefore, expected to cause an increase in the ratio of water to lipids and the unsaturation degree of lipids, thus leading to a higher occurrence of the ‘soft fat’ condition and to a greater risk of lipid oxidation. The positive relationship between carcass leanness and lipid unsaturation mainly operates through the underlying variation in the ratio of de novo synthesised to dietary fatty acids in subcutaneous and visceral fats and through the respective importance of the phospholipid and triacylglycerol fractions among muscle lipids. Moreover, the highest genetic correlation ‘between’ back and perirenal sites of fat deposition for the same compositional traits does not exceed 0.6 and is therefore far from being unity. This finding supports the view that fat is not a unique tissue throughout the body. The lack of actually close relationships ‘between’ tissues for the unsaturation degree of constituent lipids is still more evident when separable depot fats, on one hand, and intramuscular fat, in contrast, are considered. Further research is needed for investigating muscles other than the widely studied LM in order to dispose of an ‘across-muscle’ knowledge of the fat component of muscle tissue in the pig.
Acknowledgements
The authors are indebted to all the persons who have efficiently contributed, at different steps, for the achievement of this study.